Get Indexology® Blog updates via email.

In This List

Food Inflation Bites into Income as Commodities March Higher

Building on Tradition: India’s Digital Reboot

Magnificent Mid Caps and Sensational Small Caps

Getting to Know the S&P Developed BMI Select Aerospace & Defense 35/20 Capped Index

2024 World Economic Forum: Key Themes to Watch

Food Inflation Bites into Income as Commodities March Higher

Contributor Image
Brian Luke

Senior Director, Head of Commodities, Real & Digital Assets

S&P Dow Jones Indices

Inflation continues to impact consumers and policymakers in negative ways. Hedging through broad commodities has proven to buffer portfolio returns, with the S&P GSCI up 5.38% this year. Going into the year, expectations of Fed rate cuts and continued declines in the Consumer Price Index (CPI) pushed inflation concerns aside. Since then, markets have experienced increased inflation figures and downsized rate cut bets. Commodities make up over one-third of the CPI, providing a direct hedge against upside inflation surprises. Americans have been spending more on food as a percentage of disposable income since the 1980s. The USDA’s most recent report1 highlights that 11.3% of income is being spent on food. The Fed may overlook volatile food and energy, preferring to focus on the Personal Consumption Expenditures Index (PCE), but even the PCE has followed the traditional CPI levels in its trend higher. More importantly, the S&P GSCI has historically tended to outperform when inflation surprises to the upside.

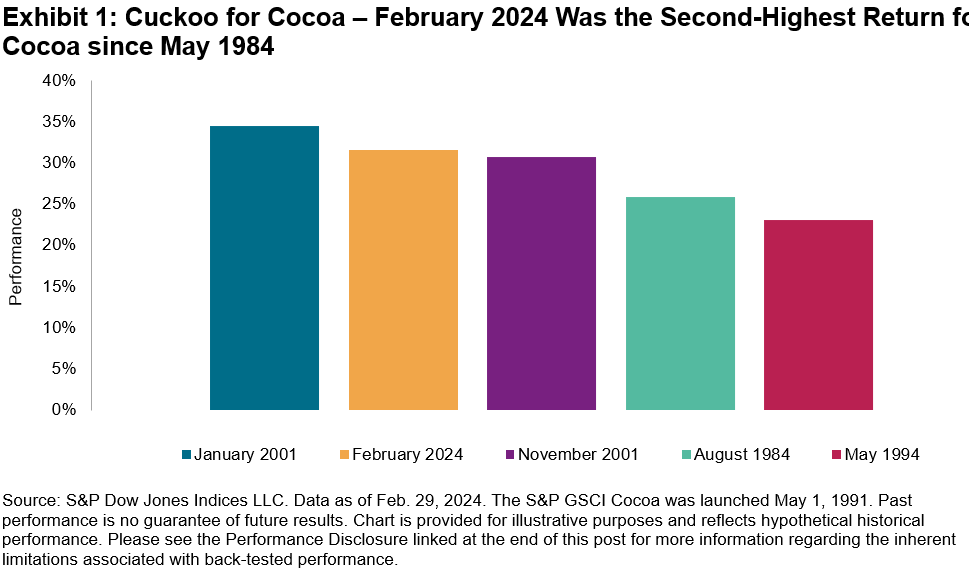
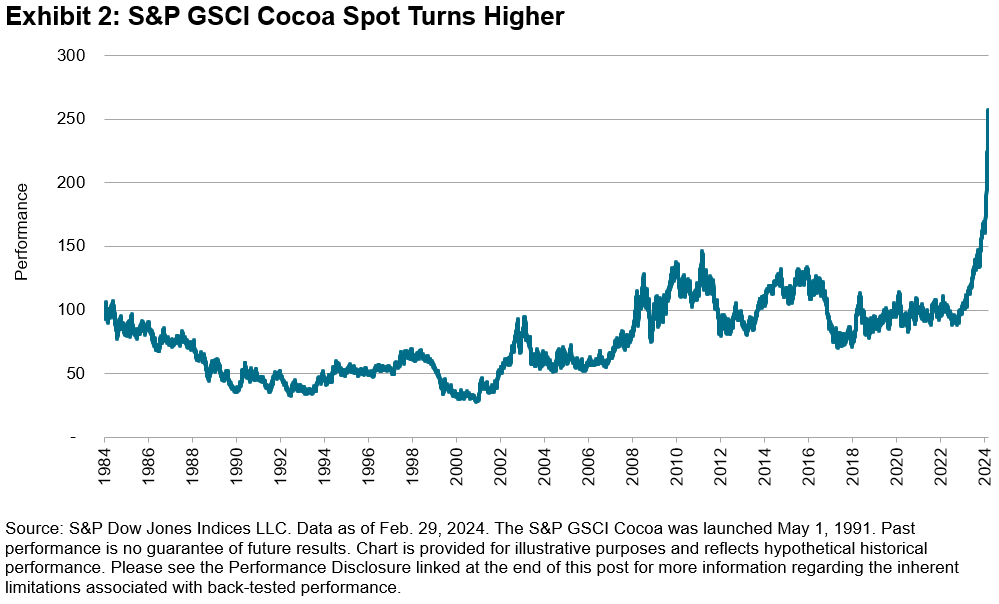
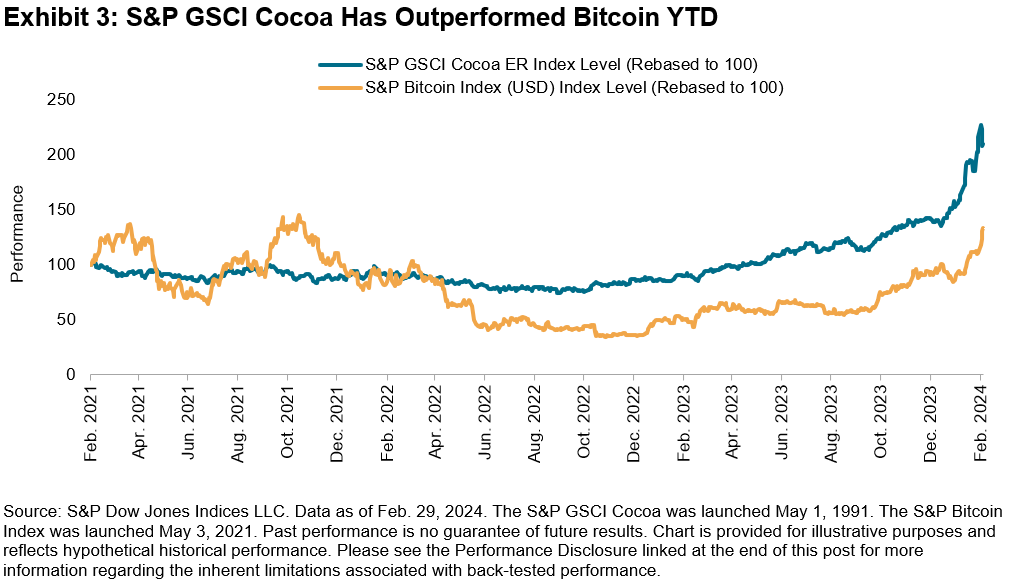
Fueled by hedge fund speculation, cocoa prices surged over 32% during the month to an all-time high and futures markets reported USD 8.7 billion in speculative cocoa contracts. Political instability and declining crop yields in West Africa cast a similar picture last seen during the 2001 bull run-up in cocoa, the best year on record dating back to 1984. On the heels of a 61% return in 2023, cocoa is up an additional 51% in 2024, even outperforming the S&P Bitcoin Index, which is up a paltry 47.5%.


1 https://www.ers.usda.gov/data-products/ag-and-food-statistics-charting-the-essentials/food-prices-and-spending/?topicId=2b168260-a717-4708-a264-cb354e815c67

The posts on this blog are opinions, not advice. Please read our Disclaimers.

Building on Tradition: India’s Digital Reboot

Contributor Image
Vidushan Ragukaran

Director, Thematic Indices

S&P Dow Jones Indices

India’s synonymous relationship with excellence in the field of technology is well known. This includes a notable roster of Indian-origin CEOs at the helm of global technology companies such as Adobe, Alphabet, IBM and Microsoft.1 This leadership is not only seen in companies abroad but also within India’s own borders, building on its reputation as a worldwide hub for IT and software development outsourcing.

India’s IT spending is forecast to grow by 10.7% in 2024, reaching USD 124.6 billion, rebounding after a decline in 2023. This will be, in part, driven by artificial intelligence and automation aimed at improving operational efficiency and addressing IT talent shortages. Software and IT services spending in India is expected to see the highest growth rates in 2024, up by 18.5% and 14.6%, respectively.2 Some 92% of Forbes Global 2000 companies use IT outsourcing, suggesting continued demand for India’s IT services on a global scale.3 India retained the top spot in the 2023 Global Services Location Index rankings, an indicator of the country’s attractiveness for hosting offshore business services.4

However, India’s digital strategy transcends its established IT sector, focusing on a nationwide transformation into a digitally advanced society. India’s internet economy, valued at around USD 175 billion in 2022, is projected to experience significant growth, reaching USD 1 trillion by 2030.5 This shift is guided by the “Digital India” campaign, aiming to upgrade online infrastructure, expand connectivity and digitize public services for its citizens.6 Last year, India’s population—approximately 1.43 billion people at the end of April 2023—surpassed China and became the world’s most inhabited country.7

The “India Stack,” a comprehensive suite of Application Programming Interfaces (APIs), is also facilitating innovation in digital payments, identity verification and data/service delivery. With billions of mobile transactions monthly and some 67 billion digital identity verifications, supported by platforms like Aadhaar, UPI and DigiLocker, India is marking its position as a global champion in open API technology.8

These technologies have been critical in supporting India’s push toward digitalization across various sectors, not just IT and software. For instance, they have allowed financial services to innovate with digital wallets and online transactions, healthcare services to improve with digital records and telemedicine, and educational services to expand through online platforms and digital content.

Launched last year, the S&P India Tech Index serves as a barometer of the performance of India-based companies engaged in digital technology, software and communications. The index uses FactSet’s RBICS revenue data to identify companies across selected activities that are integral to the digital economy. This approach captures not only standard IT functions such as enterprise software and consulting, but also extends to specialist operations like data centers, financial software and electronic payment services, offering a comprehensive view of companies driving the digital ecosystem. By applying a strict 90% revenue threshold for eligibility, it also ensures that only companies with a substantial digital footprint are included.

As Exhibit 1 highlights, the index brings together conventional IT companies with names from the Communication Services, Financials, Consumer Discretionary and Industrials sectors. The combination of India’s youthful, tech-savvy demographic—almost two-thirds of the population is under the age of 35—and a rising middle class is a powerful catalyst for the surging demand for and increasing spend on digital services across the country.9

Exhibit 2 shows that fintech, consumer-tech and other technology-led startups that span multiple sectors have secured more funding in India than traditional enterprise software-as-a-service (SaaS) businesses in recent years.10

India’s tech narrative goes well beyond its traditional IT expertise. To accurately measure the evolving Indian technology landscape through indices, a nuanced approach is necessary—one that acknowledges the broader, more inclusive definition of what constitutes a technology company today and looks ahead longer term.


1 The Economic Times (2023). 21 Indian-origin CEOs of billion dollar companies. Available at: https://economictimes.indiatimes.com/nri/work/sundar-pichai-satya-nadella-ajay-banga-arvind-krishna-and-20-other-indian-origin-ceos-of-billion-dollar-companies/sundar-pichai/slideshow/105593531.cms

2 Gartner (2023). Gartner Forecasts India IT Spending to Grow 11% in 2024. Available at: https://www.gartner.com/en/newsroom/press-releases/2023-11-28-gartner-forecasts-india-it-spending-to-grow-11-percent-in-2024

3 ISG (2019). 2019 ISG Momentum® Market Trends & Insights Geography Report. Available at: https://ei.isg-one.com/Research/GoToDocument?dashboardID=201a11ca-c115-4a33-a9f7-941eceefbbd1&code=2019-Momentum-Geography-Report&isLocked=True

4 Kearney (2023). The 2023 Kearney Global Services Location Index: Regenerative talent pools. Available at: https://www.kearney.com/service/digital-analytics/digital/gsli/2023-full-report

5 Google, Temasek and Bain & Company (2023). The e-Conomy of a Billion Connected Indians. Available at: https://www.bain.com/insights/e-conomy-india-2023/

6 India Brand Equity Foundation (2024). Digital India. Available at: https://www.ibef.org/government-schemes/digital-india

7 United Nations (2023). Department of Economic and Social Affairs Economic Analysis. UN DESA Policy Brief No. 153: India overtakes China as the world’s most populous country. Available at: https://www.un.org/development/desa/dpad/publication/un-desa-policy-brief-no-153-india-overtakes-china-as-the-worlds-most-populous-country/

8 IndiaStack (2024). Available at: https://indiastack.org/index.html

9 World Economic Forum (2019). This is how India can become the next Silicon Valley. Available at: https://www.weforum.org/agenda/2019/10/india-technology-development-silicon-valley/

10 S&P Global (2023). Startups Riding Digital Infrastructure Could Transform Indian Economy. Available at: https://www.spglobal.com/en/research-insights/featured/special-editorial/look-forward/startups-riding-digital-infrastructure-could-transform-indian-economy

The posts on this blog are opinions, not advice. Please read our Disclaimers.

Magnificent Mid Caps and Sensational Small Caps

Contributor Image
Sherifa Issifu

Senior Analyst, U.S. Equity Indices

S&P Dow Jones Indices

U.S. equities rose in 2023, with the mega-cap “Magnificent Seven” driving most of the S&P Composite 1500®’s 25% gain. While mega caps continued to outperform in January 2024, not all seven of the aforementioned group ranked highly. This has led to some market commentators looking to coin new phrases: “Sensational Six” or “Super Six” (the jury is still out on the new superhero-esque moniker, count and membership of our new set of mega caps).

Some market participants have sought to diversify their mega-cap exposure through the S&P 500® Equal Weight Index. Other smaller-size tools of diversification are the S&P MidCap 400® and the S&P SmallCap 600®, which have distinct characteristics and sector exposure from large caps.

U.S. small and mid caps have benefited from the small- and mid-size equity premium historically, outperforming the S&P 500 over the long run. Historically, there has also been a cyclicality among U.S. equity size ranges. While the S&P 400® and S&P 600® are smaller than large-cap U.S. equities, when looking abroad, the U.S. mid-cap and small-cap markets are equivalent to entire countries’ entire equity markets. Exhibit 1 shows that the S&P 400 would rank as the fourth-largest country in the S&P Global BMI and the S&P 600 is larger than South Korea (all based on float-adjusted market capitalization).

Differences in sector exposure among the U.S. equity size segments have also meant that the S&P 400 and S&P 600 are more domestically focused than the S&P 500, with higher weights in Industrials, Financials, and Real Estate. This has historically meant greater sensitivity to U.S. macro indicators, such as GDP growth, than large-cap stocks.

The differences in sector composition shown in Exhibit 2 in part help explain the non-perfect correlation (see Exhibit 3) between the S&P 500 and smaller-size-focused U.S. equity indices. These differences in sectors and correlation may present an interesting option to diversify with the S&P MidCap 400 and the S&P SmallCap 600, with a potential to reduce risk-adjusted return compared with the S&P 500 alone.

Interest rates may provide a tactical opportunity to diversify the large-cap S&P 500 with the S&P 500 Equal Weight Index, S&P MidCap 400 and S&P SmallCap 600, based on their different relative responses to interest rates under different regimes. Looking at monthly data since December 1994, Exhibit 4 shows that the S&P 500 rose about 66% of the time, while U.S. Treasury rates fell about 49% of the time (almost a coin flip). Current market expectations are of falling rates and a positive market environment, which happened one-third of the time. 2022’s dynamic of a falling stock market and rising rates was rare, occurring in 15% of months.

Exhibit 5 shows the historical relationships between interest rates and market regimes and the performance of various U.S. equity size ranges relative to the S&P 500. A key observation is that the direction of the stock market mattered more than the direction of interest rates in driving relative performance: the average relative performance changed by greater amounts based on market direction than on rate changes. Exhibit 5 also shows that the S&P MidCap 400, S&P SmallCap 600 and S&P 500 Equal Weight Index tended to outperform the S&P 500 in months when both the S&P 500 was up and U.S. 10-Year Treasury yields rose. The indices tended to perform in line with the S&P 500 when the large-cap U.S. equity bellwether gained and the U.S. 10-Year Treasury was down.

Of course, it is difficult to predict the direction of interest rates, the stock market, or both. But the historical performance of smaller U.S. size segments, their distinct characteristics and their sheer size mean that market participants may wish to consider the S&P 400 and S&P 600 as additional tools in their U.S. equity choices.

The posts on this blog are opinions, not advice. Please read our Disclaimers.

Getting to Know the S&P Developed BMI Select Aerospace & Defense 35/20 Capped Index

Contributor Image
Darius Nass

Associate Director, Global Equity Indices

S&P Dow Jones Indices

The S&P Developed BMI Select Aerospace & Defense 35/20 Capped Index seeks to measure the performance of constituents from the S&P Developed BMI that are classified in the GICS Aerospace & Defense sub-industry, while adhering to certain size and liquidity criteria. It uses a capped float-market-capitalization-weighted methodology to ensure diversification across its constituents. It is reconstituted annually in September, with a monthly weight capping.

The Aerospace & Defense (A&D) sub-industry is unique, with the defense segment often exhibiting anti-cyclical behavior alongside increases in government defense spending, independent of economic downturns.1 In contrast, the aerospace segment, especially commercial aviation, is highly cyclical, closely tied to the broader economic cycle and consumer spending on travel.2 The reliance on long-term government contracts in defense introduces a degree of revenue stability, though it also poses risks tied to changes in political landscapes and defense budgets. Additionally, the A&D sector is often synonymous with technological innovation, contributing significantly to advancements in fields such as autonomous flight systems and cybersecurity, driven by the sector’s lengthy product development cycles and substantial investments in new technologies.3 Moreover, the industry is marked by high barriers to entry due to significant capital and technological requirements, high regulatory standards and the need for advanced R&D capabilities. This results in a concentrated competitive landscape with a few major players dominating the global scene.4

The dominance of a few key players in the Aerospace & Defense sub-industry is evident in the index’s composition, where over 90% of the companies have a market capitalization in excess of USD 10 billion. Among the 56 constituents of the index, the majority are based in the U.S. (67%), followed by France (17%) and the U.K. (9%). This distribution contrasts with its benchmark index, which also has 67% of its constituents domiciled in the U.S., but with a significantly lower representation from France (3%) and the U.K. (4%). The higher concentration in France is largely due to the inclusion of major French firms like Airbus and Safran, which hold index weights of 9.4% and 6.2%, respectively. In the U.K., a significant part of the index weight comes from Europe’s largest defense contractor, BAE Systems (index weight of 4.3%), and Rolls Royce (index weight of 3.1%).5

In terms of performance, the S&P Developed BMI Select Aerospace & Defense 35/20 Capped Index has outperformed its benchmark index across most analyzed timeframes since 2012. Over the last three years, the index had an annualized return of 15.9%, compared to the benchmark’s 7.1% annualized return. Over the 10-year period, it also outperformed with a 10.1% annual return compared to the S&P Developed BMI’s 9.2%. However, it slightly underperformed the benchmark over the last 12 months, returning 14.1% versus the benchmark’s 15.5%. The index had slightly elevated levels of (annualized) risk over the 10-year period, around 20.9% compared to the benchmark’s parent’s 15.2%. Over the full back-tested period, the daily return correlation was around 79% with a constituent overlap of 1.5%.6

1https://www.forbes.com/sites/lorenthompson/2011/12/05/defense-spending-cycles-are-an-illusion/?sh=ea05402ded03

2 https://rcoeng.com/blog/2022-predictions-for-the-aerospace-manufacturing-industry

3 https://www2.deloitte.com/us/en/insights/industry/aerospace-defense/aerospace-and-defense-industry-outlook.html

4 https://sternvaluemanagement.com/resources/the-evaluation/aerospace-defense-ad-contractors

5 Constituent weights as of Jan. 31, 2024.

6 Index levels from Sept. 21, 2012, through Jan. 31, 2024.


The posts on this blog are opinions, not advice. Please read our Disclaimers.

2024 World Economic Forum: Key Themes to Watch

Contributor Image
Wanying Wu

Analyst, Sustainability & Thematic Indices

S&P Dow Jones Indices

The author would like to thank Vidushan Ragukaran and Ari Rajendra for their contributions to this blog.


The 2024 World Economic Forum (WEF) that took place at Davos-Klosters in mid-January attracted over 60 heads of state and government leaders. There was a consistent emphasis on AI and cybersecurity risk governance, a renewed focus on the energy transition for environmental concerns and a noticeable discussion around prioritizing women’s health for social advancement. Below, we highlight the key takeaways.

AI, Risks and Governance

The key theme at the WEF’s Annual Meeting was the role of artificial intelligence in driving economic and societal progress1 and a growing need to explore how AI can bring transformations to business operations and performance. Exhibit 1 shows the result of an analysis of over 19,000 individual tasks across 867 occupations.2

Additionally, AI can also potentially assist in addressing challenges in healthcare, agriculture and climate change. An example is its use in a UN initiative aiding climate-vulnerable communities in Burundi, Chad and Sudan, where AI is used to try to predict weather patterns to enable better planning for local communities.3

Featured S&P DJI Index: S&P Kensho Global Artificial Intelligence Enablers Indexseeks to track global companies that develop the technology, infrastructure and services propelling AI growth.

Other S&P DJI Indices: S&P Kensho AI Enablers Index, S&P Kensho Artificial Intelligence Enablers & Adopters Index

AI offers the potential to address worldwide challenges, but it is also necessary to establish safeguards in connection with that growth. The increased adoption of AI requires greater cybersecurity protection and the establishment of ethical governance frameworks.4

Featured S&P DJI Index: S&P Kensho Cyber Security Indexseeks to track innovative companies delivering cybersecurity solutions.

Other S&P DJI Indices: S&P Global Semiconductor Index, Dow Jones U.S. Semiconductors Index

Sustainability with a Focus on Equitable Energy Transition

The Equitable Transition Initiative created at the WEF seeks to promote an environmentally conscious transition with a focus on economic fairness.5 The initiative aims to evaluate the effects of climate mitigation measures on individuals, encouraging opportunity optimization and risk mitigation. Central topics include investing in renewables, energy efficiency and innovative storage technologies.

The energy transition was also recently discussed at COP28, emphasizing the need to accelerate the transition to clean energy to achieve the 1.5°C goal. Over 130 nations pledged to triple global renewable energy capacity to 11,000GW and double energy efficiency by 2030—a historic shift from fossil fuels.

Featured S&P DJI Index: S&P Global Clean Energy Indexseeks to track businesses in developed and emerging markets that are highly aligned towards the provision of clean energy, thus capturing the energy transition as it takes place globally.

Other S&P DJI Indices: S&P Global Clean Energy Select Index, S&P Kensho Clean Energy Index, S&P Kensho Clean Power Index, S&P Kensho Cleantech Index, S&P Global Essential Metals Producers Index

Healthcare with a Focus on Women’s Health and Digital Healthcare

Another key point mentioned at WEF is healthcare. A WEF report suggests addressing women’s health challenges could add at least USD1 trillion to the global economy by 2040, potentially resulting in a 1.7% increase in per capita GDP by improving well-being and increasing workforce participation.6 The Forum’s newly established Global Alliance for Women’s Health has support from 42 organizations, dedicated to enhancing women’s health globally, and it has secured a financial commitment.

Featured S&P DJI Index: S&P Kensho Digital Health Indexseeks to track companies specializing in remote healthcare delivery, whose services could help address the challenge in women’s health.

In conclusion, we are seeing increased recognition of AI applications and their risks, the urgency of energy transition and the opportunity in women’s health. S&P DJI offers additional indexing solutions to capture the opportunities and address upcoming challenges.


1   Pomeroy, R. and Myers, J. (2024) AI – artificial intelligence – at Davos 2024: What to know, World Economic Forum. Available at: https://www.weforum.org/agenda/2024/01/artificial-intelligence-ai-innovation-technology-davos-2024/.

2    World Economic Forum In Collaboration with Accenture (2023) Jobs of tomorrow: Large language models and jobs -weforum.org, World Economic Forum. Available at: https://www3.weforum.org/docs/WEF_Jobs_of_Tomorrow_Generative_AI_2023.pdf.

3    Masterson, V. (2024) 8 ways AI is helping tackle climate change, World Economic Forum. Available at: https://www.weforum.org/agenda/2024/01/ai-combat-climate-change/.

4   Palma, B. (2024) Ai Is Transforming Cybersecurity: How can security experts respond?, World Economic Forum. Available at: https://www.weforum.org/agenda/2024/01/arms-race-cybersecurity-ai/.

5   World Economic Forum (2024) World Economic Forum annual meeting 2024, BusinessGhana. Available at: https://www.businessghana.com/site/events/other-events/476406/World-Economic-Forum-Annual-Meeting-2024.

6   World Economic Forum (2024a) New Global Alliance for Women’s health could help boost global economy by $1 trillion annually by 2040, World Economic Forum. Available at: https://www.weforum.org/press/2024/01/wef24-new-global-alliance-for-womens-health-could-boost-global-economy-by-1-trillion-annually-by-2040/.

The posts on this blog are opinions, not advice. Please read our Disclaimers.