Get Indexology® Blog updates via email.

In This List

Magnificent Mid Caps and Sensational Small Caps

Getting to Know the S&P Developed BMI Select Aerospace & Defense 35/20 Capped Index

2024 World Economic Forum: Key Themes to Watch

S&P DJI Kensho Goes Global

S&P 500 Highs Keep Coming

Magnificent Mid Caps and Sensational Small Caps

Contributor Image
Sherifa Issifu

Senior Analyst, U.S. Equity Indices

S&P Dow Jones Indices

U.S. equities rose in 2023, with the mega-cap “Magnificent Seven” driving most of the S&P Composite 1500®’s 25% gain. While mega caps continued to outperform in January 2024, not all seven of the aforementioned group ranked highly. This has led to some market commentators looking to coin new phrases: “Sensational Six” or “Super Six” (the jury is still out on the new superhero-esque moniker, count and membership of our new set of mega caps).

Some market participants have sought to diversify their mega-cap exposure through the S&P 500® Equal Weight Index. Other smaller-size tools of diversification are the S&P MidCap 400® and the S&P SmallCap 600®, which have distinct characteristics and sector exposure from large caps.

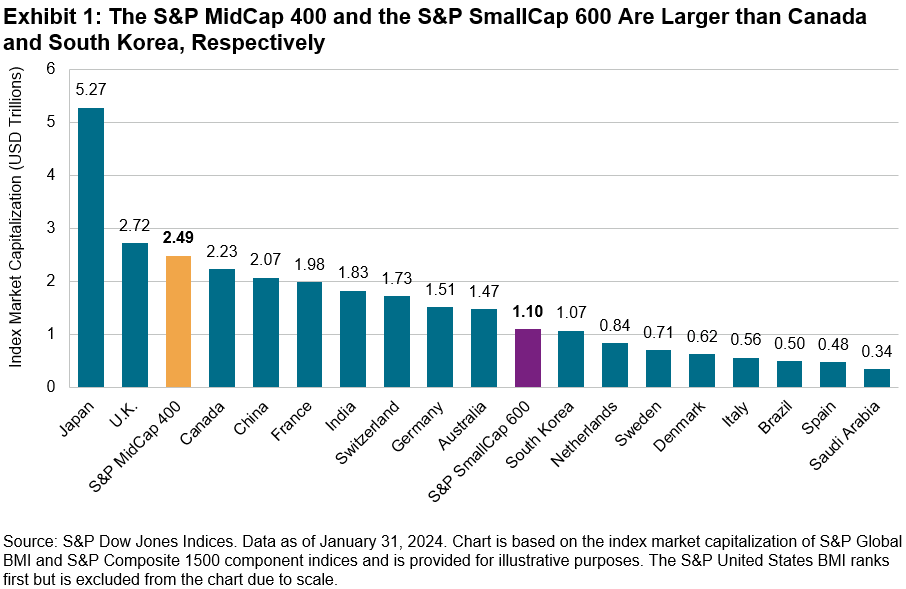
U.S. small and mid caps have benefited from the small- and mid-size equity premium historically, outperforming the S&P 500 over the long run. Historically, there has also been a cyclicality among U.S. equity size ranges. While the S&P 400® and S&P 600® are smaller than large-cap U.S. equities, when looking abroad, the U.S. mid-cap and small-cap markets are equivalent to entire countries’ entire equity markets. Exhibit 1 shows that the S&P 400 would rank as the fourth-largest country in the S&P Global BMI and the S&P 600 is larger than South Korea (all based on float-adjusted market capitalization).

Differences in sector exposure among the U.S. equity size segments have also meant that the S&P 400 and S&P 600 are more domestically focused than the S&P 500, with higher weights in Industrials, Financials, and Real Estate. This has historically meant greater sensitivity to U.S. macro indicators, such as GDP growth, than large-cap stocks.

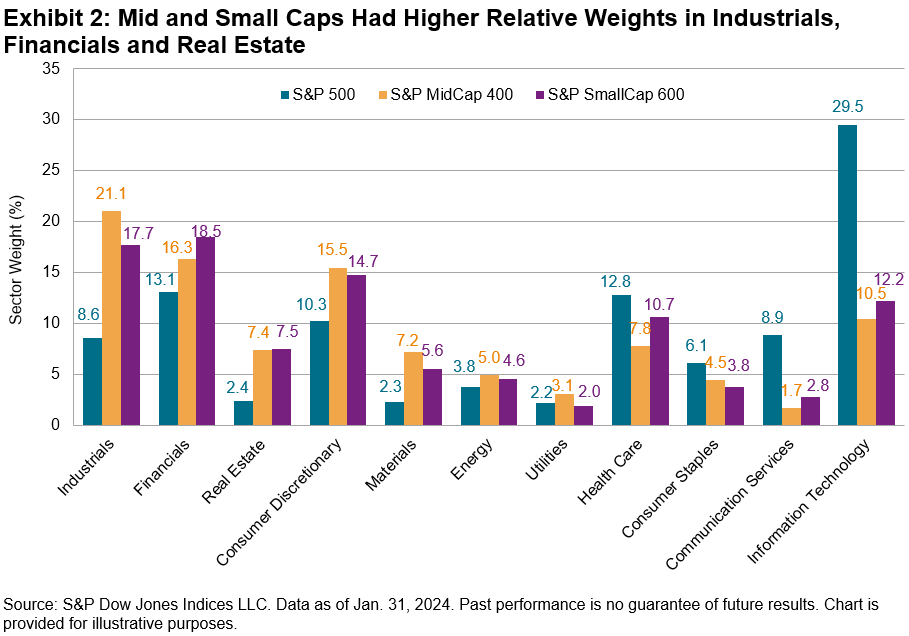
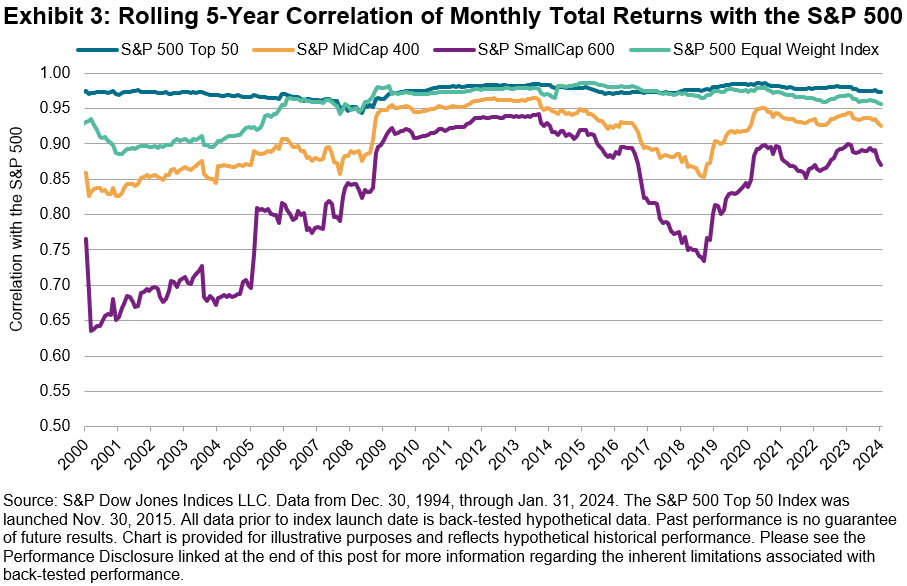
The differences in sector composition shown in Exhibit 2 in part help explain the non-perfect correlation (see Exhibit 3) between the S&P 500 and smaller-size-focused U.S. equity indices. These differences in sectors and correlation may present an interesting option to diversify with the S&P MidCap 400 and the S&P SmallCap 600, with a potential to reduce risk-adjusted return compared with the S&P 500 alone.

Interest rates may provide a tactical opportunity to diversify the large-cap S&P 500 with the S&P 500 Equal Weight Index, S&P MidCap 400 and S&P SmallCap 600, based on their different relative responses to interest rates under different regimes. Looking at monthly data since December 1994, Exhibit 4 shows that the S&P 500 rose about 66% of the time, while U.S. Treasury rates fell about 49% of the time (almost a coin flip). Current market expectations are of falling rates and a positive market environment, which happened one-third of the time. 2022’s dynamic of a falling stock market and rising rates was rare, occurring in 15% of months.

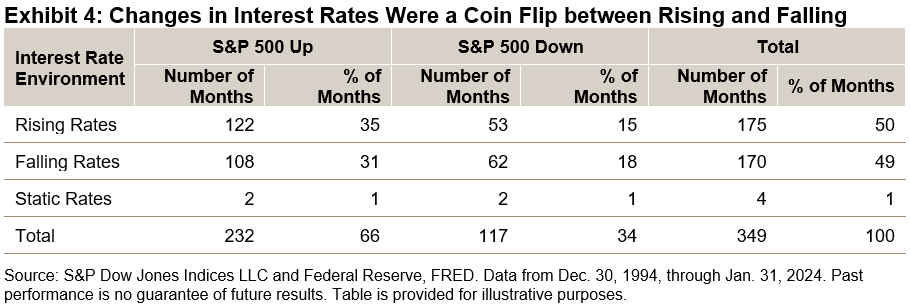
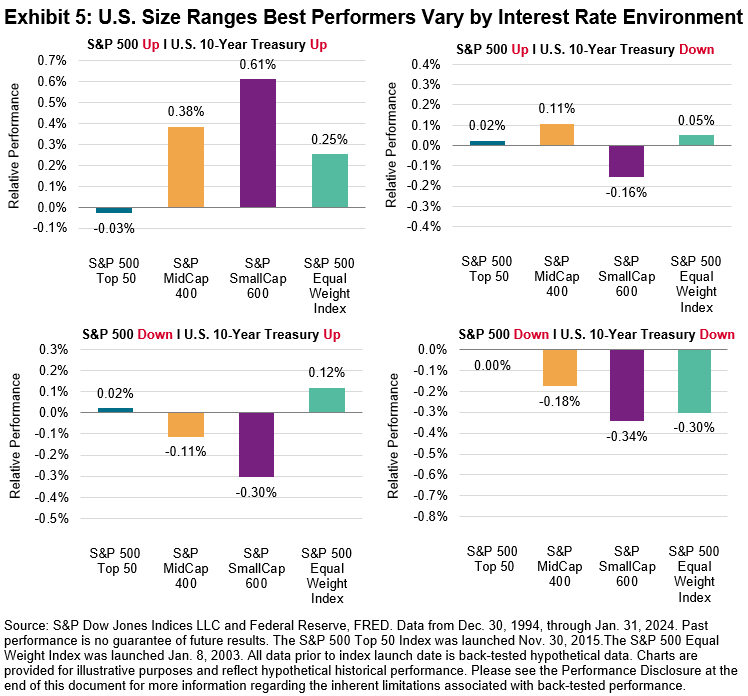
Exhibit 5 shows the historical relationships between interest rates and market regimes and the performance of various U.S. equity size ranges relative to the S&P 500. A key observation is that the direction of the stock market mattered more than the direction of interest rates in driving relative performance: the average relative performance changed by greater amounts based on market direction than on rate changes. Exhibit 5 also shows that the S&P MidCap 400, S&P SmallCap 600 and S&P 500 Equal Weight Index tended to outperform the S&P 500 in months when both the S&P 500 was up and U.S. 10-Year Treasury yields rose. The indices tended to perform in line with the S&P 500 when the large-cap U.S. equity bellwether gained and the U.S. 10-Year Treasury was down.

Of course, it is difficult to predict the direction of interest rates, the stock market, or both. But the historical performance of smaller U.S. size segments, their distinct characteristics and their sheer size mean that market participants may wish to consider the S&P 400 and S&P 600 as additional tools in their U.S. equity choices.

The posts on this blog are opinions, not advice. Please read our Disclaimers.

Getting to Know the S&P Developed BMI Select Aerospace & Defense 35/20 Capped Index

Contributor Image
Darius Nass

Associate Director, Global Equity Indices

S&P Dow Jones Indices

The S&P Developed BMI Select Aerospace & Defense 35/20 Capped Index seeks to measure the performance of constituents from the S&P Developed BMI that are classified in the GICS Aerospace & Defense sub-industry, while adhering to certain size and liquidity criteria. It uses a capped float-market-capitalization-weighted methodology to ensure diversification across its constituents. It is reconstituted annually in September, with a monthly weight capping.

The Aerospace & Defense (A&D) sub-industry is unique, with the defense segment often exhibiting anti-cyclical behavior alongside increases in government defense spending, independent of economic downturns.1 In contrast, the aerospace segment, especially commercial aviation, is highly cyclical, closely tied to the broader economic cycle and consumer spending on travel.2 The reliance on long-term government contracts in defense introduces a degree of revenue stability, though it also poses risks tied to changes in political landscapes and defense budgets. Additionally, the A&D sector is often synonymous with technological innovation, contributing significantly to advancements in fields such as autonomous flight systems and cybersecurity, driven by the sector’s lengthy product development cycles and substantial investments in new technologies.3 Moreover, the industry is marked by high barriers to entry due to significant capital and technological requirements, high regulatory standards and the need for advanced R&D capabilities. This results in a concentrated competitive landscape with a few major players dominating the global scene.4

The dominance of a few key players in the Aerospace & Defense sub-industry is evident in the index’s composition, where over 90% of the companies have a market capitalization in excess of USD 10 billion. Among the 56 constituents of the index, the majority are based in the U.S. (67%), followed by France (17%) and the U.K. (9%). This distribution contrasts with its benchmark index, which also has 67% of its constituents domiciled in the U.S., but with a significantly lower representation from France (3%) and the U.K. (4%). The higher concentration in France is largely due to the inclusion of major French firms like Airbus and Safran, which hold index weights of 9.4% and 6.2%, respectively. In the U.K., a significant part of the index weight comes from Europe’s largest defense contractor, BAE Systems (index weight of 4.3%), and Rolls Royce (index weight of 3.1%).5

In terms of performance, the S&P Developed BMI Select Aerospace & Defense 35/20 Capped Index has outperformed its benchmark index across most analyzed timeframes since 2012. Over the last three years, the index had an annualized return of 15.9%, compared to the benchmark’s 7.1% annualized return. Over the 10-year period, it also outperformed with a 10.1% annual return compared to the S&P Developed BMI’s 9.2%. However, it slightly underperformed the benchmark over the last 12 months, returning 14.1% versus the benchmark’s 15.5%. The index had slightly elevated levels of (annualized) risk over the 10-year period, around 20.9% compared to the benchmark’s parent’s 15.2%. Over the full back-tested period, the daily return correlation was around 79% with a constituent overlap of 1.5%.6

1https://www.forbes.com/sites/lorenthompson/2011/12/05/defense-spending-cycles-are-an-illusion/?sh=ea05402ded03

2 https://rcoeng.com/blog/2022-predictions-for-the-aerospace-manufacturing-industry

3 https://www2.deloitte.com/us/en/insights/industry/aerospace-defense/aerospace-and-defense-industry-outlook.html

4 https://sternvaluemanagement.com/resources/the-evaluation/aerospace-defense-ad-contractors

5 Constituent weights as of Jan. 31, 2024.

6 Index levels from Sept. 21, 2012, through Jan. 31, 2024.


The posts on this blog are opinions, not advice. Please read our Disclaimers.

2024 World Economic Forum: Key Themes to Watch

Contributor Image
Wanying Wu

Analyst, Sustainability & Thematic Indices

S&P Dow Jones Indices

The author would like to thank Vidushan Ragukaran and Ari Rajendra for their contributions to this blog.


The 2024 World Economic Forum (WEF) that took place at Davos-Klosters in mid-January attracted over 60 heads of state and government leaders. There was a consistent emphasis on AI and cybersecurity risk governance, a renewed focus on the energy transition for environmental concerns and a noticeable discussion around prioritizing women’s health for social advancement. Below, we highlight the key takeaways.

AI, Risks and Governance

The key theme at the WEF’s Annual Meeting was the role of artificial intelligence in driving economic and societal progress1 and a growing need to explore how AI can bring transformations to business operations and performance. Exhibit 1 shows the result of an analysis of over 19,000 individual tasks across 867 occupations.2

Additionally, AI can also potentially assist in addressing challenges in healthcare, agriculture and climate change. An example is its use in a UN initiative aiding climate-vulnerable communities in Burundi, Chad and Sudan, where AI is used to try to predict weather patterns to enable better planning for local communities.3

Featured S&P DJI Index: S&P Kensho Global Artificial Intelligence Enablers Indexseeks to track global companies that develop the technology, infrastructure and services propelling AI growth.

Other S&P DJI Indices: S&P Kensho AI Enablers Index, S&P Kensho Artificial Intelligence Enablers & Adopters Index

AI offers the potential to address worldwide challenges, but it is also necessary to establish safeguards in connection with that growth. The increased adoption of AI requires greater cybersecurity protection and the establishment of ethical governance frameworks.4

Featured S&P DJI Index: S&P Kensho Cyber Security Indexseeks to track innovative companies delivering cybersecurity solutions.

Other S&P DJI Indices: S&P Global Semiconductor Index, Dow Jones U.S. Semiconductors Index

Sustainability with a Focus on Equitable Energy Transition

The Equitable Transition Initiative created at the WEF seeks to promote an environmentally conscious transition with a focus on economic fairness.5 The initiative aims to evaluate the effects of climate mitigation measures on individuals, encouraging opportunity optimization and risk mitigation. Central topics include investing in renewables, energy efficiency and innovative storage technologies.

The energy transition was also recently discussed at COP28, emphasizing the need to accelerate the transition to clean energy to achieve the 1.5°C goal. Over 130 nations pledged to triple global renewable energy capacity to 11,000GW and double energy efficiency by 2030—a historic shift from fossil fuels.

Featured S&P DJI Index: S&P Global Clean Energy Indexseeks to track businesses in developed and emerging markets that are highly aligned towards the provision of clean energy, thus capturing the energy transition as it takes place globally.

Other S&P DJI Indices: S&P Global Clean Energy Select Index, S&P Kensho Clean Energy Index, S&P Kensho Clean Power Index, S&P Kensho Cleantech Index, S&P Global Essential Metals Producers Index

Healthcare with a Focus on Women’s Health and Digital Healthcare

Another key point mentioned at WEF is healthcare. A WEF report suggests addressing women’s health challenges could add at least USD1 trillion to the global economy by 2040, potentially resulting in a 1.7% increase in per capita GDP by improving well-being and increasing workforce participation.6 The Forum’s newly established Global Alliance for Women’s Health has support from 42 organizations, dedicated to enhancing women’s health globally, and it has secured a financial commitment.

Featured S&P DJI Index: S&P Kensho Digital Health Indexseeks to track companies specializing in remote healthcare delivery, whose services could help address the challenge in women’s health.

In conclusion, we are seeing increased recognition of AI applications and their risks, the urgency of energy transition and the opportunity in women’s health. S&P DJI offers additional indexing solutions to capture the opportunities and address upcoming challenges.


1   Pomeroy, R. and Myers, J. (2024) AI – artificial intelligence – at Davos 2024: What to know, World Economic Forum. Available at: https://www.weforum.org/agenda/2024/01/artificial-intelligence-ai-innovation-technology-davos-2024/.

2    World Economic Forum In Collaboration with Accenture (2023) Jobs of tomorrow: Large language models and jobs -weforum.org, World Economic Forum. Available at: https://www3.weforum.org/docs/WEF_Jobs_of_Tomorrow_Generative_AI_2023.pdf.

3    Masterson, V. (2024) 8 ways AI is helping tackle climate change, World Economic Forum. Available at: https://www.weforum.org/agenda/2024/01/ai-combat-climate-change/.

4   Palma, B. (2024) Ai Is Transforming Cybersecurity: How can security experts respond?, World Economic Forum. Available at: https://www.weforum.org/agenda/2024/01/arms-race-cybersecurity-ai/.

5   World Economic Forum (2024) World Economic Forum annual meeting 2024, BusinessGhana. Available at: https://www.businessghana.com/site/events/other-events/476406/World-Economic-Forum-Annual-Meeting-2024.

6   World Economic Forum (2024a) New Global Alliance for Women’s health could help boost global economy by $1 trillion annually by 2040, World Economic Forum. Available at: https://www.weforum.org/press/2024/01/wef24-new-global-alliance-for-womens-health-could-boost-global-economy-by-1-trillion-annually-by-2040/.

The posts on this blog are opinions, not advice. Please read our Disclaimers.

S&P DJI Kensho Goes Global

Contributor Image
Srineel Jalagani

Senior Director, Thematic Indices

S&P Dow Jones Indices

The advent of language models and generative AI has overhauled the process of generating actionable structured data from unstructured text documents and enhanced our ability to glean and categorize information from previously hard-to-access sources. As we see increasing demand for new ways to slice the market based on machine learning-based insights, S&P Dow Jones Indices (S&P DJI) is introducing S&P DJI Global Kensho Index Solutions.

What’s New?

S&P DJI Global Kensho Index Solutions use natural language processing (NLP) techniques1 and company regulatory filings in the stock selection process to construct thematic indices. Once focused on U.S indices exclusively, this newly enhanced capability makes it possible to create global thematic indices. Key features include:

  • Access to best-in-class in-house company filings database. S&P Global Market Intelligence’s database of global filings offers a competitive edge, spanning both English-source and English translations of filings from companies listed across nearly 100 exchanges.
  • Enhanced NLP models. No longer devoted to documents adhering to prescribed filing templates from the SEC, S&P DJI Global Kensho Index Solutions can now parse text documents in a wide variety of formats. Companies are not only tagged efficiently to themes, but also categorized based on their significance to these themes.

The main steps in the S&P DJI Kensho index construction process, from industry modeling to individual stock selection, remain fundamentally unchanged However, simply put, the process now incorporates a global set of annual documents, which enhances an index’s ability to track a theme across the global marketplace.

Efficiently Reflecting Themes with Long-Term Impact

Our transparent thematic indices combine advanced technology and access to exclusive datasets to track long-term, market-altering themes with precision. There are two broad challenges associated with formulating an investable index for a given long-term theme.

The first challenge is defining a theme. Take electric vehicles for example. Electric cars and trucks seem like a straightforward choice for inclusion. However, potentially including electric trains, electric ships or electric drones opens the theme up to subjective decisions on what technologies fall within the definition of electric vehicles. Therefore, defining an industry model that reflects the essence of a theme is key.

The second challenge is selecting companies that provide a product and/or a service relevant to the theme. Curating these businesses requires poring over companies’ various public documents in detail and understanding their current business focus areas, along with their plans for future growth. In the past, we primarily relied on human effort and industry experts to accomplish this. However, recent updates to the NLP toolkit have streamlined these efforts, while increasing replicability of results.

Conclusion

As interest in thematic investing grows globally, investors are looking to access a growing range of increasingly complex themes. S&P DJI Global Kensho Index Solutions allow S&P DJI to develop index methodologies and maintain indices in accordance with those methodologies to meet this rising demand. The capability combines inputs from best-in-class data sources with advanced data processing techniques to offer innovative index solutions across global markets.

1 Mayor, Tracy. “Why finance is deploying natural language processing.” MIT Sloan School of Management. Nov. 30, 2020.

The posts on this blog are opinions, not advice. Please read our Disclaimers.

S&P 500 Highs Keep Coming

Contributor Image
Hamish Preston

Head of U.S. Equities

S&P Dow Jones Indices

The S&P 500® closed at another record high today, marking the ninth all-time high closing price level so far this year. Although all-time highs are not unprecedented—2024 is the 41st year since 1957 to host a new high—a few observations stand out when looking at this year’s records.

First, January 2024 saw the end of the seventh longest gap between S&P 500 all-time highs, ever. More than two years—or 513 trading days—separated Jan. 19, 2024’s then record close and its prior record high, posted on Jan. 3, 2022. This wait ended 27 trading days earlier than the 540-trading day gap in the 1950s, and it ended significantly quicker than other waits between all-time highs dating back to the 1920s (see Exhibit 2).

January also hosted one of the longest consecutive all-time high streaks, ever. Amid investors’ positive reactions to macroeconomic data and better-than-expected corporate earnings, the S&P 500 closed at record highs for five consecutive sessions between Jan. 19, 2024, and Jan. 25, 2024. The streak ended some way short of the 11-day records (posted in the 1920s and the 1960s), yet the 5-day run ranked as the joint 29th longest streak for the index and the longest run since the benchmark rose for eight consecutive sessions around the end of October 2021.

So what might these observations mean for the S&P 500 in 2024? We will have to wait and see if the S&P 500 continues to post record highs this year: predicting the future is difficult, and the last few years have served as a reminder that there are plenty of narratives (some telegraphed in advance, some not) that can drive the market’s direction. But with the S&P 500 up around 5% YTD on a price performance basis, history offers more than a glimmer of hope for the optimists.

Between 1957 and 2023, in the 40 years when the S&P 500 posted an all-time high, the U.S. equity benchmark recorded an average of 29 all-time highs per year. The average price performance during these years (13%) was better than the average for the 20 years when no all-time highs were observed (1.8%), and in turn higher than the average performance across all years since 1957 (8.5%).

Similar results were observed when looking at the 16 years between 1957 and 2023 when all-time highs were recorded in both January and February. These years were associated with an average of 42 highs, and an average annual price gain of 15%.

The posts on this blog are opinions, not advice. Please read our Disclaimers.