Get Indexology® Blog updates via email.

In This List

2024 World Economic Forum: Key Themes to Watch

S&P DJI Kensho Goes Global

S&P 500 Highs Keep Coming

The S&P 500 ESG Index Turns 5!

Bond Beginnings and Beyond

2024 World Economic Forum: Key Themes to Watch

Contributor Image
Wanying Wu

Analyst, Sustainability & Thematic Indices

S&P Dow Jones Indices

The author would like to thank Vidushan Ragukaran and Ari Rajendra for their contributions to this blog.


The 2024 World Economic Forum (WEF) that took place at Davos-Klosters in mid-January attracted over 60 heads of state and government leaders. There was a consistent emphasis on AI and cybersecurity risk governance, a renewed focus on the energy transition for environmental concerns and a noticeable discussion around prioritizing women’s health for social advancement. Below, we highlight the key takeaways.

AI, Risks and Governance

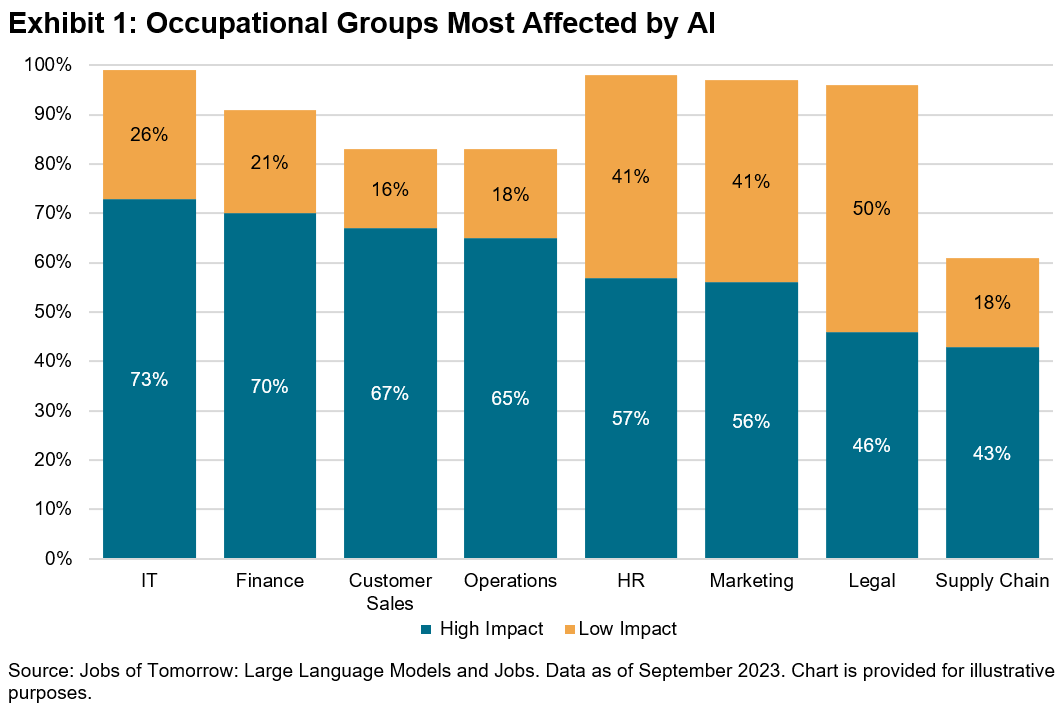
The key theme at the WEF’s Annual Meeting was the role of artificial intelligence in driving economic and societal progress1 and a growing need to explore how AI can bring transformations to business operations and performance. Exhibit 1 shows the result of an analysis of over 19,000 individual tasks across 867 occupations.2
Additionally, AI can also potentially assist in addressing challenges in healthcare, agriculture and climate change. An example is its use in a UN initiative aiding climate-vulnerable communities in Burundi, Chad and Sudan, where AI is used to try to predict weather patterns to enable better planning for local communities.3

Featured S&P DJI Index: S&P Kensho Global Artificial Intelligence Enablers Indexseeks to track global companies that develop the technology, infrastructure and services propelling AI growth.

Other S&P DJI Indices: S&P Kensho AI Enablers Index, S&P Kensho Artificial Intelligence Enablers & Adopters Index

AI offers the potential to address worldwide challenges, but it is also necessary to establish safeguards in connection with that growth. The increased adoption of AI requires greater cybersecurity protection and the establishment of ethical governance frameworks.4

Featured S&P DJI Index: S&P Kensho Cyber Security Indexseeks to track innovative companies delivering cybersecurity solutions.

Other S&P DJI Indices: S&P Global Semiconductor Index, Dow Jones U.S. Semiconductors Index

Sustainability with a Focus on Equitable Energy Transition

The Equitable Transition Initiative created at the WEF seeks to promote an environmentally conscious transition with a focus on economic fairness.5 The initiative aims to evaluate the effects of climate mitigation measures on individuals, encouraging opportunity optimization and risk mitigation. Central topics include investing in renewables, energy efficiency and innovative storage technologies.

The energy transition was also recently discussed at COP28, emphasizing the need to accelerate the transition to clean energy to achieve the 1.5°C goal. Over 130 nations pledged to triple global renewable energy capacity to 11,000GW and double energy efficiency by 2030—a historic shift from fossil fuels.

Featured S&P DJI Index: S&P Global Clean Energy Indexseeks to track businesses in developed and emerging markets that are highly aligned towards the provision of clean energy, thus capturing the energy transition as it takes place globally.

Other S&P DJI Indices: S&P Global Clean Energy Select Index, S&P Kensho Clean Energy Index, S&P Kensho Clean Power Index, S&P Kensho Cleantech Index, S&P Global Essential Metals Producers Index

Healthcare with a Focus on Women’s Health and Digital Healthcare

Another key point mentioned at WEF is healthcare. A WEF report suggests addressing women’s health challenges could add at least USD1 trillion to the global economy by 2040, potentially resulting in a 1.7% increase in per capita GDP by improving well-being and increasing workforce participation.6 The Forum’s newly established Global Alliance for Women’s Health has support from 42 organizations, dedicated to enhancing women’s health globally, and it has secured a financial commitment.

Featured S&P DJI Index: S&P Kensho Digital Health Indexseeks to track companies specializing in remote healthcare delivery, whose services could help address the challenge in women’s health.

In conclusion, we are seeing increased recognition of AI applications and their risks, the urgency of energy transition and the opportunity in women’s health. S&P DJI offers additional indexing solutions to capture the opportunities and address upcoming challenges.


1   Pomeroy, R. and Myers, J. (2024) AI – artificial intelligence – at Davos 2024: What to know, World Economic Forum. Available at: https://www.weforum.org/agenda/2024/01/artificial-intelligence-ai-innovation-technology-davos-2024/.

2    World Economic Forum In Collaboration with Accenture (2023) Jobs of tomorrow: Large language models and jobs -weforum.org, World Economic Forum. Available at: https://www3.weforum.org/docs/WEF_Jobs_of_Tomorrow_Generative_AI_2023.pdf.

3    Masterson, V. (2024) 8 ways AI is helping tackle climate change, World Economic Forum. Available at: https://www.weforum.org/agenda/2024/01/ai-combat-climate-change/.

4   Palma, B. (2024) Ai Is Transforming Cybersecurity: How can security experts respond?, World Economic Forum. Available at: https://www.weforum.org/agenda/2024/01/arms-race-cybersecurity-ai/.

5   World Economic Forum (2024) World Economic Forum annual meeting 2024, BusinessGhana. Available at: https://www.businessghana.com/site/events/other-events/476406/World-Economic-Forum-Annual-Meeting-2024.

6   World Economic Forum (2024a) New Global Alliance for Women’s health could help boost global economy by $1 trillion annually by 2040, World Economic Forum. Available at: https://www.weforum.org/press/2024/01/wef24-new-global-alliance-for-womens-health-could-boost-global-economy-by-1-trillion-annually-by-2040/.

The posts on this blog are opinions, not advice. Please read our Disclaimers.

S&P DJI Kensho Goes Global

Contributor Image
Srineel Jalagani

Senior Director, Thematic Indices

S&P Dow Jones Indices

The advent of language models and generative AI has overhauled the process of generating actionable structured data from unstructured text documents and enhanced our ability to glean and categorize information from previously hard-to-access sources. As we see increasing demand for new ways to slice the market based on machine learning-based insights, S&P Dow Jones Indices (S&P DJI) is introducing S&P DJI Global Kensho Index Solutions.

What’s New?

S&P DJI Global Kensho Index Solutions use natural language processing (NLP) techniques1 and company regulatory filings in the stock selection process to construct thematic indices. Once focused on U.S indices exclusively, this newly enhanced capability makes it possible to create global thematic indices. Key features include:

  • Access to best-in-class in-house company filings database. S&P Global Market Intelligence’s database of global filings offers a competitive edge, spanning both English-source and English translations of filings from companies listed across nearly 100 exchanges.
  • Enhanced NLP models. No longer devoted to documents adhering to prescribed filing templates from the SEC, S&P DJI Global Kensho Index Solutions can now parse text documents in a wide variety of formats. Companies are not only tagged efficiently to themes, but also categorized based on their significance to these themes.

The main steps in the S&P DJI Kensho index construction process, from industry modeling to individual stock selection, remain fundamentally unchanged However, simply put, the process now incorporates a global set of annual documents, which enhances an index’s ability to track a theme across the global marketplace.

Efficiently Reflecting Themes with Long-Term Impact

Our transparent thematic indices combine advanced technology and access to exclusive datasets to track long-term, market-altering themes with precision. There are two broad challenges associated with formulating an investable index for a given long-term theme.

The first challenge is defining a theme. Take electric vehicles for example. Electric cars and trucks seem like a straightforward choice for inclusion. However, potentially including electric trains, electric ships or electric drones opens the theme up to subjective decisions on what technologies fall within the definition of electric vehicles. Therefore, defining an industry model that reflects the essence of a theme is key.

The second challenge is selecting companies that provide a product and/or a service relevant to the theme. Curating these businesses requires poring over companies’ various public documents in detail and understanding their current business focus areas, along with their plans for future growth. In the past, we primarily relied on human effort and industry experts to accomplish this. However, recent updates to the NLP toolkit have streamlined these efforts, while increasing replicability of results.

Conclusion

As interest in thematic investing grows globally, investors are looking to access a growing range of increasingly complex themes. S&P DJI Global Kensho Index Solutions allow S&P DJI to develop index methodologies and maintain indices in accordance with those methodologies to meet this rising demand. The capability combines inputs from best-in-class data sources with advanced data processing techniques to offer innovative index solutions across global markets.

1 Mayor, Tracy. “Why finance is deploying natural language processing.” MIT Sloan School of Management. Nov. 30, 2020.

The posts on this blog are opinions, not advice. Please read our Disclaimers.

S&P 500 Highs Keep Coming

Contributor Image
Hamish Preston

Head of U.S. Equities

S&P Dow Jones Indices

The S&P 500® closed at another record high today, marking the ninth all-time high closing price level so far this year. Although all-time highs are not unprecedented—2024 is the 41st year since 1957 to host a new high—a few observations stand out when looking at this year’s records.

First, January 2024 saw the end of the seventh longest gap between S&P 500 all-time highs, ever. More than two years—or 513 trading days—separated Jan. 19, 2024’s then record close and its prior record high, posted on Jan. 3, 2022. This wait ended 27 trading days earlier than the 540-trading day gap in the 1950s, and it ended significantly quicker than other waits between all-time highs dating back to the 1920s (see Exhibit 2).

January also hosted one of the longest consecutive all-time high streaks, ever. Amid investors’ positive reactions to macroeconomic data and better-than-expected corporate earnings, the S&P 500 closed at record highs for five consecutive sessions between Jan. 19, 2024, and Jan. 25, 2024. The streak ended some way short of the 11-day records (posted in the 1920s and the 1960s), yet the 5-day run ranked as the joint 29th longest streak for the index and the longest run since the benchmark rose for eight consecutive sessions around the end of October 2021.

So what might these observations mean for the S&P 500 in 2024? We will have to wait and see if the S&P 500 continues to post record highs this year: predicting the future is difficult, and the last few years have served as a reminder that there are plenty of narratives (some telegraphed in advance, some not) that can drive the market’s direction. But with the S&P 500 up around 5% YTD on a price performance basis, history offers more than a glimmer of hope for the optimists.

Between 1957 and 2023, in the 40 years when the S&P 500 posted an all-time high, the U.S. equity benchmark recorded an average of 29 all-time highs per year. The average price performance during these years (13%) was better than the average for the 20 years when no all-time highs were observed (1.8%), and in turn higher than the average performance across all years since 1957 (8.5%).

Similar results were observed when looking at the 16 years between 1957 and 2023 when all-time highs were recorded in both January and February. These years were associated with an average of 42 highs, and an average annual price gain of 15%.

The posts on this blog are opinions, not advice. Please read our Disclaimers.

The S&P 500 ESG Index Turns 5!

Contributor Image
Margaret Dorn

Senior Director, Head of ESG Indices, North America

S&P Dow Jones Indices

The S&P 500® ESG Index celebrated its fifth birthday on Jan. 28, 2024. Over the past five years, the index has become an important piece of the sustainable indexing puzzle for investors looking to leverage the strength of the S&P 500 while incorporating meaningful and measurable sustainability-focused enhancements.

Traditionally, five-year celebrations are marked by gifting something made from wood. As a symbol, wood represents strength, stability and the ability to withstand challenges. It embodies the vitality needed to overcome obstacles and adapt to changing circumstances. In many ways, this is appropriate symbolism for an index that has been designed to help investors address the challenges and changing circumstances in an evolving world.

Let’s celebrate this milestone with a quick look back at the past five years of the S&P 500 ESG Index.

From the Beginning

The launch of the S&P 500 ESG Index on Jan. 28, 2019, signaled an evolution in sustainable investing. The index filled an important gap for investors seeking to incorporate ESG values while maintaining similar overall characteristics to the widely known and utilized S&P 500 (see Exhibit 1).

Evolving Sustainability Landscape

Adapting to the ever-changing landscape of sustainable indexing has been essential over the lifespan of the S&P 500 ESG Index. Several refinements have been made to the index methodology to reflect the evolving sentiments of a sustainability-minded investor. These views have been voiced in the results of several market consultations that led to a revised and expanded list of exclusions based on a company’s involvement in certain business activities (see Exhibit 2). The consultations also addressed several other relevant updates, including more frequent eligibility checks for business involvement activities3 and UNGC exclusions.4 Most recently, S&P Dow Jones Indices consulted the market on two key sustainability enhancements, which resulted in the change from the Sustainalytics Product Involvement to the S&P Global Business Involvement Screens and the change from the S&P DJI ESG Scores to the S&P Global ESG Scores.5

With these enhancements, the S&P 500 ESG Index has retained its main objective, which is to maintain similar overall industry group weights to the S&P 500, while enhancing the overall sustainability profile of the index with an average ESG Score improvement of 7.65% over its five-year lifespan.7

Five-Year Performance

As seen in Exhibit 3, the S&P 500 ESG Index has outperformed the S&P 500 not only over its five years of live history, but over the shorter-term one-year and three-year periods as well. One might assume that this outperformance has come at the expense of an increased risk profile for the index, but as we can see in Exhibit 4 that is not the case. The risk/performance profile of the S&P 500 ESG index was significantly better than the S&P 500 over both the three- and five-year timeframes.

Performance Perspective

One of the main criticisms around sustainability investment strategies is that the over (or under) performance is simply a result of over (or under) weights to particular sectors. In Exhibit 5, it is clear that it is not true for the S&P 500 ESG Index, which has maintained similar sector exposure to the S&P 500 since its launch. This is further evidenced by examining the performance attribution of the S&P 500 ESG Index. Exhibit 6 highlights that the excess returns have been primarily driven by stock selection rather than differences in sector exposure. This is by design, as the methodology lends itself to a broadly sector-neutral outcome. Thus, the outperformance was not all necessarily due to significant overexposure to Information Technology and underexposure to Energy, as some might assume.

Conclusion

The five years of live history for the S&P 500 ESG Index is indeed something to celebrate, and we look forward to watching our sustainable indexing star continue to shine.

1 Illustration reflects the current use of the S&P DJI ESG Scores in the index methodology. On Jan. 23, 2024, S&P Dow Jones Indices announced the results of a consultation which disclosed the transitioning of the S&P DJI ESG Scores to the S&P Global ESG Scores. The changes will be implemented as of the market open on May 1, 2024. For more information on the S&P Global ESG Scores, please refer to the S&P Global ESG Scores Methodology.

2 In cases where risks are presented, S&P Global releases a Media and Stakeholder Analysis (MSA) which includes a range of issues such as economic crime and corruption, fraud, illegal commercial practices, human rights issues, labor disputes, workplace safety, catastrophic accidents and environmental disasters. The Index Committee reviews constituents flagged by S&P Global’s MSA to evaluate the potential impact of controversial company activities on the composition of the indices. If the Index Committee decides to remove a company, that company is ineligible for re-entry for at least one full calendar year, beginning with the subsequent rebalancing.

3 Index constituents are reviewed on a quarterly basis for ongoing eligibility under the Business Activities exclusion criteria. Companies determined to be ineligible are removed from the index, effective after the close of the last business day of July, October and January. The reference date for this review is the last business day of the previous month. No constituent will be added to the index as a result of any deletion that may take place. Changes to Sustainalytics coverage are not considered as part of this review.

4 As a result of market consultation that was finalized Jan. 23, 2024, S&P DJI is revising the Quarterly Eligibility Review process in relevant indices, so UNGC eligibility is always reviewed in March, June, September and December, in line with the schedule of the Global Standards Screening dataset. This will ensure a timely removal of those companies classified as Non-Compliant with UNGC eligibility requirements regardless of the rebalancing schedule of the specific index. For more information on the results of this consultation, please visit UNGC Quarterly Eligibility Review Methodology Updates

5 Both enhancements will be implemented to align with the annual rebalance of the S&P 500 ESG index which is effective after the close of the last business day of April. For more information, please reference Transitioning S&P Sustainability Indices to S&P Global ESG Scores and Business Involvement Screens (spglobal.com)

6 For more information on the market consultations that resulted in these changes, please visit Historical Announcements – Client Resource Center | S&P Dow Jones Indices (spglobal.com)

7 The index has achieved an average S&P DJI ESG Score improvement of 7.65% (at the index level) from Jan. 27, 2020-Jan. 29, 2024, representing an average of 21.47% of the overall ESG improvement potential, given the sustainability characteristics of the starting universe.


The posts on this blog are opinions, not advice. Please read our Disclaimers.

Bond Beginnings and Beyond

Contributor Image
Anu Ganti

U.S. Head of Index Investment Strategy

S&P Dow Jones Indices

American political consultant James Carville once commented that he’d like to be resurrected as the bond market because, “you can intimidate everyone.”  As of July 2023, the global bond market comprises about USD 135 trillion of securities, of which rated corporate debt represents USD 23 trillion.1 U.S. corporate debt makes up roughly half of the global total, and as Exhibit 1 illustrates, the 1980s were a turning point in the U.S., as companies increasingly switched away from seeking bank loans for financing needs and toward leveraging the growing debt capital markets.

The composition of bond holders has also evolved. Most evidently, direct retail ownership of corporates and U.S. Treasuries has near halved, from 20% of outstanding issuance in 2010 to 11% as of Q2 2023. Meanwhile, assets in U.S. bond mutual funds have almost doubled. This has been part of a broader trend of “professionalization” or disintermediation, which saw households gravitate away from direct security ownership and toward mutual funds during the bull market of the 1990s.

In contrast to the equity markets, where index-based funds have come to represent almost half of invested capital, about three-quarters of bond fund assets were still actively managed at year-end 2023, as we observe in Exhibit 3. This is partly because fixed income index funds have a shorter history than their equity cousins: a bond index fund didn’t exist until 1986, and the first bond ETF wasn’t launched until 2002—both lagging their equity equivalents by a decade or so.

However, passive investing in the bond markets could catch up. Just as in equities, it appears difficult for active managers to outperform over the long term. Meanwhile, since 2010, the proportion of global mutual fund and ETF assets that are passively managed has in fact grown faster in bonds than in equities.

If the transformative trajectory of passive investing in equity markets is any guide for fixed income, the stage may now be set for a remarkable future for passive fixed income management. To assess whether (and why) bond markets might continue to catch up, we invite you to dive into our in-depth analysis here.

1 Refers to the amount of global and U.S. corporate debt rated by S&P Global Ratings as of July 2023. For more information, please see Limbach, Sarah, Gunter, Evan M., and Singh, Vaishali, “Credit Trends: Global State of Play: Debt Growth Diverging By Credit Quality,” Sept. 6, 2023.

The posts on this blog are opinions, not advice. Please read our Disclaimers.