Get Indexology® Blog updates via email.

In This List

How to Bring Paris Agreement Goals to Fixed Income Indices

The U.S. Dollar's Outperformance Makes Its Impact on Indices, Too

Value’s Resurgence in the S&P/ASX 200

Tracking Trends with Indices

Equity Woes Continue

How to Bring Paris Agreement Goals to Fixed Income Indices

Contributor Image
Smadar Shulman

Managing Director, Head of Fixed Income Core and ESG Indices

S&P Dow Jones Indices

This blog was co-authored by Smadar Shulman and Paulina Lichwa-Garcia.

As the transition to net zero is becoming a critical consideration in portfolio management, the popularity of indices that incorporate the EU’s minimum standards for Climate Transition Benchmarks (CTBs) and Paris-aligned Benchmarks (PABs) has been gathering pace. Such benchmarks aim to select securities that are collectively compatible with a lower carbon economy.

What Are EU PABs and CTBs?

The EU has defined a regulatory framework with minimum standards for benchmarks labeled PAB and CTB1 in line with the goals of the Paris Agreement and net zero by 2050. These are similar in their year-on-year decarbonization trajectories but differ in the greenhouse gas (GHG) emissions reductions and business activity exclusions. Exhibit 1 illustrates their similarities and differences.
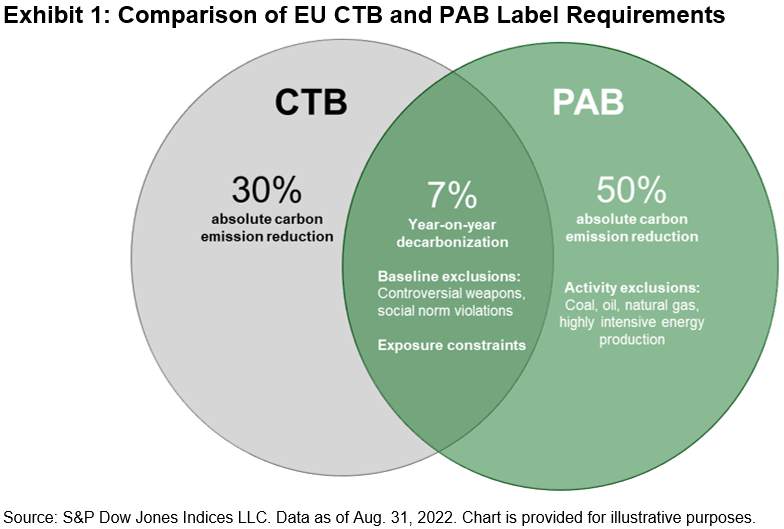
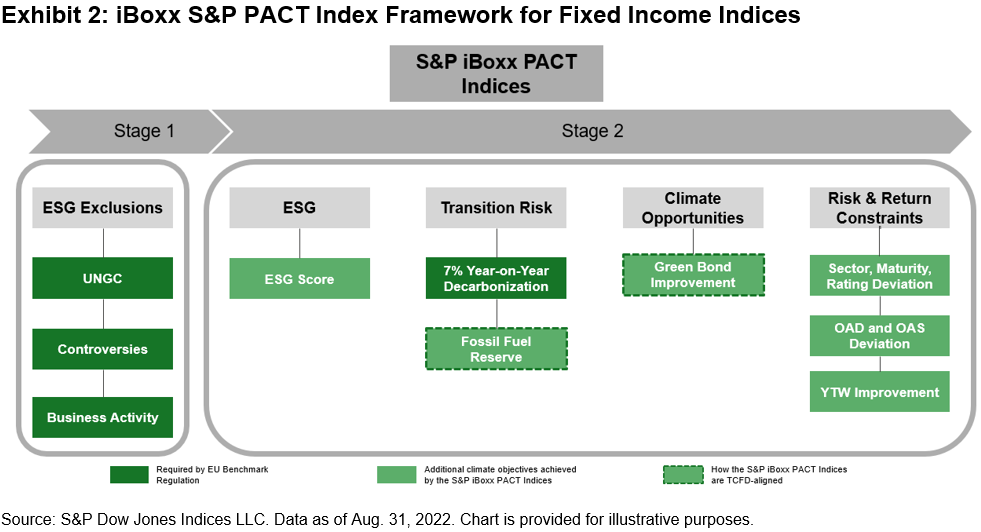
Application of the S&P PACT to Fixed Income indices

While the blueprint regulation provides minimum standards, there are additional elements relevant for fixed income investors to consider. This includes methodology design, application to a fixed income universe and further consideration of climate-related risk factors.

The recently launched iBoxx EUR Corporates Net Zero 2050 Paris-Aligned ESG expands the suite of S&P PACT Indices (S&P Paris-Aligned & Climate Transition Indices) into fixed income. The index is based on the broad iBoxx € Corporates, covering investment grade euro-denominated corporate bonds, and takes into consideration not only the EU minimum standards for PABs, but also other factors such as transition risk, climate opportunities, ESG score overlay and fixed income risk and return profiling constraints.

The iBoxx EUR Corporates Net Zero 2050 Paris-Aligned ESG offers a differentiated solution for fixed income investors seeking a bond benchmark that incorporates the goals of the Paris Agreement that:

  • Aims to meet or exceed the EU’s minimum standards for PABs;
  • Leverages multiple ESG data sources, utilizing screening and optimization to determine climate index constituents and weights;
  • Incorporates factors that seek to manage transition risk and climate change opportunities, in alignment with the recommendations of the Financial Stability Board’s Task Force on Climate-related Financial Disclosures (TCFD);
  • Offers a broad exposure while aiming to efficiently track the underlying index (iBoxx € Corporates) and minimize turnover; and
  • Improves the ESG score against the underlying universe.

In addition to the required decarbonization trajectory (using Scopes 1, 2 and 3 GHG emissions data) and a minimum set of exclusions, the index also excludes companies involved in fossil fuel operations and power generation. Furthermore, the index seeks to reduce companies’ fossil fuel reserves emissions exposure versus the underlying index, which is considered a more forward-looking measure than historical GHG emissions. Both transition risks are based on S&P Global Trucost ESG and climate data. The ESG overlay exceeds the EU’s minimum standards by aiming for ESG score2 improvement against its underlying index universe.

Going beyond the EU’s minimum standards, the index also aims to track the underlying index efficiently by design, minimizing turnover and including fixed income constraints (e.g., on yield, duration, maturity and rating).

In terms of climate opportunities, the index apportions a higher weight to green bonds,3 reflecting the opportunity embedded in such issuance.

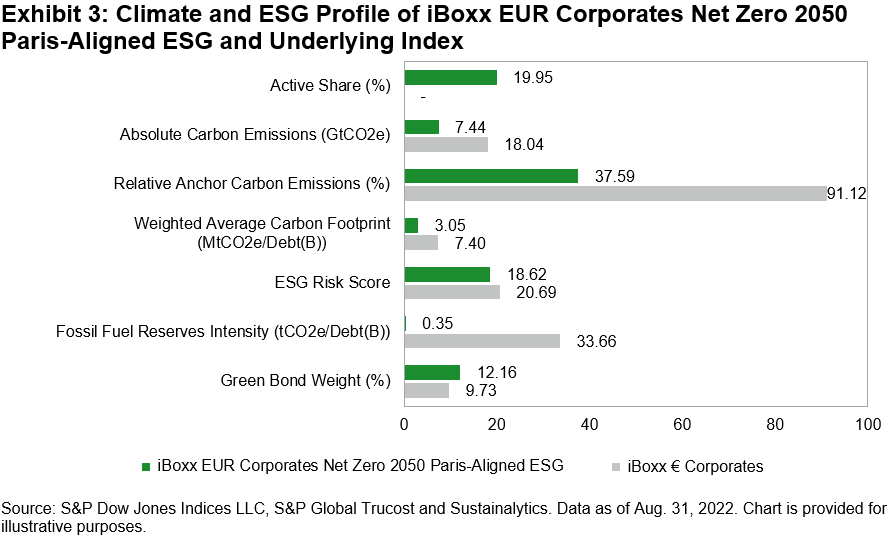
Index Profile: iBoxx EUR Corporates Net Zero 2050 Paris-Aligned ESG

Comparing the iBoxx EUR Corporates Net Zero 2050 Paris-Aligned ESG with its underlying index, Exhibit 3 illustrates the sustainability-related improvements.

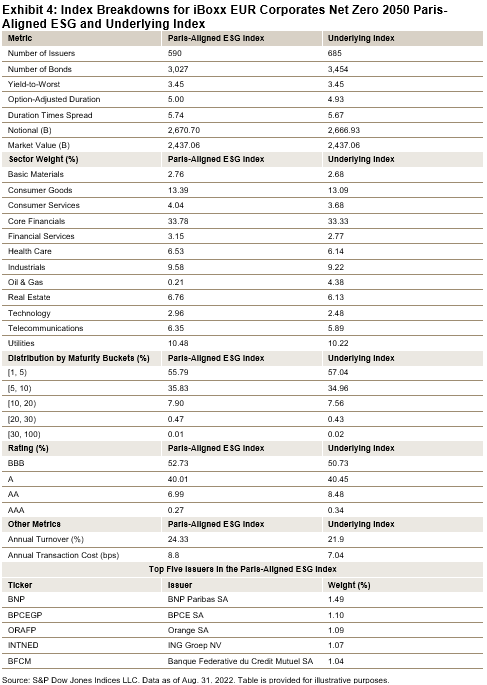
Going deeper, Exhibit 4 shows a comparison of key metrics and breakdowns by sector, maturity and rating.

Conclusion

At the core, the iBoxx EUR Corporates Net Zero 2050 Paris-Aligned ESG has a simple goal of providing an indexing solution for products seeking to divert capital into investments aligned with the net zero 2050 pathway. But as a solution to a complex problem, it incorporates multi-layer considerations in a rules-based way. The iBoxx EUR Corporates Net Zero 2050 Paris-Aligned ESG seeks to achieve and exceed the EU’s minimum standards while also building in considerations for ESG, climate risk-related factors and fixed income-related risk/return profiling while closely tracking the underlying benchmark.

1 Regulation (EU) 2019/2089 of the European Parliament and of the Council of 27 November 2019 amending Regulation (EU) 2016/1011 as regards EU Climate Transition Benchmarks. EU Paris-aligned Benchmarks and sustainability-related disclosures for benchmarks. https://eur-lex.europa.eu/legal-content/EN/TXT/PDF/?uri=CELEX:32019R2089&from=EN

2 ESG score is sourced from Sustainalytics research.

3 These are broadly based on the International Capital Market Association’s (ICMA) voluntary Green Bond Principles, which require a Use of Proceeds (UoP) commitment for green projects: https://www.icmagroup.org/sustainable-finance/the-principles-guidelines-and-handbooks/green-bond-principles-gbp/


The posts on this blog are opinions, not advice. Please read our Disclaimers.

The U.S. Dollar's Outperformance Makes Its Impact on Indices, Too

Contributor Image
John Welling

Senior Director, Head of Global Equity Indices

S&P Dow Jones Indices

U.S. dollar strength has led to parity in EUR-USD exchange rates in recent days, with the value of the euro equaling 99 U.S. pennies at its low. While 114 U.S. pennies were still required to equal the British pound sterling, “cable”—the GBP-USD rate—has reached its lowest since 1985.

In Asia, the Japanese yen has suffered the most YTD of any developed market currencies versus the U.S. dollar. Meanwhile, the Chinese yuan has surpassed 7 to the U.S. dollar, while the Brazilian real gained in contrast.

Year-to-date, the Dow Jones FXCM Dollar Index, which measures the U.S. dollar versus the most liquid currencies, was up 9.03%, capturing the general trend in U.S. dollar strength.

For U.S. investors holding equities from these markets, this means returns of these holdings have decreased when translated back into a stronger U.S. dollar, compounding the weak underlying market performance. To estimate the impact of this broad currency weakness versus the U.S. dollar, Exhibit 2 shows country index returns in both U.S. dollar and the local currency (LCL).

In aggregate, developed market indices have been most affected, with the performance relative to the local currency return decreasing by more than 11% YTD. Meanwhile, currency losses were more mitigated across emerging markets, in part due to the offsetting gains in the Brazilian real.


Exchange rate moves can have a meaningful impact on international equity performance. While recent global market performance has been weak, U.S. investors have been doubly affected by currency underperformance versus the U.S. dollar. If the current trend reverses, a weakening U.S. dollar would become additive to international equity returns for these investors.


The posts on this blog are opinions, not advice. Please read our Disclaimers.

Value’s Resurgence in the S&P/ASX 200

Contributor Image
Sean Freer

Director, Global Equity Indices

S&P Dow Jones Indices

Those who implement style investing will have noticed a recent reversal of fortunes for the value approach following a long spell of underperformance. Since the inception of the S&P/ASX 200 Growth and S&P/ASX 200 Value in 2017, the back-tested approach has seen growth top value in 12 out of the past 17 calendar years.

However, with growth peaking in Australia and broadly across developed markets in 2020 (2021 in the U.S.), the rotation toward value is well underway. The digital innovation-led market with a prolonged period of loose monetary policy has given way to high inflation—now reaching multiple decade highs and tightening monetary policies by central banks. In this environment, future company earnings are discounted more heavily, and they are exposed to higher capital and other input costs, which hinders growth.

Value outperformed growth in 2021 across the board in developed markets. In Australia, value trumped growth by more than 7% and has accelerated its resurgence in 2022, outperforming growth by over 10% YTD and by more than 20% cumulatively over the past two years (as of Aug. 31, 2022).

Over the one-year period as of Aug. 31, 2022, value exhibited resilience in a falling market, with the S&P/ASX 200 Growth (-9.19%) and the broad market S&P/ASX 200 (-3.43%) declining, while the S&P/ASX 200 Value gained 2.64%. An outperformance spread of nearly 12%.

The S&P/ASX 200 Growth and S&P/ASX 200 Value consist of companies with pure growth and value characteristics, respectively, as well as companies within the broader S&P/ASX 200 categorized as “blend.” This style bias results in two distinctive indices from companies within the S&P/ASX 200. Exhibit 4 highlights the difference in sector weights between the value and growth approaches.1

In the current market environment, we can see significant dispersion of returns among sectors, with the one-year difference as of Aug. 31, 2022, between the highest-performing sector (Energy 53.00%) versus the worst-performing sector (Information Technology -34.75%) at 87.75%. This spread is among the highest exhibited over one-year periods going back 10 years. The past 12 months have seen the outperformance of Energy over Materials, Consumer Staples over Consumer Discretionary and Financials over Health Care, and it has resulted in considerable relative gains for the value approach over the broad market.

As expected, the correlation between the growth and value investment styles has significantly lowered compared with longer-term averages. This also rings true in global markets, with value and growth indices in the U.S., Europe and Japan displaying similar dynamics over recent months—a value-led comeback, higher sector dispersion and lower correlation following a long period of growth outperformance.

Australian investors haven’t historically been as style aware with their domestic equity exposure compared to those in the U.S. and other developed markets. Given such distinctive performance characteristics, the S&P/ASX 200 Growth and S&P/ASX 200 Value offer a unique lens through which to evaluate market dynamics compared to the broad market S&P/ASX 200.

1 Please refer to the methodology document for S&P/ASX Indices for more information: https://www.spglobal.com/spdji/en/documents/methodologies/methodology-sp-asx-200-style.pdf.


The posts on this blog are opinions, not advice. Please read our Disclaimers.

Tracking Trends with Indices

How can indices help investors understand what’s driving market trends amid inflation, rising rates, and volatility? S&P DJI’s Anu Ganti and Hamish Preston take a closer look at key trends and  what they could mean for active management and asset allocation moving forward.

The posts on this blog are opinions, not advice. Please read our Disclaimers.

Equity Woes Continue

Contributor Image
Fei Mei Chan

Former Director, Core Product Management

S&P Dow Jones Indices

Canadian equities continued their decline, losing another 8.76% (through September 15, 2022) since the last rebalance of the S&P/TSX Low Volatility Index on June 17.  Characteristically for a falling market, Low Volatility outperformed (by 13 basis points), declining 8.63%.

As it had done in June, volatility again increased for every sector of the S&P/TSX Composite Index. Energy, Health Care and Technology were among sectors with the biggest hike in volatility.

Despite this, the latest rebalance for the S&P/TSX Composite Low Volatility Index (effective at the close of trading on Sep. 16, 2022) either maintained or added to positions in these sectors. The index screens for the lowest volatility at the stock level, so these results suggest that there are pockets of relative stability even within higher-volatility sectors.

Financials, Real Estate and Utilities continue to be the most overweighted sectors in the Low Volatility index.

The posts on this blog are opinions, not advice. Please read our Disclaimers.