
What does the S&P 500 ESG Index ecosystem look like today and how is that benefiting market participants? S&P DJI’s Hamish Preston and DWS’ David Stack explore key takeaways from the first five years of the S&P 500 ESG Index.
The posts on this blog are opinions, not advice. Please read our Disclaimers.
Tracking the Sustainable Core: 5 Years of S&P 500 ESG
S&P World Index: A Global Benchmark for Comprehensive Coverage
Exploring the Characteristics of the Dow Jones U.S. Select Dividend Index
Identifying Economic Moats Using a Quantitative Lens: The S&P 500 Economic Moat Index
New Bitcoin Indices Doing “Yard Work” in the Spring
Tracking the Sustainable Core: 5 Years of S&P 500 ESG
- Categories Sustainability
- Tags ESG, Hamish Preston, indexing, S&P 500, S&P 500 ESG Index, sustainability
S&P World Index: A Global Benchmark for Comprehensive Coverage
Introducing a benchmark that digs deeper into developed markets, with data that extends over several economic cycles. Discover how the S&P World Index sets the standard for developed market indices.
The posts on this blog are opinions, not advice. Please read our Disclaimers.Exploring the Characteristics of the Dow Jones U.S. Select Dividend Index

Indices that not only track the broad equities market, but also offer the potential for enhanced dividends may appeal to those searching for income within the equity asset class. In this blog, we investigate what the Dow Jones U.S. Select Dividend Index has historically brought to the table, including high dividend income, superior risk-adjusted performance over the long term, strong defensive characteristics in the face of market downturns and its current low valuation metrics versus the benchmark.
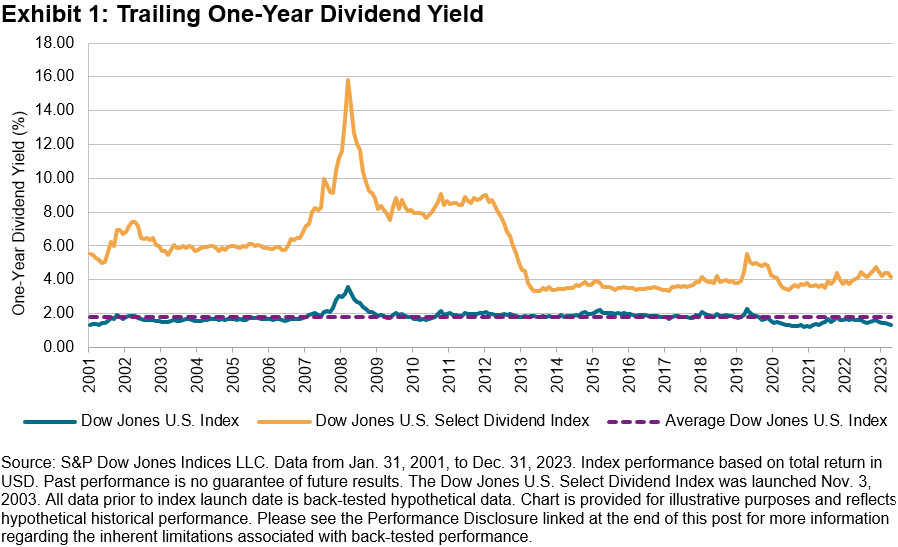
For some market participants, the potential for income generation drives a long-term strategic decision; others may have a more tactical view. Historically, in a lower interest rate environment, tactical investors have turned to high dividend yield-focused indices in search of the benefits associated with income-generating assets. The Dow Jones U.S. Select Dividend Index, which celebrated its 20th anniversary in November last year, is one such index, with a yield that has been significantly higher than the benchmark since 2001 (currently 4.16% versus 1.32%, as of March 28, 2024). Its yield was also high versus other dividend-focused indices in the market, with a yield premium of 30%.1 During periods of elevated interest rates, fixed income strategies may have had more appeal; however, in the event that interest rates start to fall consistently, equity income products may come into sharper focus.
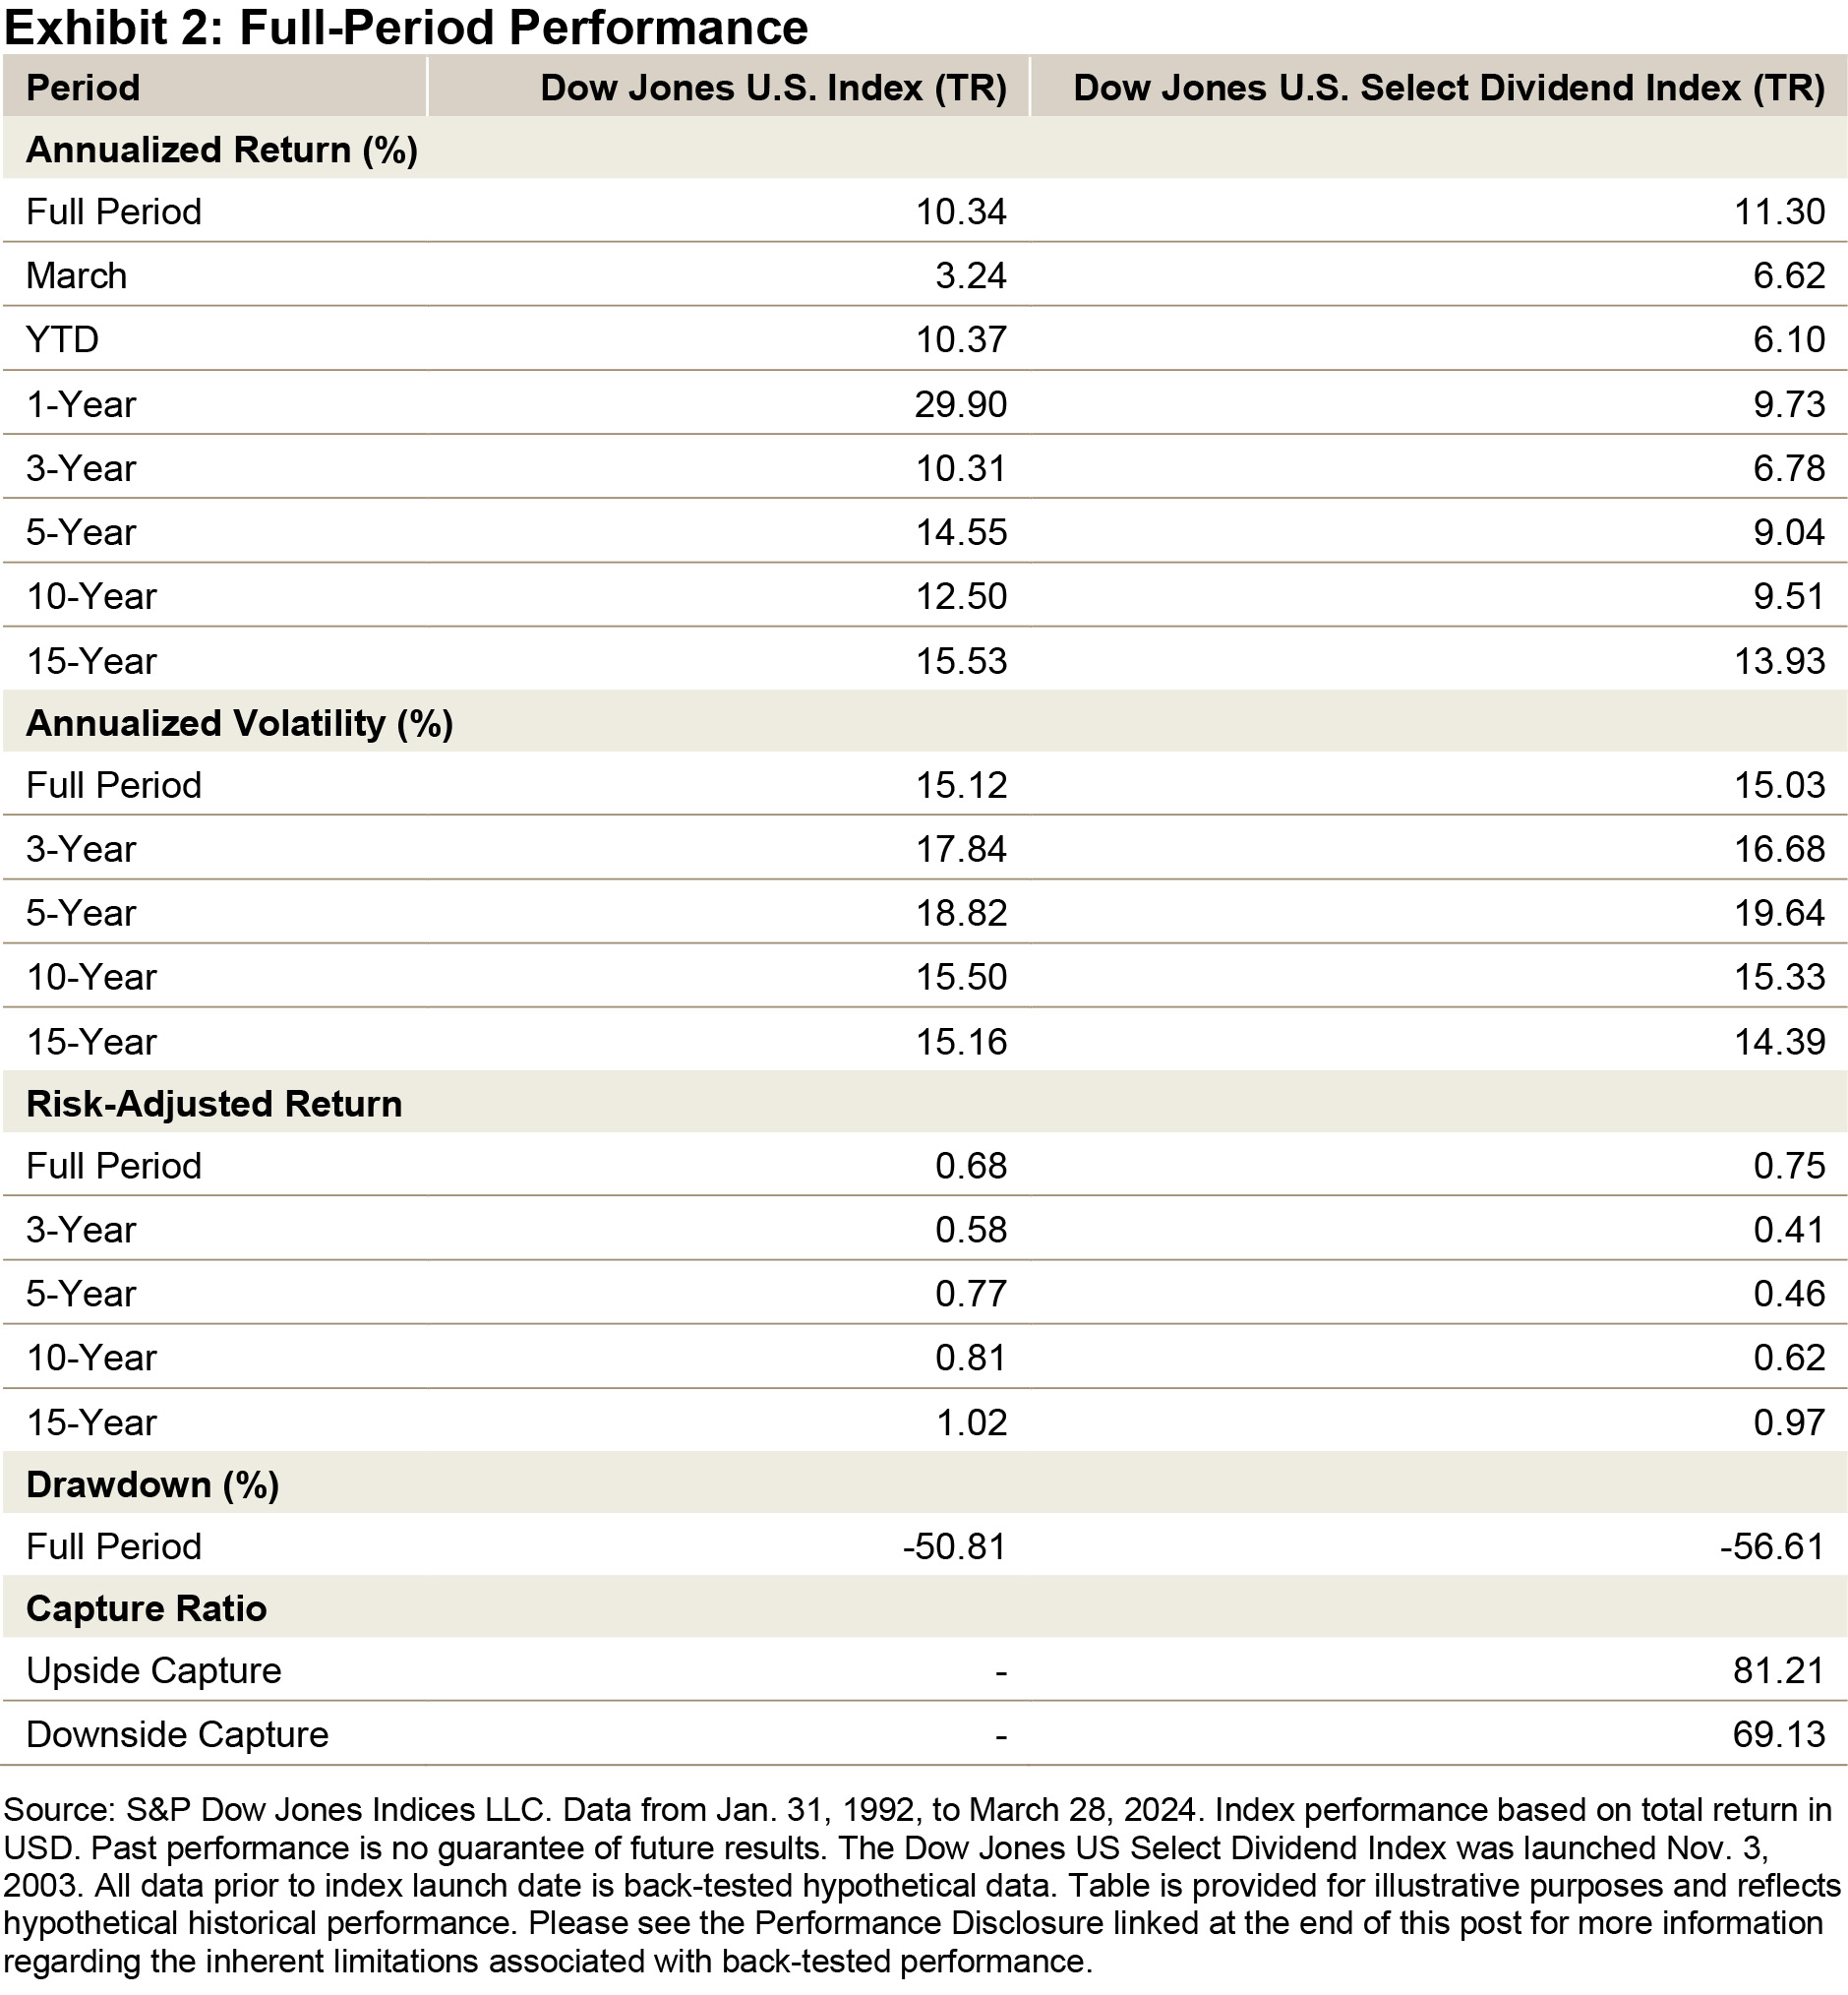
The Dow Jones U.S. Select Dividend Index has outperformed the benchmark over the long term on an absolute and risk-adjusted basis.
Exhibit 2 shows the long-term performance of the Dow Jones U.S. Select Dividend Index versus the benchmark. Performance has been robust over the full period in both absolute and risk-adjusted terms. In recent years, when the Magnificent 7 (those S&P 500® mega-cap companies that have been performing strongly in recent periods: Meta Platforms, Amazon, Apple, Netflix, Alphabet, Microsoft and Nvidia) have been so dominant in driving U.S. returns, the Dow Jones U.S. Select Dividend Index has underperformed due to under-representation in the Information Technology sector and especially in these companies.
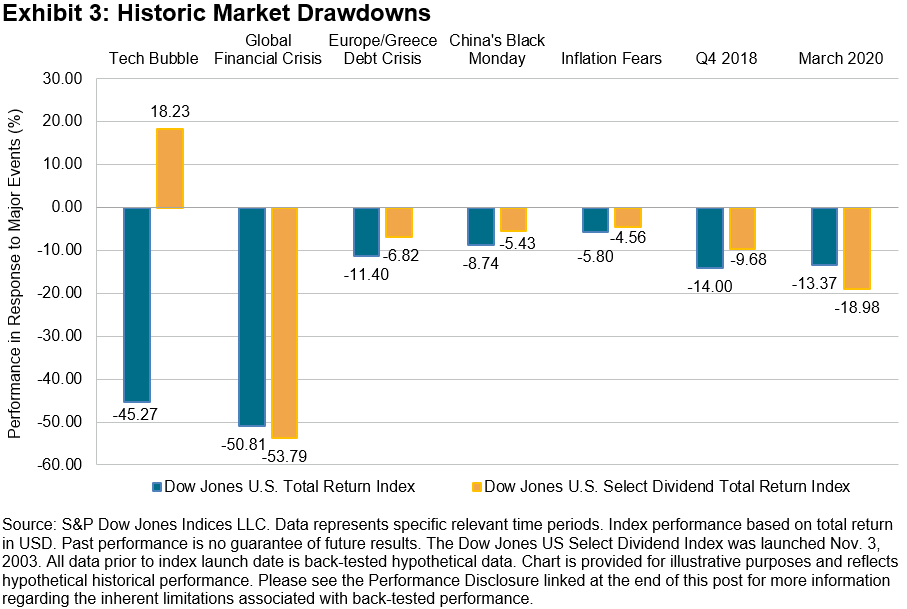
The Dow Jones U.S. Select Dividend Index outperformed the benchmark during most major market events (except during the height of the Global Financial Crisis and COVID-19 sell-off), demonstrating its defensive characteristics.
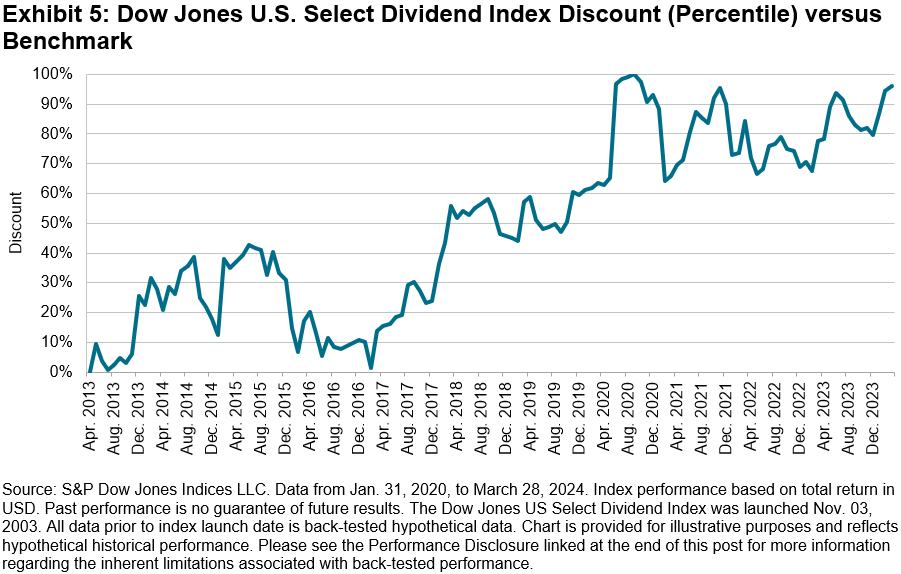
The Dow Jones U.S. Select Dividend Index is trading at a significant discount to the benchmark; -33% on a price-to-earnings basis and -58% for the price-to-book and price-to-sales ratios, as of March 28, 2024.
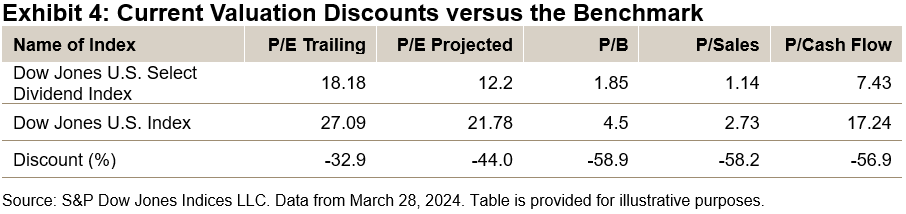
The Dow Jones U.S. Select Dividend Index is currently highly discounted to the benchmark, trading at a 94th percentile reduction; i.e., versus the benchmark on a composite basis (a simple average of the price-to-book, price-to-earnings and price-to-sales ratio), the discount has only been greater 6% of the time occurring between June and October of 2020. Discounts have been at an elevated level (above 50%) since 2020. However, over the long term (since 2013), the valuation was not always so compelling.
Investors searching for income and equity participation could look to high yield dividend indices to inform strategies geared toward meeting their objectives, especially in markets where interest rates may be falling. Currently, the Dow Jones U.S. Select Dividend Index offers a large yield premium to its benchmark and to other U.S. dividend indices, as well as a significant valuation discount to the benchmark.
1 3.30% is the average dividend yield of Morningstar data reflecting global categories of US equity large cap value, US equity large cap blend, US equity mid cap, US equity small cap and US equity large cap growth.
The posts on this blog are opinions, not advice. Please read our Disclaimers.Identifying Economic Moats Using a Quantitative Lens: The S&P 500 Economic Moat Index

- Categories Factors
- Tags 2024, economic moat, factors, Rupert Watts, S&P 500 Economic Moat Index, US FA
Popularized by Warren Buffett, the term economic moat refers to a company’s sustainable competitive advantage that allows it to preserve market share and generate high profits over the long term. In this analogy, companies are compared to medieval castles surrounded by deep and wide moats, which protected the castles from attack.
In the same way, economic moats protect companies from competitors and other external threats by making it difficult for the competition to replicate or challenge their position in the market. There are several potential sources of an economic moat including network effects, economies of scale, strong brand recognition and high switching costs.
We believe that available financial statement metrics can be used to identify sustainable economic moats; furthermore, that a purely quantitative approach helps overcome the limitations of a subjective selection process. Earlier this year, S&P DJI launched the S&P 500® Economic Moat Index, which seeks to identify companies with lasting competitive advantages. In this blog, we will introduce this index by reviewing its methodology and historical performance.
Methodology Overview

No single quantitative measure is the sole indicator of an economic moat. Instead, multiple metrics must be used with careful consideration as to how they complement one another. Our research identifies three core metrics by which companies should be assessed: high ROIC, high gross margins and high market share. We will examine each of these metrics more closely in a subsequent blog.
Consistency is another key aspect that should be considered when identifying economic moats. Many companies may be able to generate high returns in the short term, but the ability to do so on a consistent basis is indicative of a wide moat. Hence, the metrics should be analyzed over multiple periods.

The final selection is based on the average of these three Economic Moat Indicators, known as the Economic Moat Score. The top 50 companies are selected and then equally weighted to help avoid concentration risk and to place each company on equal footing.
Performance Review
Back-tested data show that the companies with the widest economic moats generated significant outperformance since June 30, 2013 (see Exhibit 3). Over the full period, the S&P 500 Economic Moat Index outperformed the S&P 500 by 2.63% annualized.
Furthermore, the index has exhibited defensive characteristics as evidenced by its reduced volatility and downside capture. This is expected since companies with wide economic moats tend to be higher quality and better able to weather periods of market stress and uncertainty.

Historical Sector Weights
Let’s now examine the average sector weights in Exhibit 4. Historically, the S&P 500 Economic Moat Index has seen its largest sector overweights in Consumer Discretionary, Consumer Staples and Information Technology. Its most notable underweights have been in Energy and Financials.

Historical Turnover
Let’s now review another compelling feature of this index: its low turnover. Across the full back-tested period, the index averaged 27.01% one-way turnover, which is low relative to other factor-based indices.

Conclusion
S&P Dow Jones Indices is pleased to continue its index innovation with the launch of this new index into our factor family. For those seeking to track high quality companies with a history of long-term outperformance and defensive characteristics, the S&P 500 Economic Moat Index may be an appealing option to consider. Please stay tuned for future blogs in this series that will delve into the individual economic moat indicators in greater detail.
The posts on this blog are opinions, not advice. Please read our Disclaimers.New Bitcoin Indices Doing “Yard Work” in the Spring

In Wall Street parlance, a yard refers to a billion and a buck is a million. You can overhear traders asking questions like, “how many bucks did that trade?” or, “did that company raise a yard?” The crypto space is gathering assets by the yard these days with new product launches by ETF issuers. For the most part, these products follow the simple price of a single cryptocurrency. New index-based solutions are coming to the market and are also gaining attention. The S&P CME Bitcoin Futures Daily Roll Index and the S&P 500 and S&P Bitcoin Futures 75/25 Blend Index are two examples of how indexing works in the crypto space.
Financialization of crypto in the ETF space has followed a similar pattern to that of the commodity markets. The first commodity ETF, launched in November 2004, tracks the simple price of gold and was groundbreaking for its innovation in allowing investors to gain direct exposure to the price of gold without the need to physically own or store the metal. Commodity investors then began tracking indices like the Dow Jones Commodity Index Gold that maintained continuous exposure to rolling futures contracts rather than the underlying commodity. These indices allowed the incorporation of new performance measures such as collateral return, as well as inverse and leverage performance. As the commodity market evolved, investors sought out broad-based commodity exposure, as measured by the S&P GSCI, which tracks 24 commodities and employs a production-weighting approach with monthly contract rolls.
Twenty years after the first gold ETF launched, Bitcoin followed suit. Also tracking the simple price of a single coin, new ground was broken in the space. Following these spot product launches came renewed interest in futures-based indices, whereby issuers can deploy leverage for added volatility (yes, more volatility) and use the S&P CME Bitcoin Daily Roll Index to track performance. The index rolls contracts on a daily basis leading up to the front month expiry. For the complete index methodology, see here. Performance of the futures index, which launched on Jan. 10, 2022, has tracked the S&P Bitcoin Index with a correlation of 0.995 with back-tested data to Dec. 28, 2017. For more information on back-tested performance, see the Performance Disclosure linked at the end of this post.
Another index that gets yards of attention is the S&P 500®. Combining the leading benchmark for U.S. equities with the recent market beating returns of Bitcoin has created quite a bit of buzz. The S&P 500 and S&P Bitcoin Futures 75/25 Blend Index maintains a market exposure to cryptocurrency alongside an allocation to the S&P 500. Index construction rules create the ability to maintain a dedicated exposure that performs a calendar-based rebalance, allocating between the S&P 500 and S&P CME Bitcoin Futures Index. For the complete index methodology, see here. By rebalancing back to a 25% weighting in the S&P CME Bitcoin Futures Index, this disciplined approach helps mitigate the risk of increasing concentration or reallocating to the underlying index during periods of market volatility, leading to a more diversified exposure.
The indexing landscape continues to evolve with emergent asset classes. One constant is the drive for transparent, rules-based approaches that provide simplified measurement and standard calculation. S&P DJI’s Index Mathematics Methodology guides our index solutions under the same principles the market has adopted as an industry standard. Maintaining benchmarks for over a century is yeoman’s work, but it’s a strategy that keeps the yardwork plentiful.
The posts on this blog are opinions, not advice. Please read our Disclaimers.