Get Indexology® Blog updates via email.

In This List

Diversification, Equity & Indices

Measuring the Global Water Opportunity Set

Australian Mid Caps: A Sweet Spot for Diversification and Historical Outperformance

Balancing Defense with Growth (Part II): The S&P Quality Developed Ex-U.S. LargeMidCap

The February 2024 Rebalance of the S&P 500 Low Volatility Index

Diversification, Equity & Indices

Contributor Image
Anu Ganti

U.S. Head of Index Investment Strategy

S&P Dow Jones Indices

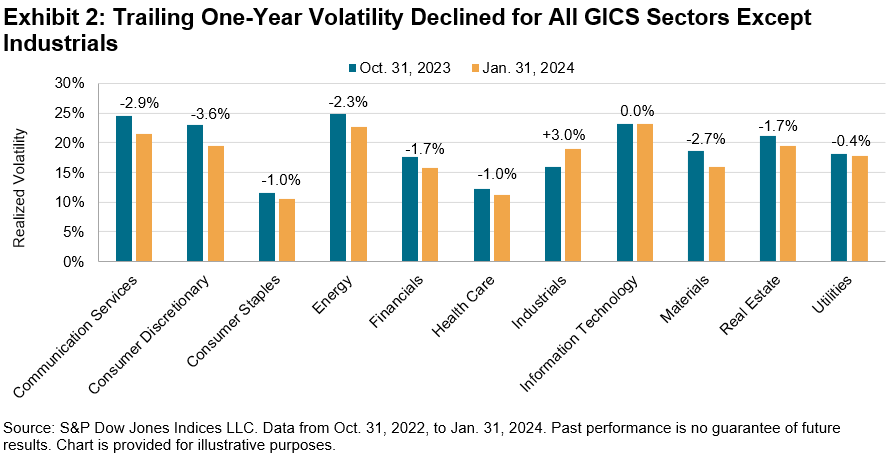
The results of S&P DJI’s latest SPIVA U.S. Scorecard are in: Most large-cap active managers underperformed the S&P 500® for the 14th consecutive year in a row. 60% of active large-cap funds underperformed the S&P 500 in 2023, slightly better than the long-term average of 64%, and a relatively benign result considering the dominance of the U.S. equity market’s largest stocks.

The current environment characterized by large-cap dominance can help add a unique perspective that can offer fresh insights into these results. Market concentration concerns in the U.S. have been prevalent, with the weight of the largest five companies in the S&P 500 rising from 19.5% a year ago to 25.2% as of the end of February, reaching levels we haven’t seen since the early 1970s. Parallel to the increase in market concentration, the S&P 500 Equal Weight Index has suffered accordingly, underperforming the S&P 500 by 17% in the 12-month period ending Feb. 29, 2024, its worst 12-month relative performance since its launch more than 20 years ago.

The simultaneous increase in concentration, underperformance of Equal Weight and majority underperformance by active managers is not surprising, as when the largest stocks outperform, the market becomes more concentrated in those names, leading to the outperformance of cap-weighted indices versus their equal-weighted counterparts. Consequently, active managers generally face challenges in keeping pace with the market-cap weights of the largest companies.

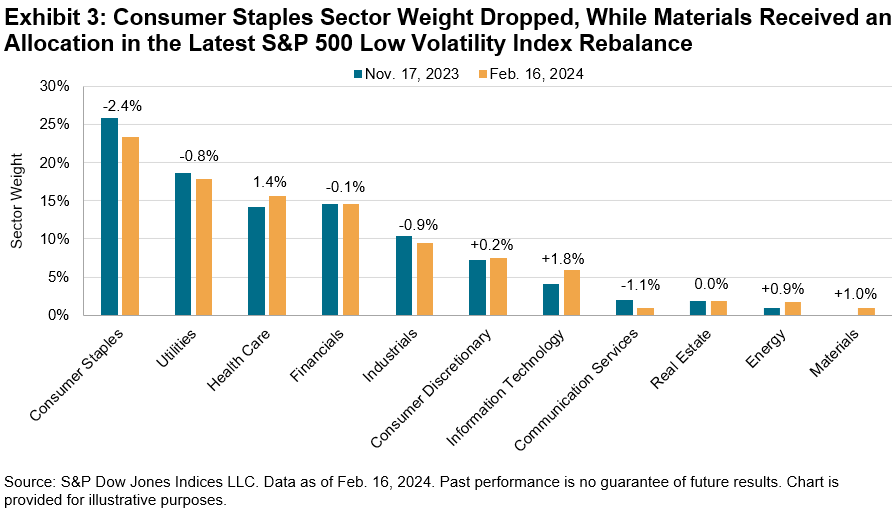
Germane to concentration concerns, the ability to diversify away from capitalization weights via regular rebalancing is often touted as one of the benefits of active management. As a result, we might expect the relative returns of active managers to mirror that of Equal Weight, and that is exactly what we observe in Exhibit 2, which shows a strong linear relationship historically between the equal-weighted average excess return of funds in the U.S. Large-Cap Core category versus Equal Weight’s excess return relative to the S&P 500.

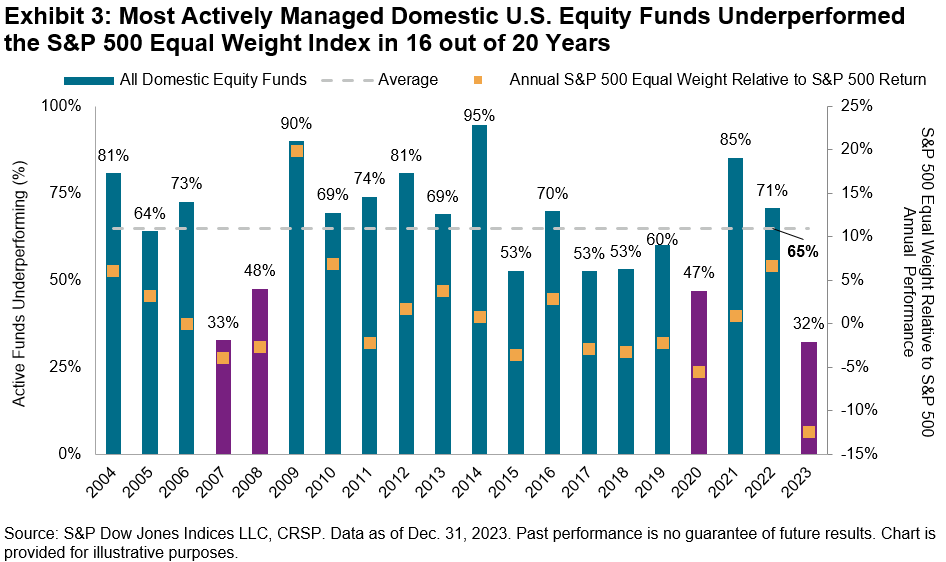
Given their similarities, a natural question one can ask is how have active funds performed when compared to Equal Weight? 2023 was a notable outlier, with 68% of domestic equity funds outperforming Equal Weight, perhaps not coincidentally aided by the index’s severe decline, with similar occurrences in 2007, 2008 and 2020. However, beating Equal Weight as a benchmark has proven to be difficult over the long term. Exhibit 3 shows that a majority of all actively managed domestic U.S. equity funds underperformed the S&P 500 Equal Weight Index in 16 of the last 20 years, with an annual average underperformance rate of 65%.

The data is evident that it has been very challenging historically to consistently outperform the benchmark, regardless of whether it is cap weighted or equal weighted. To dig deeper into how active managers across asset classes and geographies fared, we invite you to explore the results of our SPIVA U.S. Year-End 2023 Scorecard.

The posts on this blog are opinions, not advice. Please read our Disclaimers.

Measuring the Global Water Opportunity Set

Look inside the S&P Global Water Index and how it tracks the companies helping the world meet demand for this vital resource.

The posts on this blog are opinions, not advice. Please read our Disclaimers.

Australian Mid Caps: A Sweet Spot for Diversification and Historical Outperformance

Contributor Image
Sean Freer

Director, Global Equity Indices

S&P Dow Jones Indices

The S&P/ASX MidCap 50 was up 5.35% in February, outperforming the S&P/ASX 50—which posted 0.25%—by more than 5%. This was the largest relative outperformance of the mid-cap segment compared to large caps in a single month since October 2008.

A closer look at Australian mid caps, as measured by the S&P/ASX MidCap 50, shows the segment offers less concentration at the constituent and sector level compared to both large-cap and broad market indices.

The S&P/ASX MidCap 50 excludes the big four banks and large mining companies, which are well known for their large representations in the large-cap S&P/ASX 50 and the broader S&P/ASX 200.

The representation of Financials within the S&P/ASX 50 has grown to over one-third of the index’s weight, with 5 of the top 10 companies in the index coming from this sector, while the Materials sector accounts for nearly a quarter of the index’s weight. Meanwhile, the Financials and Materials sectors collectively make up over 50% of the S&P/ASX 200, while representing less than one-third of the S&P/ASX MidCap 50.

With less weight in Financials and Materials, the S&P/ASX Midcap 50 offers more representation to the Industrials sector, as well as companies that may benefit from technological advancements and disruptive innovations within the Information Technology and Communication Services sectors.

The Mid-Caps Segment Has Become More Distinct over the Past 12 Months

Market movements and constituent turnover at rebalance periods over the past 12 months have resulted in the sector composition of S&P/ASX MidCap 50 becoming more differentiated than the S&P/ASX 50 and S&P/ASX 200. For example, the S&P/ASX MidCap 50 has added around 5% to both the Industrials and Information Technology sectors and 3% to Communication Services. Meanwhile, the index weight of companies within the Materials and Energy sectors has decreased.

The S&P/ASX MidCap 50 is also much less concentrated than the large-cap and broad market indices. For the S&P/ASX 50 and S&P/ASX 200, the top 10 companies represent 60% and 48% of the index weight, respectively, with Financials accounting for half of the top 10 weight in both indices. In contrast, the top 10 companies in the S&P/ASX MidCap 50 comprise less than 35% of index weight, with a more diverse sector spread.

Mid-Cap Equity Risk Premium Has Been Rewarded Historically

Both bottom-up and top-down factors can drive stock market performance. In economic environments led by macro factors such as rising or falling rates or boom and bust commodity cycles, the mid-cap segment has historically demonstrated differentiated performance characteristics versus large caps and the broader market.

The S&P/ASX MidCap 50 underperformed the S&P/ASX 50 by more than 5% in 2023, which was a period characterized by rising interest rates, where investors valued quality and dividends offered by more established large caps. However, over a full economic cycle, as shown by the 5- and 10-year performance figures, the mid-cap segment has outperformed large caps and the broad market (see Exhibit 4).

Large Caps Were More Correlated to Small Caps on a Three-Year Basis

Historically, correlations between segments have increased during macro-driven markets, such as the 2008 Global Financial Crisis and the more recent COVID-19 pandemic. Correlations are still elevated on a rolling three-year basis, which includes the COVID-19 recovery rally. However, we are starting to see more deviation among returns entering the 36-month window, resulting in a recent reduction of large- versus mid-cap correlations, and interestingly, lower than the large- versus small-cap correlation.


The posts on this blog are opinions, not advice. Please read our Disclaimers.

Balancing Defense with Growth (Part II): The S&P Quality Developed Ex-U.S. LargeMidCap

Contributor Image
Wenli Bill Hao

Director, Factors and Dividends Indices, Product Management and Development

S&P Dow Jones Indices

As investments in artificial intelligence continue to boom, major indices in the U.S., Europe and Japan have hit all-time highs. In our previous blog, we reviewed how the S&P U.S. Quality Indices outperformed their corresponding benchmarks over both the short and the long term. Similarly, a quality premium also exists in developed ex-U.S. equity markets. As shown in Exhibit 1, for the one-year period from Jan. 31, 2023, to Jan. 31, 2024, the S&P Quality Developed Ex-U.S. LargeMidCap outperformed its benchmark by a decent margin. In this blog, we investigate the index’s design, performance, characteristics and attribution.

Quality Metrics and Index Design

The S&P Quality Developed Ex-U.S. LargeMidCap utilizes the same three prominent metrics as the S&P U.S. Quality Indices. These metrics aim to capture a company’s quality characteristics: strong profitability, high earnings quality and robust financial strength (see Exhibit 2). The index constituents correspond to the top 20% of eligible stocks within the S&P Developed Ex-U.S. LargeMidCap’s universe, ranked by their overall quality scores. These constituents are weighted by the product of their market capitalization and quality scores, subject to country (maximum 40%), sector (maximum 40%) and individual (maximum 5%) holding constraints.1

Performance Comparison

Historically, the S&P Quality Developed Ex-U.S. LargeMidCap has outperformed its benchmark over the short and the long term with respect to total return and risk-adjusted return (see Exhibit 3). Additionally, the quality strategy has tended to exhibit defensive qualities, as evidenced by lower beta and smaller drawdowns.

From its launch on July 8, 2014, to Jan. 31, 2024, the S&P Quality Developed Ex-U.S. LargeMidCap had a cumulative return of 71.19% (with an annualized volatility of 14.3%) versus a cumulative return of 51.87% (with an annualized volatility of 14.2%) for its benchmark. The outperformance of 19.32% was mainly from the top five contributors that were largely from the Information Technology and Health Care sectors (see Exhibit 4).

High Upside Participation and Defensive Characteristics

The historical capture ratios in Exhibit 5 show that the S&P Quality Developed Ex-U.S. LargeMidCap tended to participate one-for-one in up markets,2 while delivering significant outperformance during down markets. Such features held true for the whole period since the index inception date and post-launch period. These unique characteristics make sense, since quality indices are designed to track companies with durable business models and sustainable competitive advantages.

Country Exposure

In Exhibit 6, we investigate the country allocation of the constituents in the S&P Quality Developed Ex-U.S. LargeMidCap and its benchmark. From Dec. 17, 1999, to Jan. 31, 2024, the index mainly overweighted Switzerland (6.68%) and the U.K. (5.71%) while underweighting Japan (-9.00%) and Germany (-2.15%).

Sector Exposure

We next explore the sector exposure of the S&P Quality Developed Ex-U.S. LargeMidCap. As seen in Exhibit 7, the index historically has had a significant overweight in Health Care (10.02%) relative to its benchmark, with a large underweight in Financials (-14.74%).

Factor Exposure

Exhibit 8 shows the factor exposure of the S&P Quality Developed Ex-U.S. LargeMidCap versus its benchmark in terms of the Axioma World-Wide Ex-US Risk Model3 Factor Z-scores. The quality index demonstrated strong quality and growth tilts versus its benchmark. Specifically, the quality index had lower exposures to leverage ratio and value factors, with a higher exposure to growth than its benchmark.

1 For further information about the factor definition, factor score calculation and index design, please see the S&P Quality Indices Methodology.

2 The market is defined as the monthly performance of the underlying benchmark from Dec. 31, 1994, to July 31, 2023.

3 The Axioma World-Wide Ex-US Equity Factor Risk Model does not have a style factor for profitability.

The posts on this blog are opinions, not advice. Please read our Disclaimers.

The February 2024 Rebalance of the S&P 500 Low Volatility Index

Contributor Image
George Valantasis

Associate Director, Factors and Dividends

S&P Dow Jones Indices

Since the previous rebalance for the S&P 500® Low Volatility Index on Nov. 17, 2023, and its most recent on Feb. 16, 2024, the S&P 500 delivered a stunning 11.3% return. During this period, the S&P 500 Low Volatility Index was up 5.3%, strong by historical standards, albeit underperforming the S&P 500. As has been the trend recently, the S&P 500 Low Volatility Index historically tends to underperform during periods of low volatility for the S&P 500. Over this period, the annualized daily standard deviation for the S&P 500 was just 10.1%.

As Exhibit 2 shows, trailing one-year volatility decreased for all GICS sectors except for Industrials as of Jan. 31, 2024, versus Oct. 31, 2023. The widespread decline in volatility continued the trend that took place throughout most of 2023. Measured in absolute terms, the sectors with the largest declines in volatility were Consumer Discretionary, Communication Services and Materials, which dropped by 3.6%, 2.9% and 2.7%, respectively. Industrials was the only sector with an increase in volatility, rising from 15.9% to 19.0%.

Amid the overall decrease in volatility, the S&P 500 Low Volatility Index’s latest rebalance brought changes to sector weightings, although the changes were more muted than recent rebalances. Consumer Staples lost 2.4%, the most of any sector, although it retained its position as the highest-weighted sector, at 23.4%. The largest recipients were Information Technology and Health Care, receiving 1.8% and 1.4%, respectively. Materials received a 1.0% allocation, resulting in all 11 GICS sectors now being represented in the S&P 500 Low Volatility Index. The latest rebalance was effective after the market close on Feb. 16, 2024.


The posts on this blog are opinions, not advice. Please read our Disclaimers.