
Look inside the S&P Global Water Index and how it tracks the companies helping the world meet demand for this vital resource.
The posts on this blog are opinions, not advice. Please read our Disclaimers.
Measuring the Global Water Opportunity Set
Australian Mid Caps: A Sweet Spot for Diversification and Historical Outperformance
Balancing Defense with Growth (Part II): The S&P Quality Developed Ex-U.S. LargeMidCap
The February 2024 Rebalance of the S&P 500 Low Volatility Index
U.S. Sector Relevance to China
Measuring the Global Water Opportunity Set
Australian Mid Caps: A Sweet Spot for Diversification and Historical Outperformance

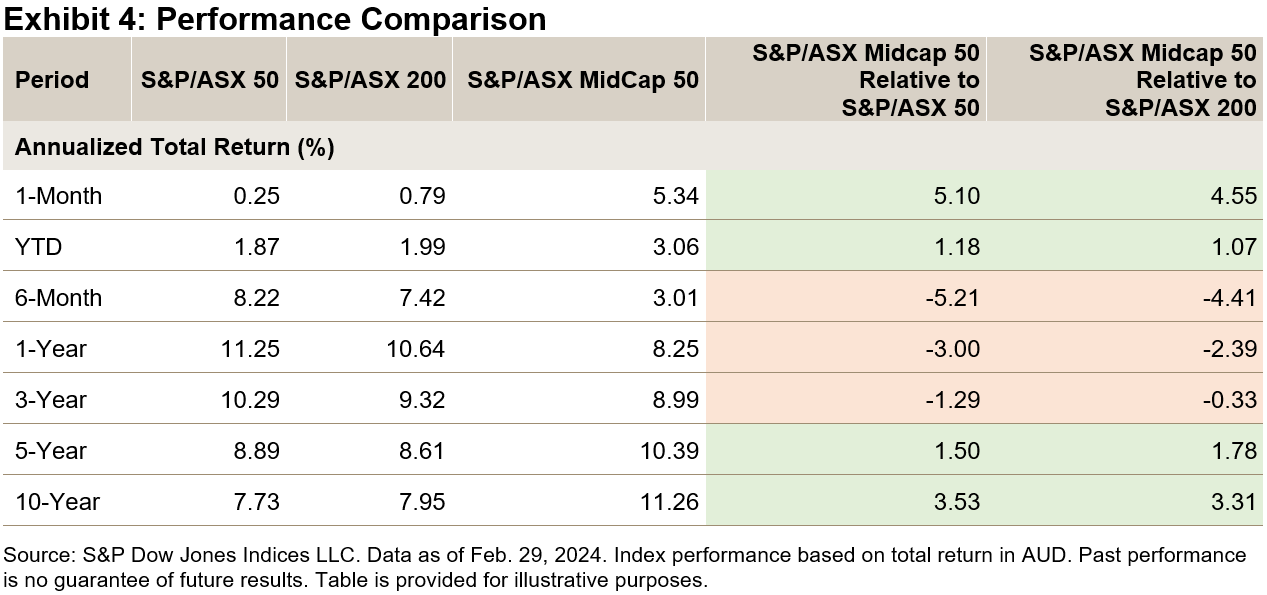
The S&P/ASX MidCap 50 was up 5.35% in February, outperforming the S&P/ASX 50—which posted 0.25%—by more than 5%. This was the largest relative outperformance of the mid-cap segment compared to large caps in a single month since October 2008.
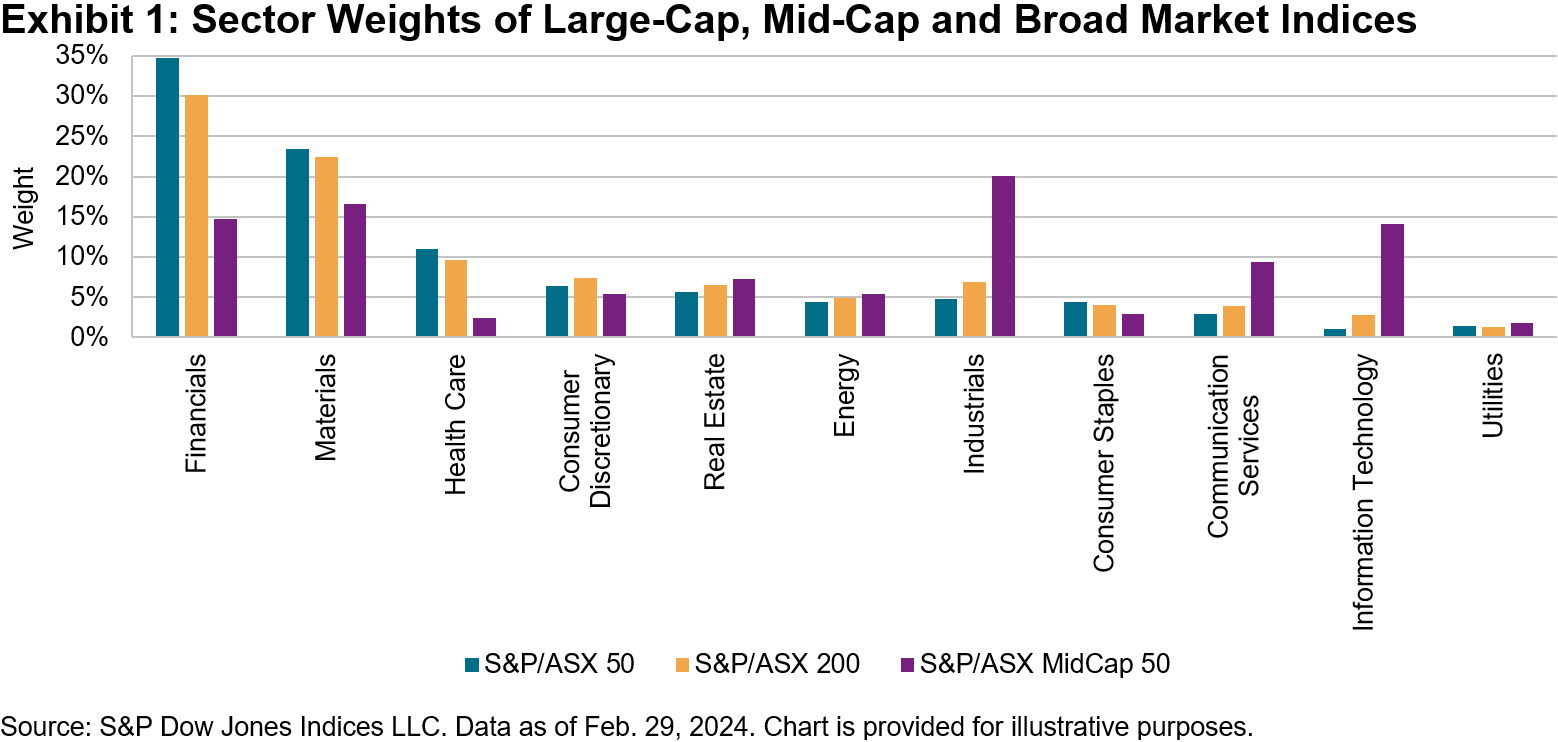
A closer look at Australian mid caps, as measured by the S&P/ASX MidCap 50, shows the segment offers less concentration at the constituent and sector level compared to both large-cap and broad market indices.
The S&P/ASX MidCap 50 excludes the big four banks and large mining companies, which are well known for their large representations in the large-cap S&P/ASX 50 and the broader S&P/ASX 200.
The representation of Financials within the S&P/ASX 50 has grown to over one-third of the index’s weight, with 5 of the top 10 companies in the index coming from this sector, while the Materials sector accounts for nearly a quarter of the index’s weight. Meanwhile, the Financials and Materials sectors collectively make up over 50% of the S&P/ASX 200, while representing less than one-third of the S&P/ASX MidCap 50.
With less weight in Financials and Materials, the S&P/ASX Midcap 50 offers more representation to the Industrials sector, as well as companies that may benefit from technological advancements and disruptive innovations within the Information Technology and Communication Services sectors.
The Mid-Caps Segment Has Become More Distinct over the Past 12 Months
Market movements and constituent turnover at rebalance periods over the past 12 months have resulted in the sector composition of S&P/ASX MidCap 50 becoming more differentiated than the S&P/ASX 50 and S&P/ASX 200. For example, the S&P/ASX MidCap 50 has added around 5% to both the Industrials and Information Technology sectors and 3% to Communication Services. Meanwhile, the index weight of companies within the Materials and Energy sectors has decreased.

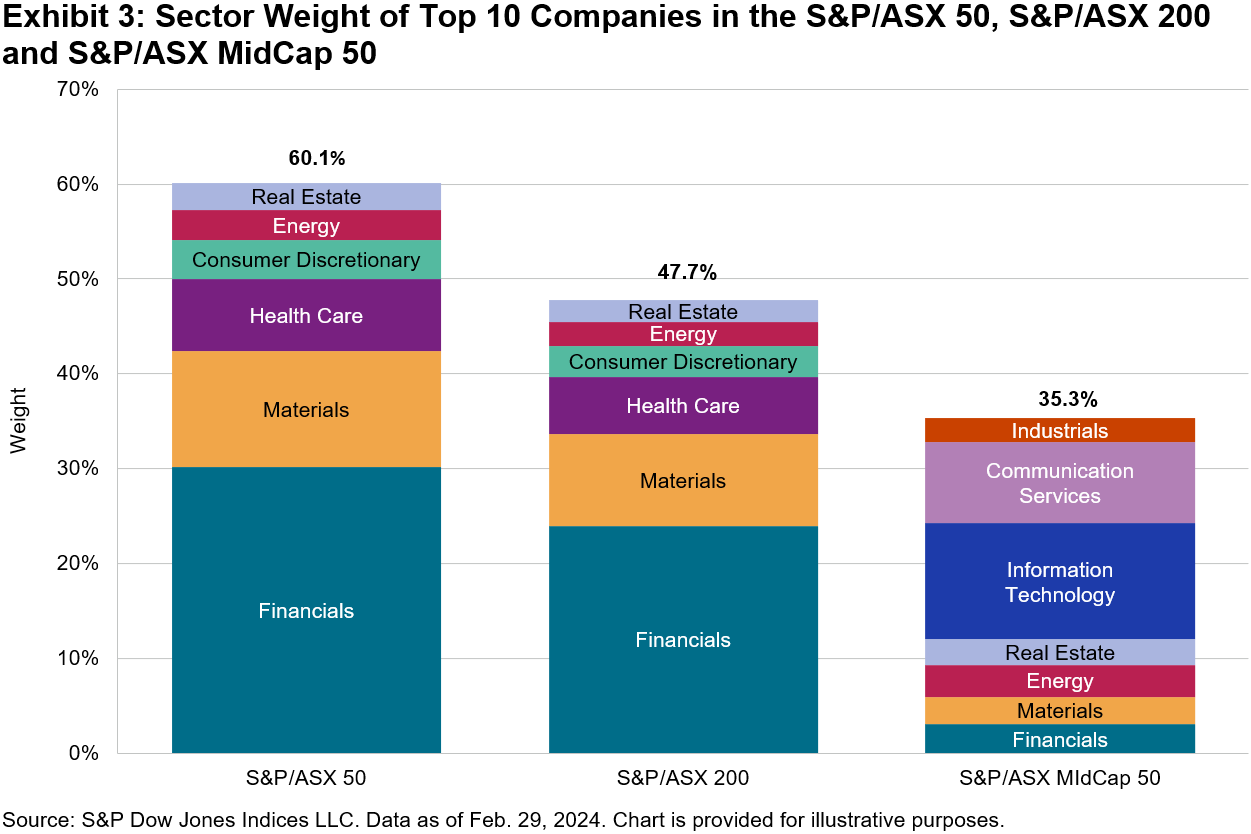
The S&P/ASX MidCap 50 is also much less concentrated than the large-cap and broad market indices. For the S&P/ASX 50 and S&P/ASX 200, the top 10 companies represent 60% and 48% of the index weight, respectively, with Financials accounting for half of the top 10 weight in both indices. In contrast, the top 10 companies in the S&P/ASX MidCap 50 comprise less than 35% of index weight, with a more diverse sector spread.
Mid-Cap Equity Risk Premium Has Been Rewarded Historically
Both bottom-up and top-down factors can drive stock market performance. In economic environments led by macro factors such as rising or falling rates or boom and bust commodity cycles, the mid-cap segment has historically demonstrated differentiated performance characteristics versus large caps and the broader market.
The S&P/ASX MidCap 50 underperformed the S&P/ASX 50 by more than 5% in 2023, which was a period characterized by rising interest rates, where investors valued quality and dividends offered by more established large caps. However, over a full economic cycle, as shown by the 5- and 10-year performance figures, the mid-cap segment has outperformed large caps and the broad market (see Exhibit 4).
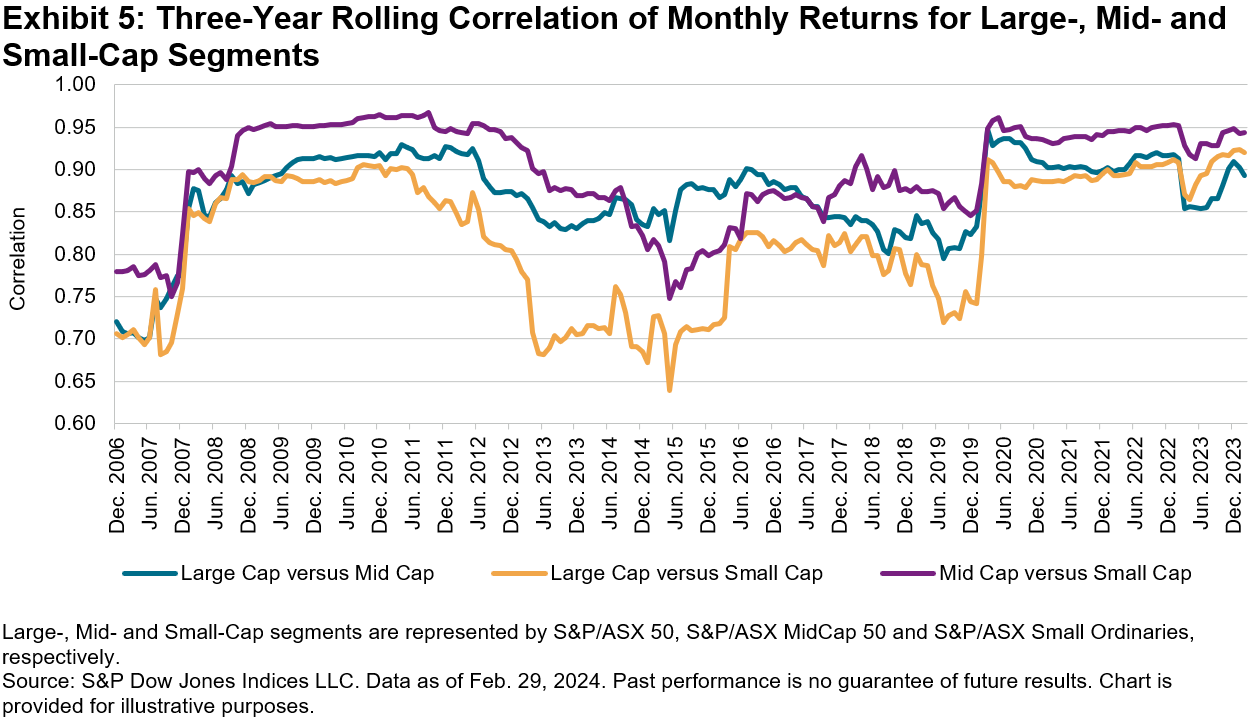
Large Caps Were More Correlated to Small Caps on a Three-Year Basis
Historically, correlations between segments have increased during macro-driven markets, such as the 2008 Global Financial Crisis and the more recent COVID-19 pandemic. Correlations are still elevated on a rolling three-year basis, which includes the COVID-19 recovery rally. However, we are starting to see more deviation among returns entering the 36-month window, resulting in a recent reduction of large- versus mid-cap correlations, and interestingly, lower than the large- versus small-cap correlation.
The posts on this blog are opinions, not advice. Please read our Disclaimers.
Balancing Defense with Growth (Part II): The S&P Quality Developed Ex-U.S. LargeMidCap

Wenli Bill Hao
Director, Factors and Dividends Indices, Product Management and Development
S&P Dow Jones Indices
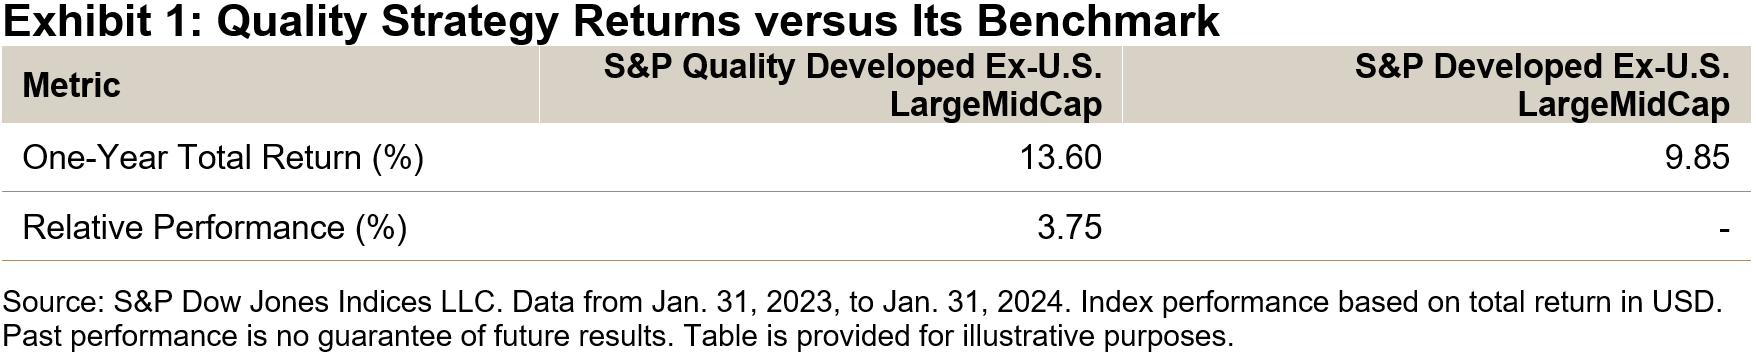
As investments in artificial intelligence continue to boom, major indices in the U.S., Europe and Japan have hit all-time highs. In our previous blog, we reviewed how the S&P U.S. Quality Indices outperformed their corresponding benchmarks over both the short and the long term. Similarly, a quality premium also exists in developed ex-U.S. equity markets. As shown in Exhibit 1, for the one-year period from Jan. 31, 2023, to Jan. 31, 2024, the S&P Quality Developed Ex-U.S. LargeMidCap outperformed its benchmark by a decent margin. In this blog, we investigate the index’s design, performance, characteristics and attribution.
Quality Metrics and Index Design
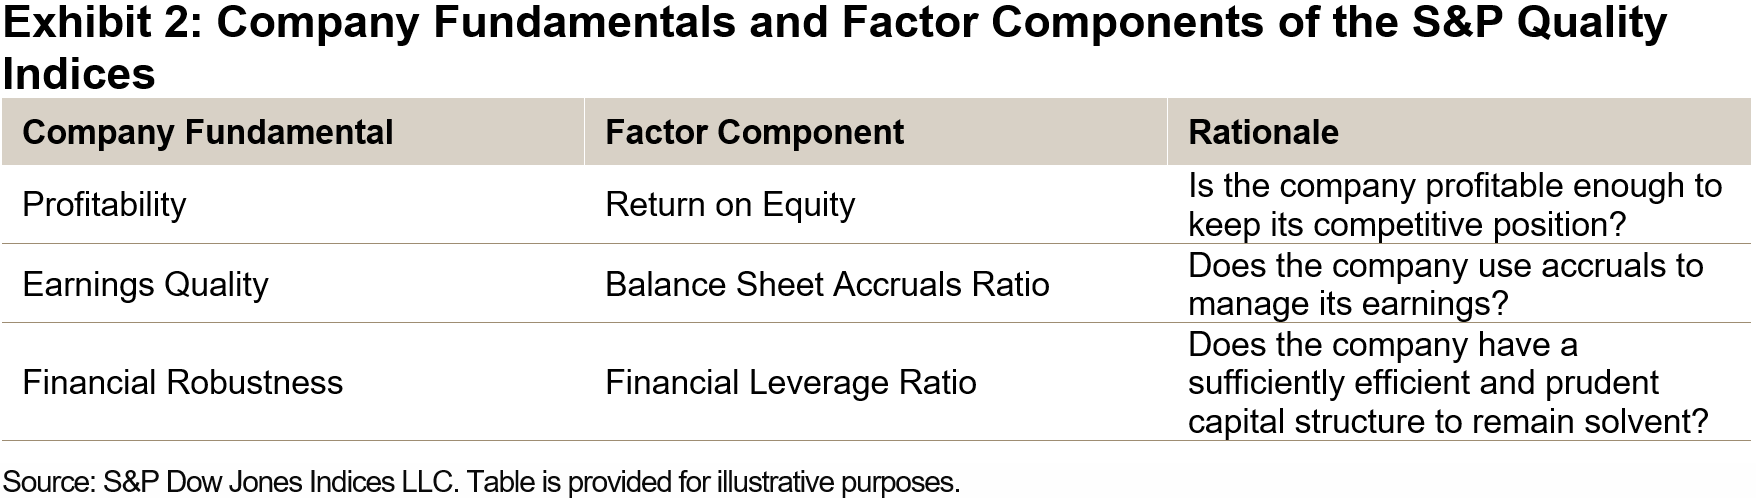
The S&P Quality Developed Ex-U.S. LargeMidCap utilizes the same three prominent metrics as the S&P U.S. Quality Indices. These metrics aim to capture a company’s quality characteristics: strong profitability, high earnings quality and robust financial strength (see Exhibit 2). The index constituents correspond to the top 20% of eligible stocks within the S&P Developed Ex-U.S. LargeMidCap’s universe, ranked by their overall quality scores. These constituents are weighted by the product of their market capitalization and quality scores, subject to country (maximum 40%), sector (maximum 40%) and individual (maximum 5%) holding constraints.1
Performance Comparison
Historically, the S&P Quality Developed Ex-U.S. LargeMidCap has outperformed its benchmark over the short and the long term with respect to total return and risk-adjusted return (see Exhibit 3). Additionally, the quality strategy has tended to exhibit defensive qualities, as evidenced by lower beta and smaller drawdowns.
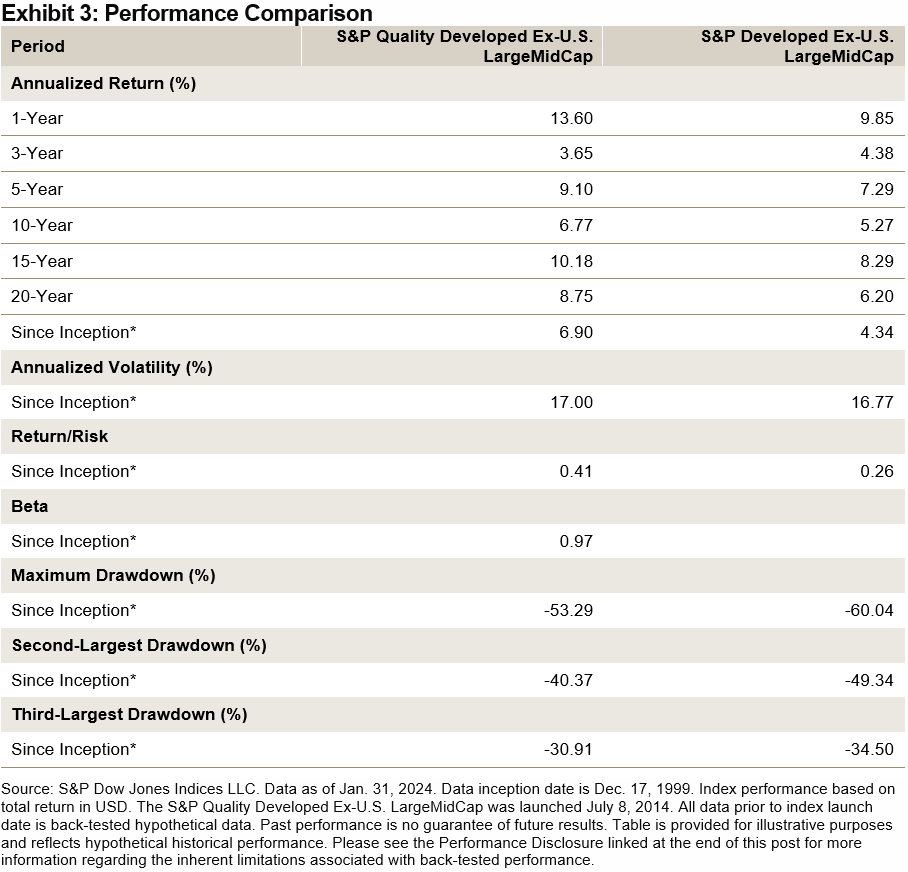
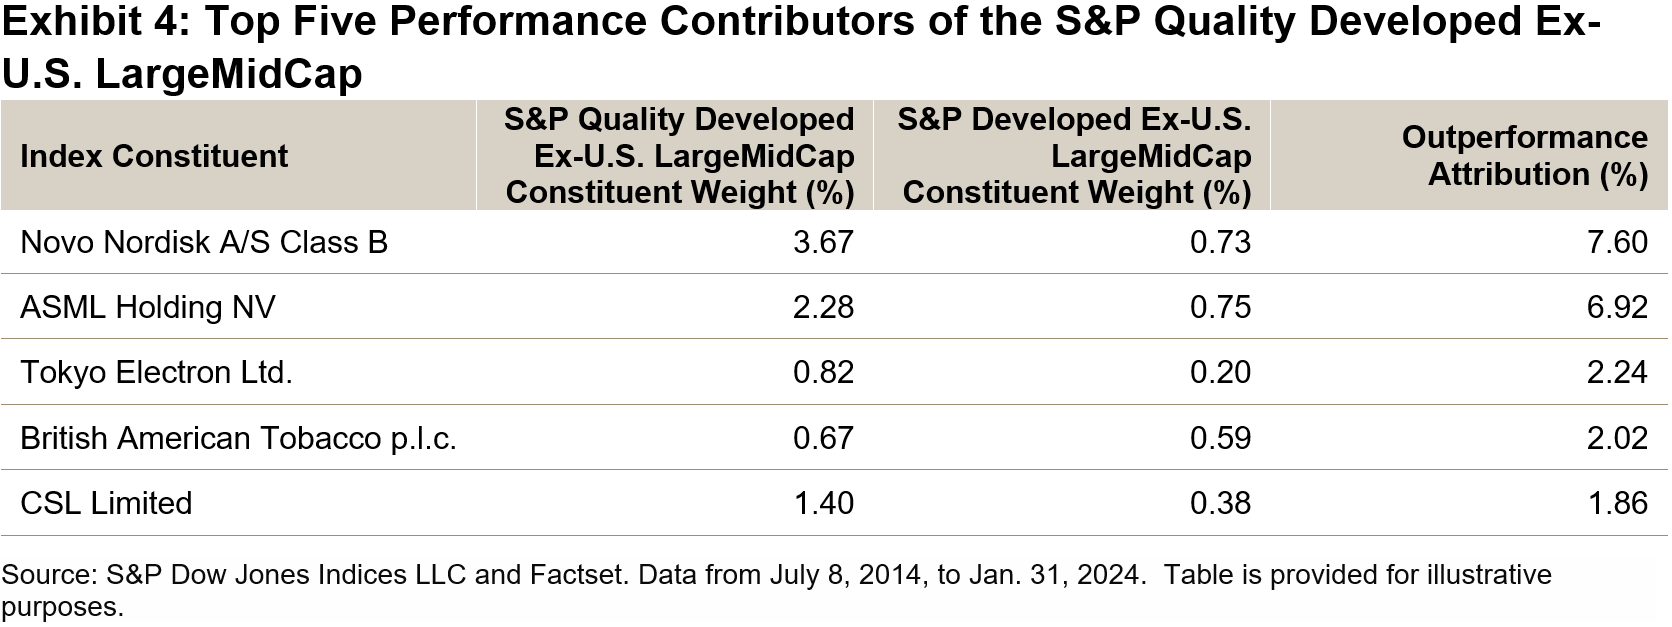
From its launch on July 8, 2014, to Jan. 31, 2024, the S&P Quality Developed Ex-U.S. LargeMidCap had a cumulative return of 71.19% (with an annualized volatility of 14.3%) versus a cumulative return of 51.87% (with an annualized volatility of 14.2%) for its benchmark. The outperformance of 19.32% was mainly from the top five contributors that were largely from the Information Technology and Health Care sectors (see Exhibit 4).
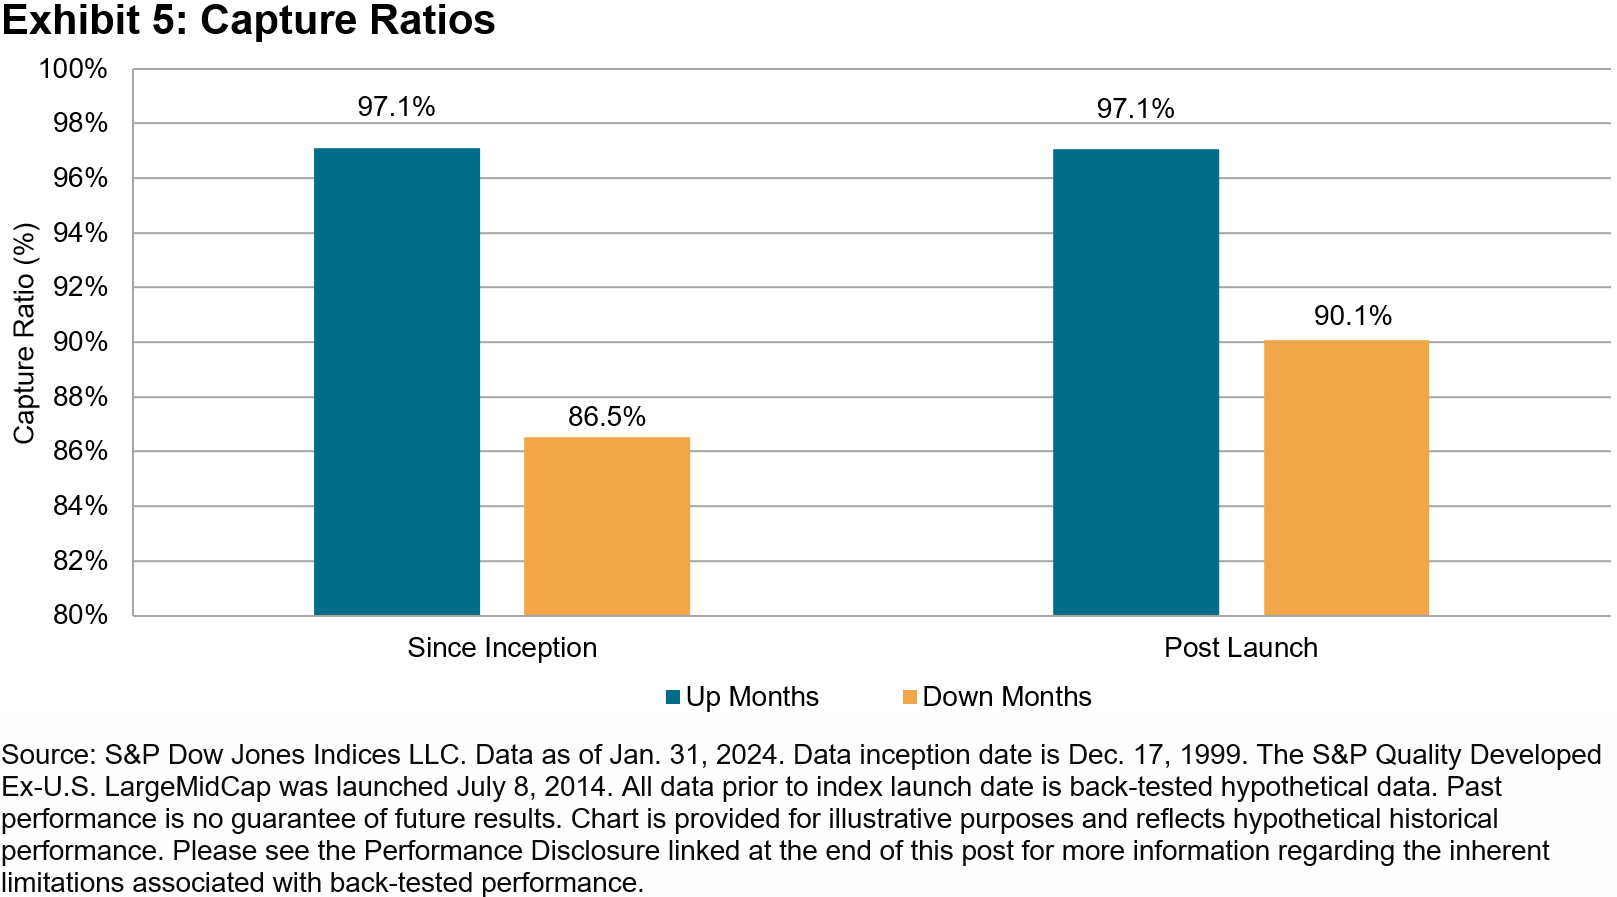
High Upside Participation and Defensive Characteristics
The historical capture ratios in Exhibit 5 show that the S&P Quality Developed Ex-U.S. LargeMidCap tended to participate one-for-one in up markets,2 while delivering significant outperformance during down markets. Such features held true for the whole period since the index inception date and post-launch period. These unique characteristics make sense, since quality indices are designed to track companies with durable business models and sustainable competitive advantages.
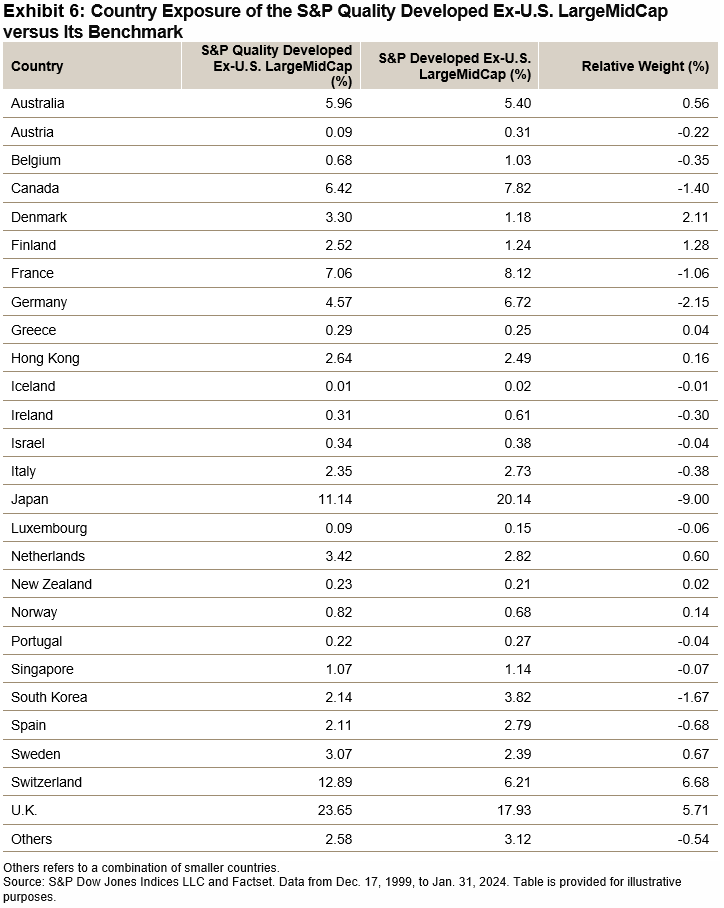
Country Exposure
In Exhibit 6, we investigate the country allocation of the constituents in the S&P Quality Developed Ex-U.S. LargeMidCap and its benchmark. From Dec. 17, 1999, to Jan. 31, 2024, the index mainly overweighted Switzerland (6.68%) and the U.K. (5.71%) while underweighting Japan (-9.00%) and Germany (-2.15%).
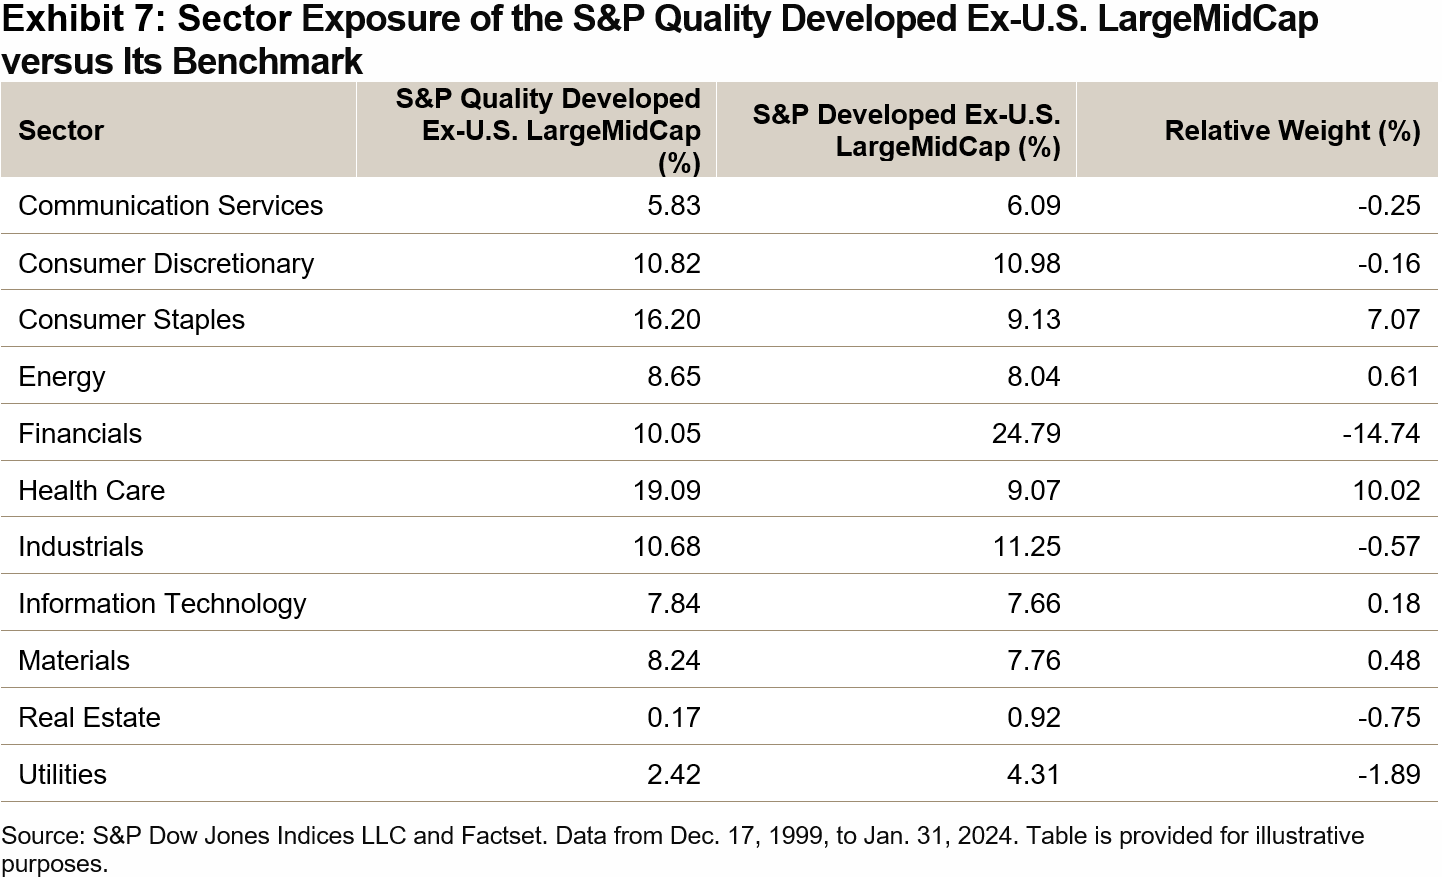
Sector Exposure
We next explore the sector exposure of the S&P Quality Developed Ex-U.S. LargeMidCap. As seen in Exhibit 7, the index historically has had a significant overweight in Health Care (10.02%) relative to its benchmark, with a large underweight in Financials (-14.74%).
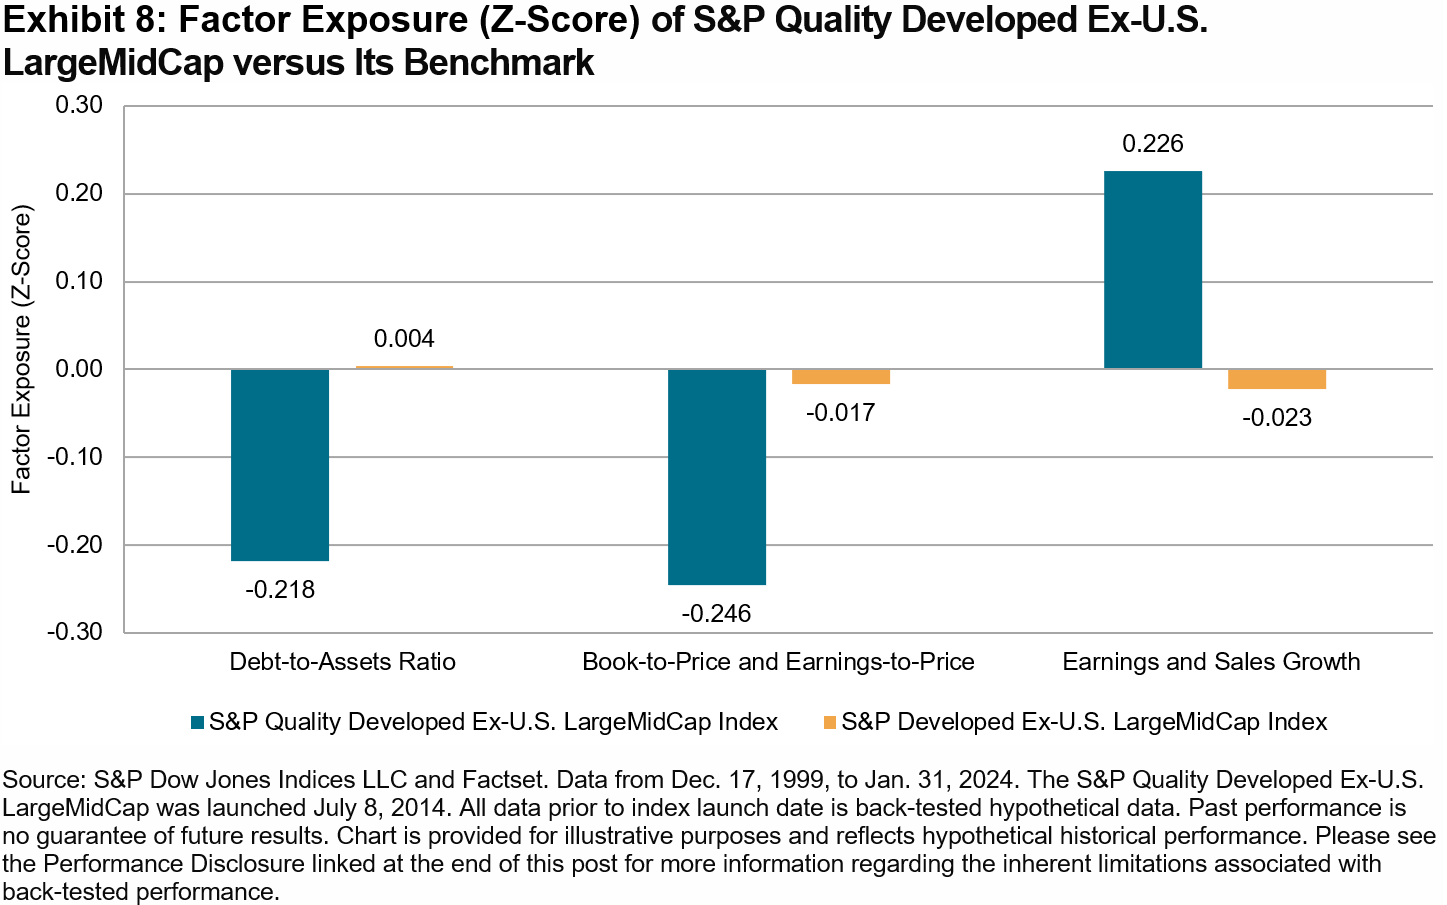
Factor Exposure
Exhibit 8 shows the factor exposure of the S&P Quality Developed Ex-U.S. LargeMidCap versus its benchmark in terms of the Axioma World-Wide Ex-US Risk Model3 Factor Z-scores. The quality index demonstrated strong quality and growth tilts versus its benchmark. Specifically, the quality index had lower exposures to leverage ratio and value factors, with a higher exposure to growth than its benchmark.
1 For further information about the factor definition, factor score calculation and index design, please see the S&P Quality Indices Methodology.
2 The market is defined as the monthly performance of the underlying benchmark from Dec. 31, 1994, to July 31, 2023.
3 The Axioma World-Wide Ex-US Equity Factor Risk Model does not have a style factor for profitability.
The posts on this blog are opinions, not advice. Please read our Disclaimers.The February 2024 Rebalance of the S&P 500 Low Volatility Index

Since the previous rebalance for the S&P 500® Low Volatility Index on Nov. 17, 2023, and its most recent on Feb. 16, 2024, the S&P 500 delivered a stunning 11.3% return. During this period, the S&P 500 Low Volatility Index was up 5.3%, strong by historical standards, albeit underperforming the S&P 500. As has been the trend recently, the S&P 500 Low Volatility Index historically tends to underperform during periods of low volatility for the S&P 500. Over this period, the annualized daily standard deviation for the S&P 500 was just 10.1%.

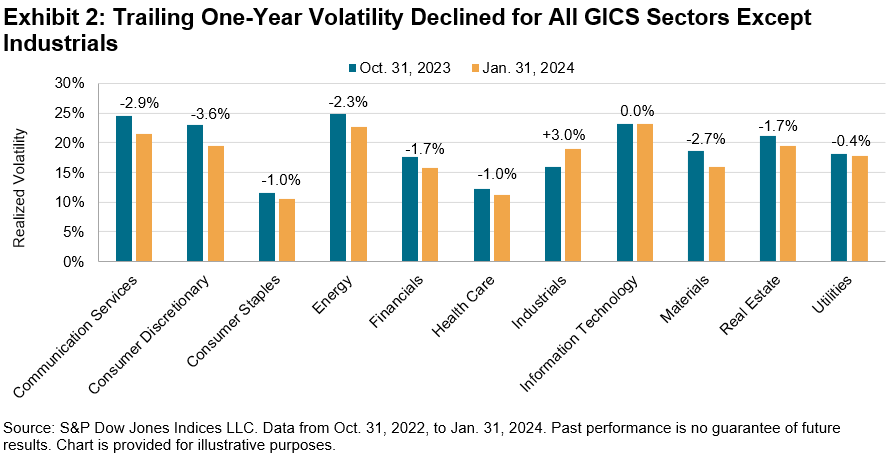
As Exhibit 2 shows, trailing one-year volatility decreased for all GICS sectors except for Industrials as of Jan. 31, 2024, versus Oct. 31, 2023. The widespread decline in volatility continued the trend that took place throughout most of 2023. Measured in absolute terms, the sectors with the largest declines in volatility were Consumer Discretionary, Communication Services and Materials, which dropped by 3.6%, 2.9% and 2.7%, respectively. Industrials was the only sector with an increase in volatility, rising from 15.9% to 19.0%.
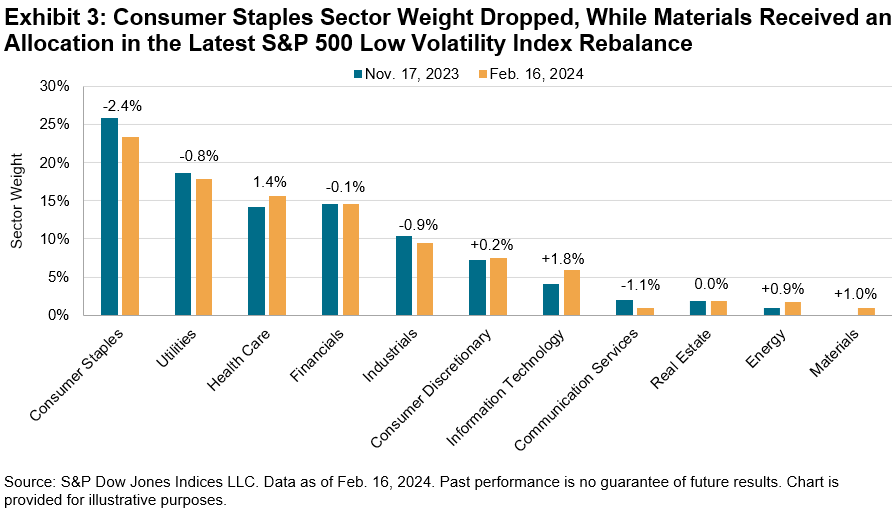
Amid the overall decrease in volatility, the S&P 500 Low Volatility Index’s latest rebalance brought changes to sector weightings, although the changes were more muted than recent rebalances. Consumer Staples lost 2.4%, the most of any sector, although it retained its position as the highest-weighted sector, at 23.4%. The largest recipients were Information Technology and Health Care, receiving 1.8% and 1.4%, respectively. Materials received a 1.0% allocation, resulting in all 11 GICS sectors now being represented in the S&P 500 Low Volatility Index. The latest rebalance was effective after the market close on Feb. 16, 2024.
The posts on this blog are opinions, not advice. Please read our Disclaimers.
U.S. Sector Relevance to China

Chinese investors tend to exhibit high exposures to domestic equities. Incorporating U.S. equities could help Chinese investors diversify their strategies and alleviate home-country bias. For example, the S&P 500® may be relevant for exposure and sensitivity to the U.S. economy. Additionally, market participants seeking to offset domestic equity biases or express tactical views may wish to consider the potential applications of the S&P 500 sector indices.
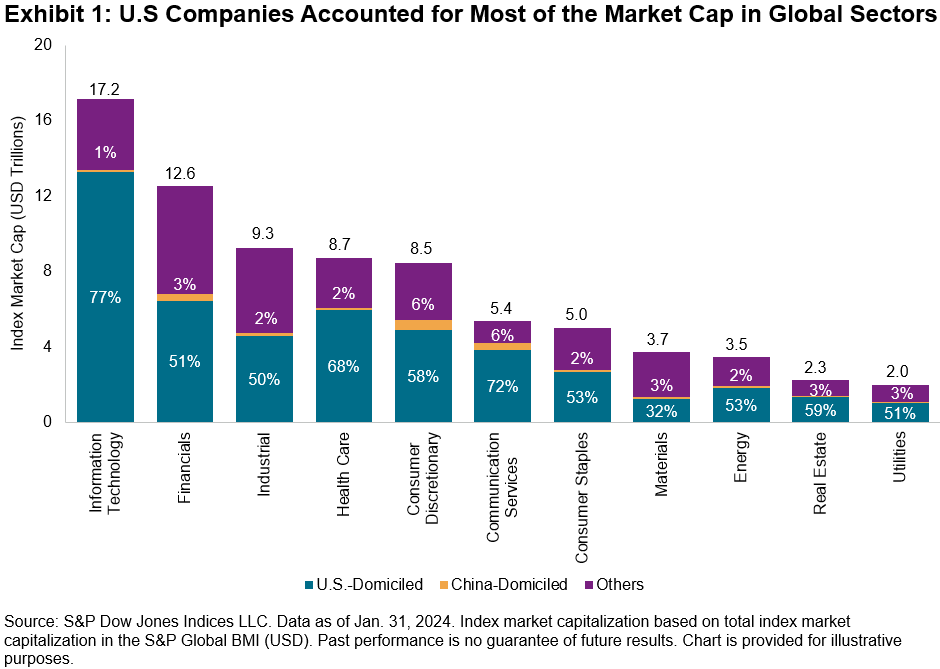
The representation of U.S. equities in global equity markets underscores the importance of a U.S. perspective when looking to express views on various sectors. Exhibit 1 shows the proportion of each GICS® sector represented by companies domiciled in different parts of the world. Specifically, U.S.-domiciled companies accounted for most of the market capitalization in 10 out of the 11 global sectors.
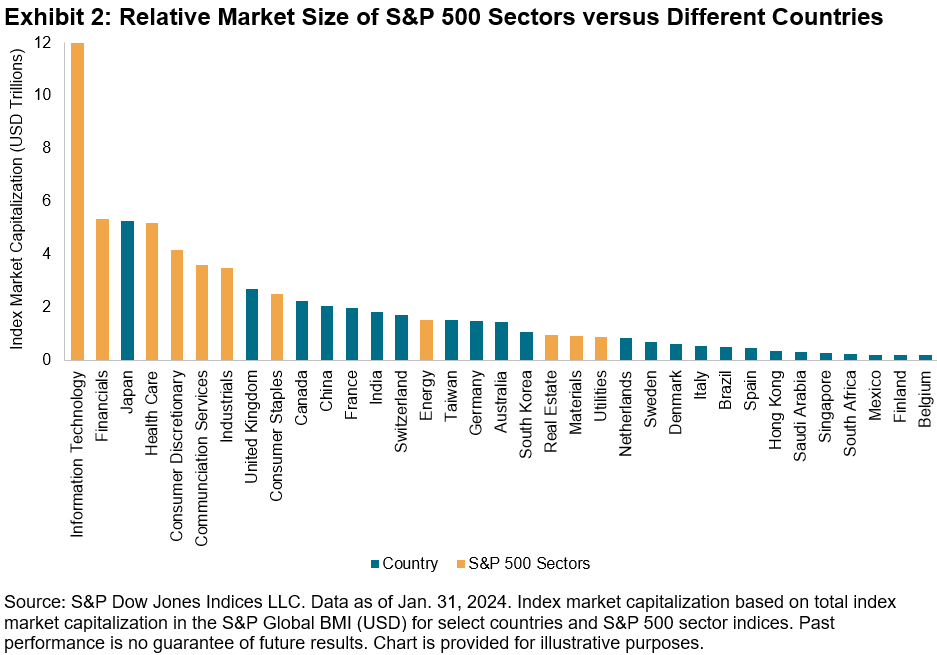
Moreover, the breadth and depth of the U.S. equities market means that the size of S&P 500 sectors is comparable to many countries. For instance, as of Jan. 31, 2024, the market capitalization of the S&P 500 Information Technology (USD 12 trillion) was second only to the entire U.S. market in the S&P Global BMI (USD 50 trillion). The S&P 500 Financials and S&P 500 Health Care are comparable in size to the Japanese market. The size of U.S. sector segments means that expressing views through a sector lens could have presented similar opportunities—as measured by market size or capacity-adjusted dispersion—as expressing views through a country lens, historically.
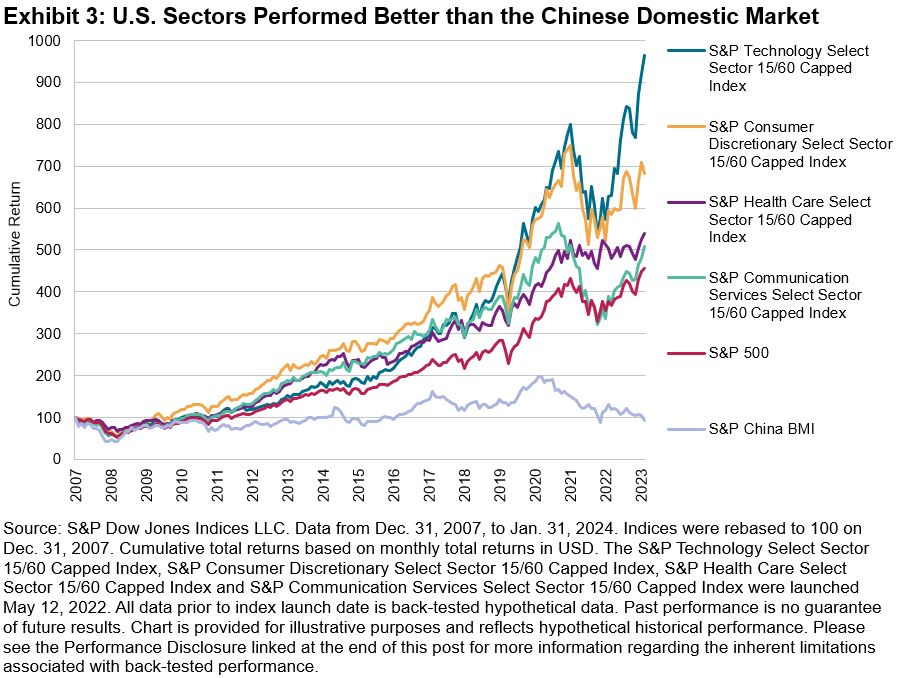
The S&P Select Sector 15/60 Capped Indices measure the performance of S&P 500 companies across the 11 GICS sectors, while employing a capping mechanism that limits the weight of the largest companies in the index. These U.S. sector indices could help Chinese investors diversify their strategies, especially when the domestic market is underperforming.
In recent years, China has grappled with a slower-than-expected recovery from the COVID-19 pandemic and encountered various internal and external challenges. During the same period, however, certain U.S. sectors showcased remarkable resilience and delivered substantial returns. For example, the S&P Communication Services Select Sector 15/60 Capped Index, which experienced a larger decline than the S&P China BMI in 2022 (-34% versus -22%, respectively), rebounded with a 42% return in 2023, while the S&P China BMI saw an additional 10% drop.
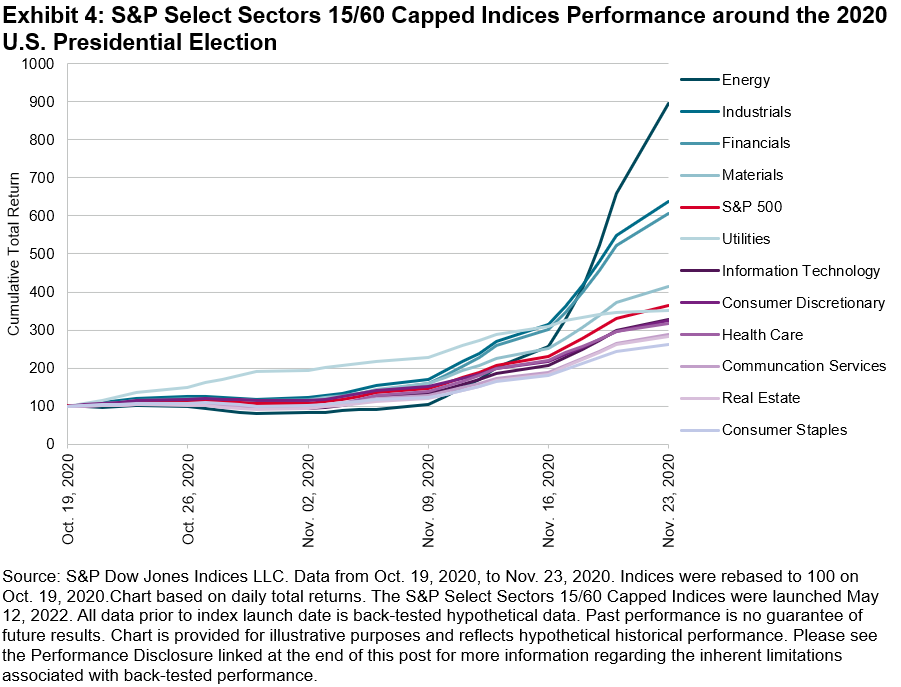
Historical evidence highlights the potential value of utilizing sectors to express views on the U.S. Presidential election, as investors often factor in the anticipated impact of candidates’ policies on various market segments. The 2016 election saw a significant divergence between the best- and worst-performing sectors, emphasizing the potential value of expressing views through a sector lens. More recently, sector performance around the 2020 election was influenced by several dynamics, including surging oil prices which helped Energy companies to outperform (see Exhibit 4).
As we approach the end of 2024, a new round of the presidential election is underway. Given the prevailing global and U.S. conditions, Chinese investors could still leverage U.S. sectors to convey their perspectives on the potential impacts of the election.
Overall, U.S. sectors represent significant market segments and could offer opportunities that Chinese investors may not want to overlook, whether for global equities exposure or tactical strategies. The upcoming presidential election further provides a platform for investors to express views on U.S. matters, adding an additional dimension to the strategic considerations for Chinese investors.
The posts on this blog are opinions, not advice. Please read our Disclaimers.