Get Indexology® Blog updates via email.

In This List

The February 2024 Rebalance of the S&P 500 Low Volatility Index

U.S. Sector Relevance to China

Navigating Private Credit Liquidity Challenges with Indices

Food Inflation Bites into Income as Commodities March Higher

Building on Tradition: India’s Digital Reboot

The February 2024 Rebalance of the S&P 500 Low Volatility Index

Contributor Image
George Valantasis

Associate Director, Factors and Dividends

S&P Dow Jones Indices

Since the previous rebalance for the S&P 500® Low Volatility Index on Nov. 17, 2023, and its most recent on Feb. 16, 2024, the S&P 500 delivered a stunning 11.3% return. During this period, the S&P 500 Low Volatility Index was up 5.3%, strong by historical standards, albeit underperforming the S&P 500. As has been the trend recently, the S&P 500 Low Volatility Index historically tends to underperform during periods of low volatility for the S&P 500. Over this period, the annualized daily standard deviation for the S&P 500 was just 10.1%.

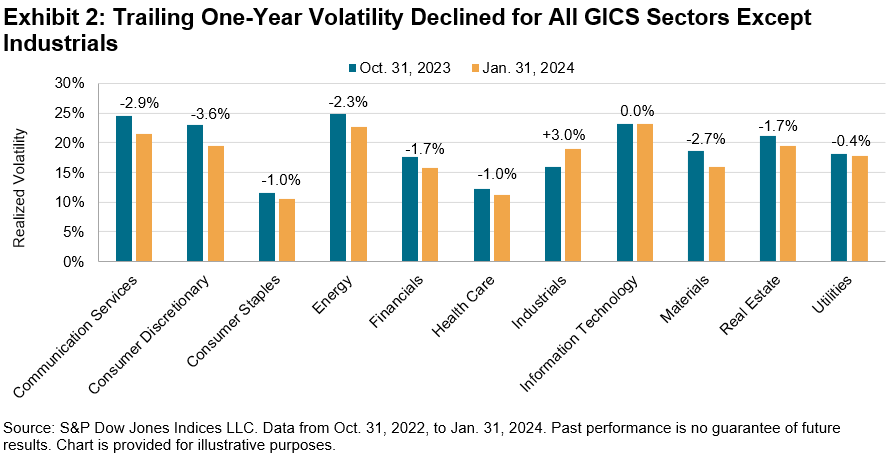
As Exhibit 2 shows, trailing one-year volatility decreased for all GICS sectors except for Industrials as of Jan. 31, 2024, versus Oct. 31, 2023. The widespread decline in volatility continued the trend that took place throughout most of 2023. Measured in absolute terms, the sectors with the largest declines in volatility were Consumer Discretionary, Communication Services and Materials, which dropped by 3.6%, 2.9% and 2.7%, respectively. Industrials was the only sector with an increase in volatility, rising from 15.9% to 19.0%.

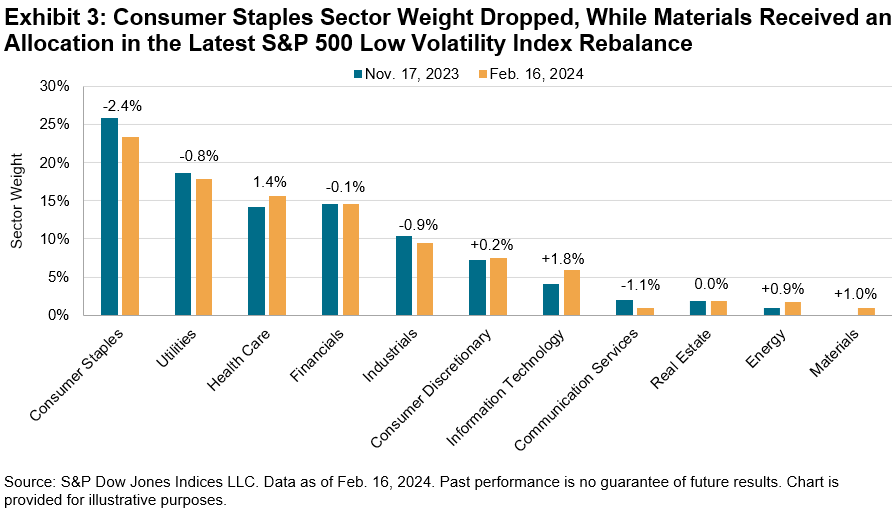
Amid the overall decrease in volatility, the S&P 500 Low Volatility Index’s latest rebalance brought changes to sector weightings, although the changes were more muted than recent rebalances. Consumer Staples lost 2.4%, the most of any sector, although it retained its position as the highest-weighted sector, at 23.4%. The largest recipients were Information Technology and Health Care, receiving 1.8% and 1.4%, respectively. Materials received a 1.0% allocation, resulting in all 11 GICS sectors now being represented in the S&P 500 Low Volatility Index. The latest rebalance was effective after the market close on Feb. 16, 2024.


The posts on this blog are opinions, not advice. Please read our Disclaimers.

U.S. Sector Relevance to China

Contributor Image
Fei Wang

Senior Analyst, U.S. Equity Indices

S&P Dow Jones Indices

Chinese investors tend to exhibit high exposures to domestic equities. Incorporating U.S. equities could help Chinese investors diversify their strategies and alleviate home-country bias. For example, the S&P 500® may be relevant for exposure and sensitivity to the U.S. economy. Additionally, market participants seeking to offset domestic equity biases or express tactical views may wish to consider the potential applications of the S&P 500 sector indices.

The representation of U.S. equities in global equity markets underscores the importance of a U.S. perspective when looking to express views on various sectors. Exhibit 1 shows the proportion of each GICS® sector represented by companies domiciled in different parts of the world. Specifically, U.S.-domiciled companies accounted for most of the market capitalization in 10 out of the 11 global sectors.

Moreover, the breadth and depth of the U.S. equities market means that the size of S&P 500 sectors is comparable to many countries. For instance, as of Jan. 31, 2024, the market capitalization of the S&P 500 Information Technology (USD 12 trillion) was second only to the entire U.S. market in the S&P Global BMI (USD 50 trillion). The S&P 500 Financials and S&P 500 Health Care are comparable in size to the Japanese market. The size of U.S. sector segments means that expressing views through a sector lens could have presented similar opportunities—as measured by market size or capacity-adjusted dispersion—as expressing views through a country lens, historically.

The S&P Select Sector 15/60 Capped Indices measure the performance of S&P 500 companies across the 11 GICS sectors, while employing a capping mechanism that limits the weight of the largest companies in the index. These U.S. sector indices could help Chinese investors diversify their strategies, especially when the domestic market is underperforming.

In recent years, China has grappled with a slower-than-expected recovery from the COVID-19 pandemic and encountered various internal and external challenges. During the same period, however, certain U.S. sectors showcased remarkable resilience and delivered substantial returns. For example, the S&P Communication Services Select Sector 15/60 Capped Index, which experienced a larger decline than the S&P China BMI in 2022 (-34% versus -22%, respectively), rebounded with a 42% return in 2023, while the S&P China BMI saw an additional 10% drop.

Historical evidence highlights the potential value of utilizing sectors to express views on the U.S. Presidential election, as investors often factor in the anticipated impact of candidates’ policies on various market segments. The 2016 election saw a significant divergence between the best- and worst-performing sectors, emphasizing the potential value of expressing views through a sector lens. More recently, sector performance around the 2020 election was influenced by several dynamics, including surging oil prices which helped Energy companies to outperform (see Exhibit 4).

As we approach the end of 2024, a new round of the presidential election is underway. Given the prevailing global and U.S. conditions, Chinese investors could still leverage U.S. sectors to convey their perspectives on the potential impacts of the election.

Overall, U.S. sectors represent significant market segments and could offer opportunities that Chinese investors may not want to overlook, whether for global equities exposure or tactical strategies. The upcoming presidential election further provides a platform for investors to express views on U.S. matters, adding an additional dimension to the strategic considerations for Chinese investors.

The posts on this blog are opinions, not advice. Please read our Disclaimers.

Navigating Private Credit Liquidity Challenges with Indices

What’s driving insurance companies’ increased allocation to private credit?  S&P Global Market Intelligence’s Lynn Bachstetter joins S&P DJI’s Frans Scheepers and State Street Global Advisors’ Bill Ahmuty to explore how indices like the iBoxx Liquid Leveraged Loan Index are helping insurers identify and navigate liquidity challenges in private credit markets.

The posts on this blog are opinions, not advice. Please read our Disclaimers.

Food Inflation Bites into Income as Commodities March Higher

Contributor Image
Brian Luke

Senior Director, Head of Commodities, Real & Digital Assets

S&P Dow Jones Indices

Inflation continues to impact consumers and policymakers in negative ways. Hedging through broad commodities has proven to buffer portfolio returns, with the S&P GSCI up 5.38% this year. Going into the year, expectations of Fed rate cuts and continued declines in the Consumer Price Index (CPI) pushed inflation concerns aside. Since then, markets have experienced increased inflation figures and downsized rate cut bets. Commodities make up over one-third of the CPI, providing a direct hedge against upside inflation surprises. Americans have been spending more on food as a percentage of disposable income since the 1980s. The USDA’s most recent report1 highlights that 11.3% of income is being spent on food. The Fed may overlook volatile food and energy, preferring to focus on the Personal Consumption Expenditures Index (PCE), but even the PCE has followed the traditional CPI levels in its trend higher. More importantly, the S&P GSCI has historically tended to outperform when inflation surprises to the upside.

Fueled by hedge fund speculation, cocoa prices surged over 32% during the month to an all-time high and futures markets reported USD 8.7 billion in speculative cocoa contracts. Political instability and declining crop yields in West Africa cast a similar picture last seen during the 2001 bull run-up in cocoa, the best year on record dating back to 1984. On the heels of a 61% return in 2023, cocoa is up an additional 51% in 2024, even outperforming the S&P Bitcoin Index, which is up a paltry 47.5%.


1 https://www.ers.usda.gov/data-products/ag-and-food-statistics-charting-the-essentials/food-prices-and-spending/?topicId=2b168260-a717-4708-a264-cb354e815c67

The posts on this blog are opinions, not advice. Please read our Disclaimers.

Building on Tradition: India’s Digital Reboot

Contributor Image
Vidushan Ragukaran

Director, Thematic Indices

S&P Dow Jones Indices

India’s synonymous relationship with excellence in the field of technology is well known. This includes a notable roster of Indian-origin CEOs at the helm of global technology companies such as Adobe, Alphabet, IBM and Microsoft.1 This leadership is not only seen in companies abroad but also within India’s own borders, building on its reputation as a worldwide hub for IT and software development outsourcing.

India’s IT spending is forecast to grow by 10.7% in 2024, reaching USD 124.6 billion, rebounding after a decline in 2023. This will be, in part, driven by artificial intelligence and automation aimed at improving operational efficiency and addressing IT talent shortages. Software and IT services spending in India is expected to see the highest growth rates in 2024, up by 18.5% and 14.6%, respectively.2 Some 92% of Forbes Global 2000 companies use IT outsourcing, suggesting continued demand for India’s IT services on a global scale.3 India retained the top spot in the 2023 Global Services Location Index rankings, an indicator of the country’s attractiveness for hosting offshore business services.4

However, India’s digital strategy transcends its established IT sector, focusing on a nationwide transformation into a digitally advanced society. India’s internet economy, valued at around USD 175 billion in 2022, is projected to experience significant growth, reaching USD 1 trillion by 2030.5 This shift is guided by the “Digital India” campaign, aiming to upgrade online infrastructure, expand connectivity and digitize public services for its citizens.6 Last year, India’s population—approximately 1.43 billion people at the end of April 2023—surpassed China and became the world’s most inhabited country.7

The “India Stack,” a comprehensive suite of Application Programming Interfaces (APIs), is also facilitating innovation in digital payments, identity verification and data/service delivery. With billions of mobile transactions monthly and some 67 billion digital identity verifications, supported by platforms like Aadhaar, UPI and DigiLocker, India is marking its position as a global champion in open API technology.8

These technologies have been critical in supporting India’s push toward digitalization across various sectors, not just IT and software. For instance, they have allowed financial services to innovate with digital wallets and online transactions, healthcare services to improve with digital records and telemedicine, and educational services to expand through online platforms and digital content.

Launched last year, the S&P India Tech Index serves as a barometer of the performance of India-based companies engaged in digital technology, software and communications. The index uses FactSet’s RBICS revenue data to identify companies across selected activities that are integral to the digital economy. This approach captures not only standard IT functions such as enterprise software and consulting, but also extends to specialist operations like data centers, financial software and electronic payment services, offering a comprehensive view of companies driving the digital ecosystem. By applying a strict 90% revenue threshold for eligibility, it also ensures that only companies with a substantial digital footprint are included.

As Exhibit 1 highlights, the index brings together conventional IT companies with names from the Communication Services, Financials, Consumer Discretionary and Industrials sectors. The combination of India’s youthful, tech-savvy demographic—almost two-thirds of the population is under the age of 35—and a rising middle class is a powerful catalyst for the surging demand for and increasing spend on digital services across the country.9

Exhibit 2 shows that fintech, consumer-tech and other technology-led startups that span multiple sectors have secured more funding in India than traditional enterprise software-as-a-service (SaaS) businesses in recent years.10

India’s tech narrative goes well beyond its traditional IT expertise. To accurately measure the evolving Indian technology landscape through indices, a nuanced approach is necessary—one that acknowledges the broader, more inclusive definition of what constitutes a technology company today and looks ahead longer term.


1 The Economic Times (2023). 21 Indian-origin CEOs of billion dollar companies. Available at: https://economictimes.indiatimes.com/nri/work/sundar-pichai-satya-nadella-ajay-banga-arvind-krishna-and-20-other-indian-origin-ceos-of-billion-dollar-companies/sundar-pichai/slideshow/105593531.cms

2 Gartner (2023). Gartner Forecasts India IT Spending to Grow 11% in 2024. Available at: https://www.gartner.com/en/newsroom/press-releases/2023-11-28-gartner-forecasts-india-it-spending-to-grow-11-percent-in-2024

3 ISG (2019). 2019 ISG Momentum® Market Trends & Insights Geography Report. Available at: https://ei.isg-one.com/Research/GoToDocument?dashboardID=201a11ca-c115-4a33-a9f7-941eceefbbd1&code=2019-Momentum-Geography-Report&isLocked=True

4 Kearney (2023). The 2023 Kearney Global Services Location Index: Regenerative talent pools. Available at: https://www.kearney.com/service/digital-analytics/digital/gsli/2023-full-report

5 Google, Temasek and Bain & Company (2023). The e-Conomy of a Billion Connected Indians. Available at: https://www.bain.com/insights/e-conomy-india-2023/

6 India Brand Equity Foundation (2024). Digital India. Available at: https://www.ibef.org/government-schemes/digital-india

7 United Nations (2023). Department of Economic and Social Affairs Economic Analysis. UN DESA Policy Brief No. 153: India overtakes China as the world’s most populous country. Available at: https://www.un.org/development/desa/dpad/publication/un-desa-policy-brief-no-153-india-overtakes-china-as-the-worlds-most-populous-country/

8 IndiaStack (2024). Available at: https://indiastack.org/index.html

9 World Economic Forum (2019). This is how India can become the next Silicon Valley. Available at: https://www.weforum.org/agenda/2019/10/india-technology-development-silicon-valley/

10 S&P Global (2023). Startups Riding Digital Infrastructure Could Transform Indian Economy. Available at: https://www.spglobal.com/en/research-insights/featured/special-editorial/look-forward/startups-riding-digital-infrastructure-could-transform-indian-economy

The posts on this blog are opinions, not advice. Please read our Disclaimers.