
How does screening the S&P 600 for the top 100 companies based on free cash flow yield influence performance? S&P DJI’s Michael Mell takes a custom look at the Pacer US Small Cap Cash Cows Index with Sean O’Hara, President of Pacer ETFs and Cameron Dawson, Chief Investment Officer at NewEdge Wealth.
The posts on this blog are opinions, not advice. Please read our Disclaimers.
Examining Cash Flow in Small-Cap U.S. Equities
The Relative Value of Insights
Getting to Know the SPIVA After-Tax Scorecard
Twenty-First Century Fox: DJCI Gold Tops Stocks and Bonds This Century
Looking into the Future of Dividend Growth: The S&P 500 High Dividend Growth Index
Examining Cash Flow in Small-Cap U.S. Equities
The Relative Value of Insights

Many investors use the start of the year to make predictions for the upcoming year and to think about ways to express views on these themes. This undertaking is not guaranteed to add value: predicting the future is incredibly difficult and success requires correctly predicting both the drivers of future performance and the upcoming impact of different market segments. The countless possible scenarios mean that is it easy to be wrong-footed.
Nonetheless, the inherent challenge of forecasting means that investors may wish to focus their attention on market segments where there is greater reward for correct insight. Dispersion provides an initial assessment of the potential reward for such insight. The greater the dispersion, the greater the potential rewards for correctly picking the best-performing constituents in that market.
Exhibit 1 shows average monthly dispersion figures for various segments over the 15-year period ending December 2023. The dispersion figures are calculated for different levels of granularity, including stocks, sectors, countries, U.S. styles and U.S. size segments. S&P SmallCap 600® stock dispersion was the highest, on average, more than three times higher than the average dispersion among S&P 500® sectors. Lower levels of dispersion were observed between U.S. size or style segments, or between countries or sectors in the S&P Developed Ex.-U.S. BMI.
So does this mean that investors would be well served to focus their attention on research into small-cap U.S. equities instead of other areas? Not necessarily: the relative value of insight also depends on the potential size of the positions that investors may be able to take in different segments.

An investor’s ability to take active positions is related to the average market capitalization of constituents. For example, there is more capacity to take an active position in a trillion-dollar constituent compared to a smaller constituent. Exhibit 2 plots the average dispersion figures from Exhibit 1 against the index-weighted average constituent size of the different segments over the same 15-year period (note the log scale on the y axis).
Clearly, there has been a trade-off between dispersion and the average constituent size. Higher dispersion segments, which offer greater expected reward for correct insight, may require smaller positions compared to lower dispersion segments with larger constituents.

Capacity-Adjusted Dispersion provides a way to account for capacity when considering the potential value of insight. It is calculated by multiplying the potential reward to correct selections (dispersion) and potential size of active positions (average constituent size). Exhibit 3 shows the average ratio of capacity-adjusted dispersion measures for different segments compared to that of S&P 500 stocks, based on monthly data over the 15-year period ending December 2023.
Assuming that an investor’s predictions are similarly valuable across each segment, Exhibit 3 suggests that selecting among the S&P Composite 1500® size segments—the S&P 500, S&P MidCap 400®, and S&P SmallCap 600—may offer more than nine times the potential opportunity compared to picking S&P 500 stocks. Similarly, choosing between the S&P 500 Growth and S&P 500 Value or selecting among S&P 500 sectors could have provided similar opportunities as picking country components of the S&P Emerging BMI or S&P Developed Ex-U.S. BMI.
Such is the difference in average constituent size that insights into S&P SmallCap 600 stocks would have to be 50 times more valuable than insights into S&P 500 stocks to provide the same capacity-adjusted opportunity.

As a result, expressing views through a U.S. size, style and sector lens could present similar opportunities as using a country lens. The relative capacity of these segments means they may offer greater opportunities than many other segments.
The posts on this blog are opinions, not advice. Please read our Disclaimers.
Getting to Know the SPIVA After-Tax Scorecard
What do the SPIVA Scorecard results look like once you factor in taxes? Join S&P DJI’s Anu Ganti and Joseph Nelesen for a deep dive into key findings from the inaugural SPIVA After-Tax Scorecard.
The posts on this blog are opinions, not advice. Please read our Disclaimers.Twenty-First Century Fox: DJCI Gold Tops Stocks and Bonds This Century

The equity markets roared to the finish line, easily passing commodities and bonds with a 26.3% return for the S&P 500® in 2023. Much of that rally could be attributed to declining consumer price indices and favorable Federal Reserve guidance, with increased confidence in a soft landing. Declining inflation can best be observed at the kitchen table, where the S&P GSCI Grains saw 15% declines on the year and the S&P GSCI Livestock remained flat.
Despite another strong year of equity performance, the Dow Jones Commodity Index (DJCI) Gold maintained its top perch for this century after reaching an all-time high in December. Gold achieved a 12.8% return, outpacing both bonds and broad commodities, with the S&P GSCI recording a -4.3% annual return. Going back to the start of the century, the DJCI Gold produced a 7.8% annual return, compared to a 7% return for the S&P 500 during that time. Adjusting for volatility, gold has demonstrated better risk-adjusted returns than stocks, with a Sharpe ratio of 0.48 versus 0.45 for equities.

Central banks appear to have taken notice in the outperformance of gold. After trading flat for much of the year, the S&P GSCI Gold and S&P GSCI Silver staged a fourth quarter rally, rising 11.4% and 7.2%, respectively. Global central banks supported gold demand, adding over 800 metric tons to their portfolios with data through October. Gold has historically provided investors an alternative to fiat currency. Digging into the central bank purchase data, countries including Russia and China have led the increase in central bank holdings. Foreign central banks appear to increasingly value gold’s hedge against inflation, debt default and dollarization.
Commodity Market Recap
Energy weighed down commodity performance in 2023, with the S&P GSCI Natural Gas falling 62.6%. The decline reflects a return to the longer-term price levels observed during the past decade, as well as robust production along with reduced export demand of liquefied natural gas. The broader petroleum complex was mixed, as lower oil didn’t translate to falling gas prices. The S&P GSCI Energy dropped 5.2% for the year, while the S&P GSCI Unleaded Gasoline rose 5.0%.
The posts on this blog are opinions, not advice. Please read our Disclaimers.Looking into the Future of Dividend Growth: The S&P 500 High Dividend Growth Index

Wenli Bill Hao
Director, Factors and Dividends Indices, Product Management and Development
S&P Dow Jones Indices
As the leading dividend index provider, S&P DJI is constantly looking for new approaches and methodologies to bring novel ideas to the market. Our recently launched S&P 500® High Dividend Growth Index is a prime example of this innovative thinking, as it incorporates a forward-looking assessment into its methodology. This index tracks companies in the S&P 500 that have not only offered consistent or growing dividends in the past but also have the highest forecast dividend yield growth. In doing so, constituents are selected based on what dividend they are expected to pay instead of being assessed solely on what they have paid in the past.
In this blog, we will present the index methodology, introduce the S&P Global Dividend Forecasting Dataset and review the index’s risk/performance profile.
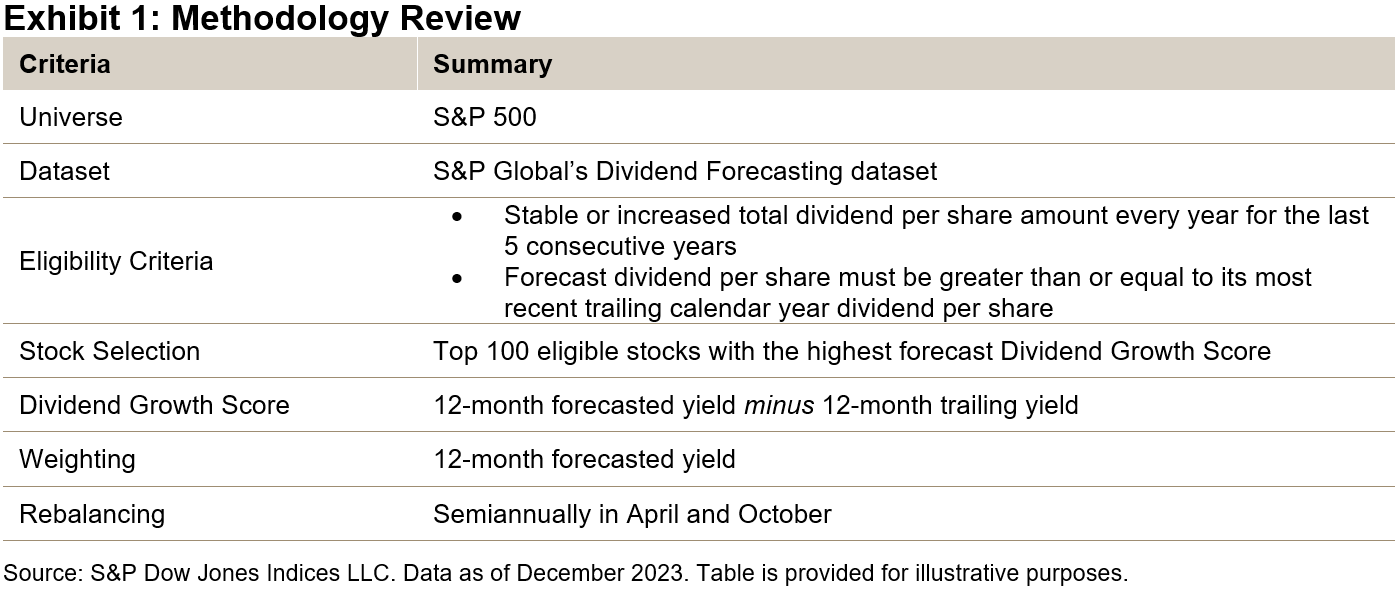
Methodology Overview
To be eligible for selection, constituents must have maintained or grown their historic dividends for 5 consecutive years and must also be projected to do so over the next 12 months.
From this pool of eligible stocks, the top 100 constituents with the highest forecast dividend growth scores are selected. The score is computed as the 12-month forecast yield minus the 12-month historical yield.
Finally, the index constituents are weighted by forecast dividend yield with constraints placed on individual stocks and GICS® sectors.1 To reduce turnover, the index uses a 20% buffer.
Dividend Forecasting Data
The Dividend Forecast Dataset is sourced from S&P Global Market Intelligence, which is another division within S&P Global. This team has more than 40 professionals performing fundamental analysis with the goal of delivering precise forecasts of the size and timing of dividend payments. They serve over 150 customers across the world, including most of the top-tier global banks.2
Performance Review
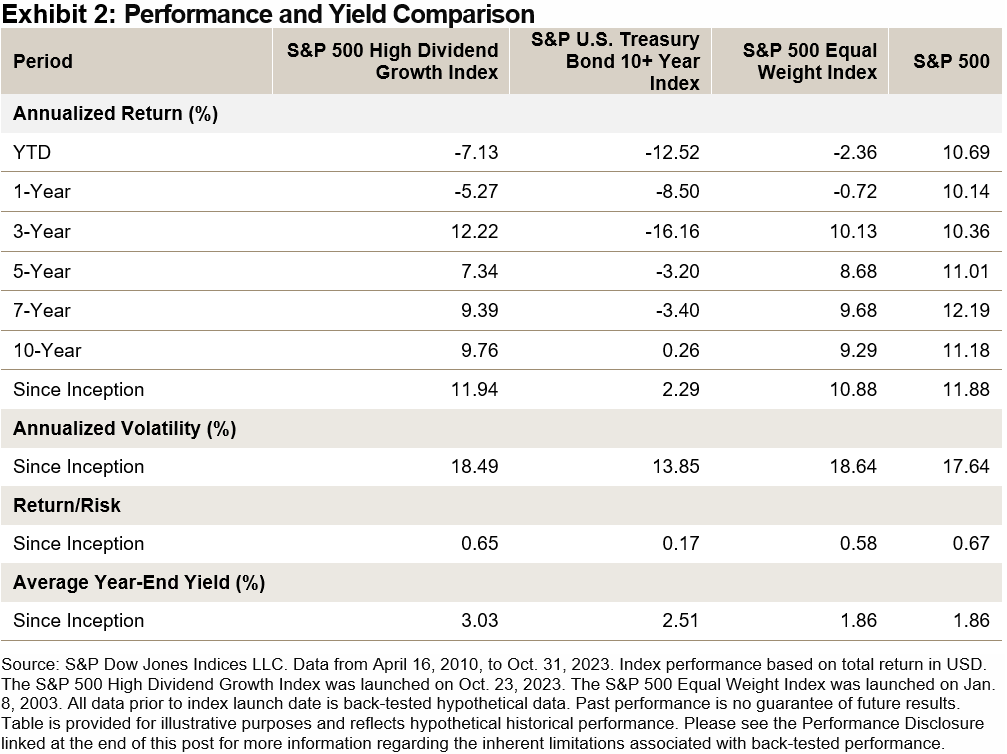
The performance statistics that follow are calculated starting in 2010, when the data for the dividend forecasting dataset began. Hence, the back-tested data incorporates forecasts that were stored as and when they were made, with no look-ahead bias.
While this period has been a strong performance period for the S&P 500, the S&P 500 High Dividend Growth Index has more than kept pace. Since 2010, it has had an annualized return of 11.94% while delivering a significantly higher yield.
Downside Protection and Upside Participation
The historical capture ratios versus the S&P 500 show that the S&P 500 High Dividend Growth Index has exhibited moderately defensive characteristics (94.5% downside capture). Moreover, on average, the index has historically participated in 96% of the market return in up-market periods.3 This is higher than most dividend strategies and is likely a result of its relatively lower value tilt and higher growth tilt.
Historical Yield and Dividend Growth Analysis
This innovative methodology offers a unique blend of dividend growth and high yield. Since 2010, the index has had an average yield of over 3%, comfortably outperforming its benchmark and other strategies within the dividend growth category.
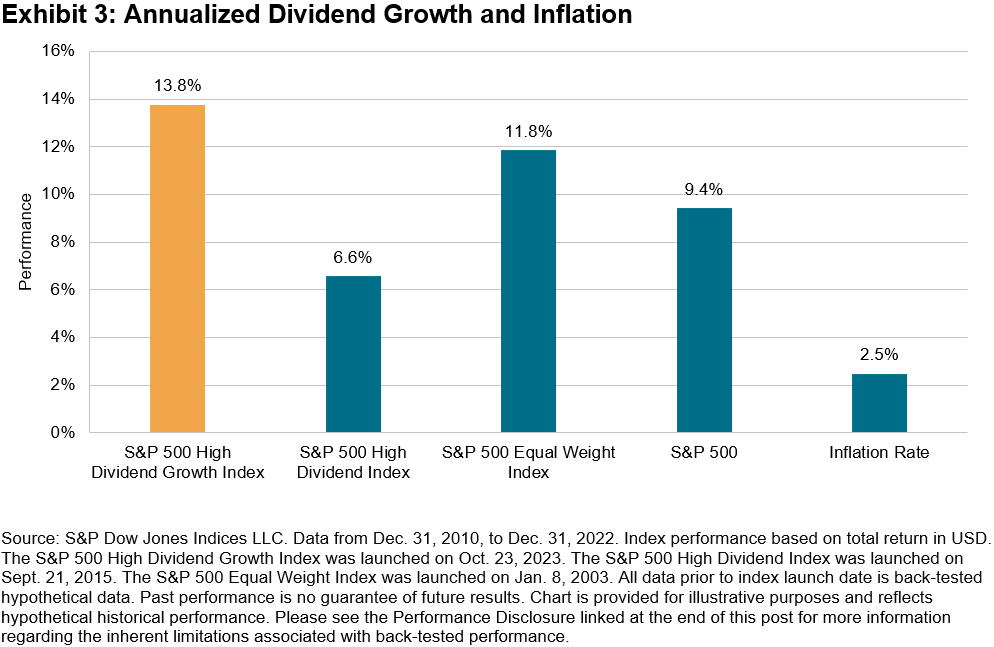
Impressively, for a dividend strategy offering a high yield, the index also has a high annualized dividend growth rate. From 2010 to 2022, the S&P 500 High Dividend Growth Index grew its dividend at an annual rate of 13.8% (see Exhibit 3). This outpaces the long-term U.S. inflation rate, even with the recent spike in inflation over the last few years.
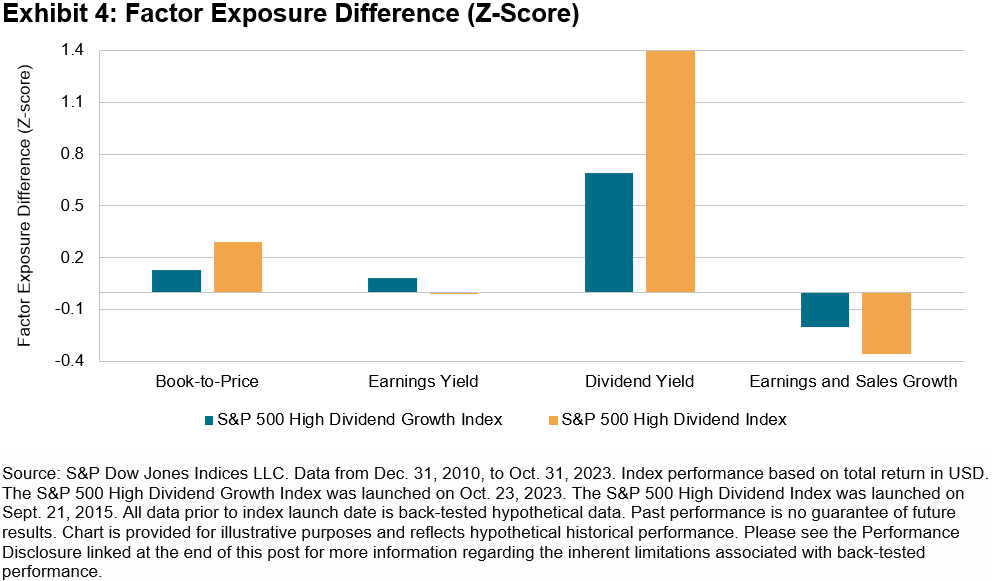
Factor Exposure
Exhibit 4 shows the factor exposure difference between the S&P 500 High Dividend Growth Index and S&P 500 High Dividend Index in terms of Axioma Risk Model Factor Z-scores. The S&P 500 High Dividend Growth Index demonstrated less value tilt and had lower dividend yield than the S&P 500 High Dividend Index.
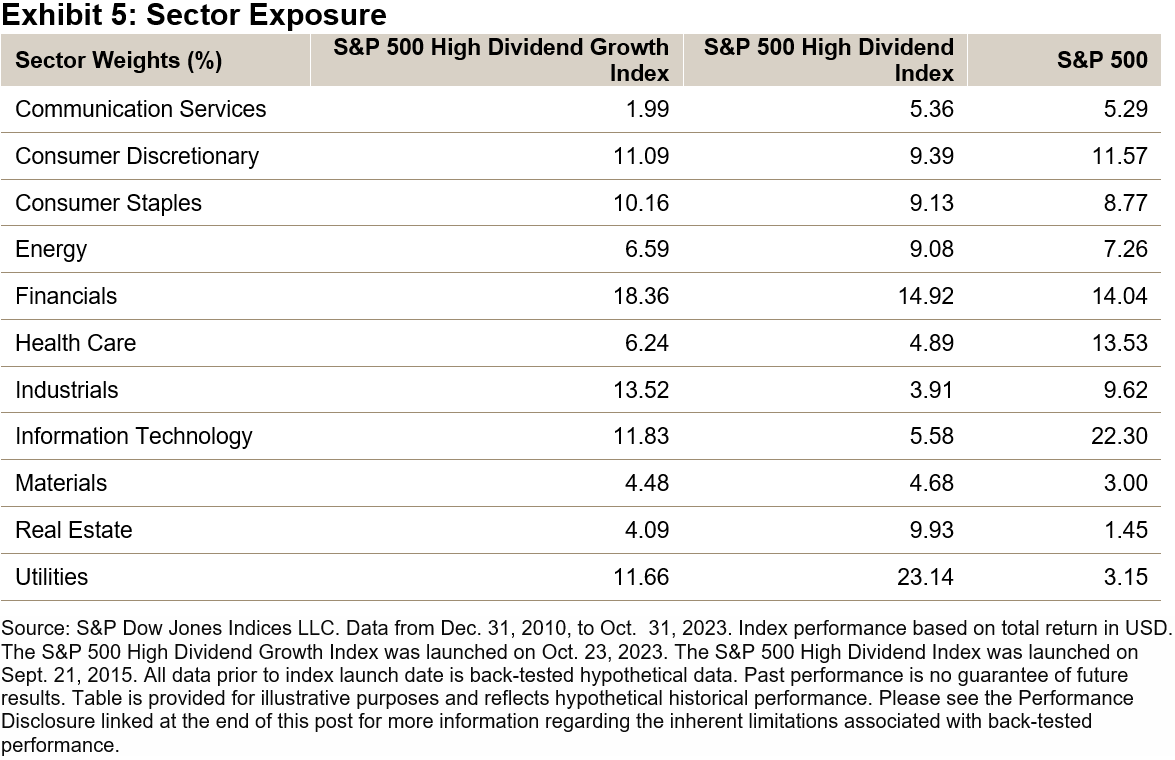
Sector Exposure
From a sector perspective, the S&P 500 High Dividend Growth Index had lower sector weights in Utilities (-11.5%) and Real Estate (-5.8%), while having higher sector weights in Industrials (9.6%) and Information Technology (6.3%) than the S&P 500 High Dividend Index (see Exhibit 5).
In a market full of passive dividend solutions, the S&P 500 High Dividend Growth Index stands out by utilizing a forward-looking approach while historically offering high dividend growth and high yield. This index’s historical lower value tilt and higher growth tilt may help to avoid sacrificing potential upside when seeking high yield.
1 For further information about the index design, please see the S&P 500 High Dividend Growth Index Methodology.
2 For more information, please see this link.
3 The market is defined as the monthly performance of S&P 500 benchmarks from April 16, 2010, to Oct. 31, 2023.
The posts on this blog are opinions, not advice. Please read our Disclaimers.