Clean energy has certainly been a prominent topic in 2023, especially among those at the front and center of discussions at the United Nations Climate Change Conference (COP28) in Dubai, which just concluded. As we are approaching the end of 2023, we wanted to review the results of the S&P Global Clean Energy Index Series rebalance from October and share some of the key developments from the second half of the year in the clean energy space.
October Rebalance
Launched in 2007, the S&P Global Clean Energy Index has been a benchmark to measure clean energy-related companies’ performance over the past 16 years. In April 2021, we also launched the S&P Global Clean Energy Select Index, which is designed to measure the 30 largest companies in global clean energy businesses that are listed on developed market exchanges.
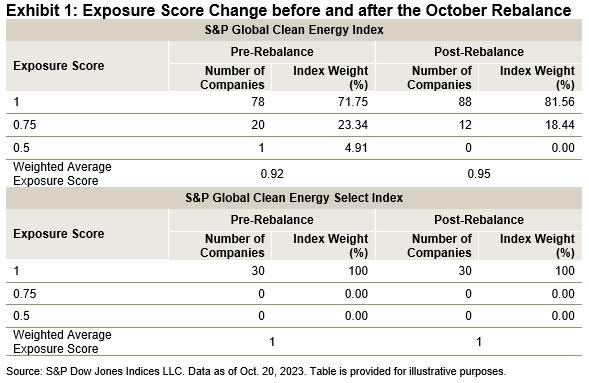
Both the S&P Global Clean Energy Index and the S&P Global Clean Energy Select Index went through a semiannual rebalance on Oct. 20, 2023. In the index methodology, we assign companies to four buckets of exposure scores from 0 to 1 with an increment of 0.25 to measure their purity of exposure to the clean energy business. Exhibit 1 shows the change in exposure before and after the October rebalance. We can see that for the S&P Global Clean Energy Index, post rebalancing, we have 10 more companies with an exposure score of 1 being added to the index. The weighted average exposure score of the index improved from 0.92 to 0.95. This shows the effect of rebalancing to improve the purity of index exposure to clean energy companies. The S&P Global Clean Energy Select Index, on the other hand, selects 30 companies with an exposure score of 1 listed in the developed market exchanges.
On the market allocation breakdown, the major change of the S&P Global Clean Energy Index post rebalancing is the 3.11% weight increase in India and 2.72% weight increase in China, together with a 5.01% weight decrease in Spain. For the S&P Global Clean Energy Select Index, the weight of the U.S. increased by 11.86%, with a drop of 6.19% in New Zealand and a drop of 5.41% in Brazil.
S&P Global Clean Energy Index Performance YTD in 2023
After outperforming the S&P Global BMI in 2022, both the S&P Global Clean Energy Index and the S&P Global Clean Energy Select Index underperformed YTD through the end of November 2023. The S&P Global Clean Energy Select Index was down 21.49% and the S&P Global Clean Energy Index was down 27.88% in USD total return terms. There was significant dispersion seen among constituents; some of the performance laggers included Sunpower Corp (-76.98%), SolarEdge Technologies (-71.98%) and Plug Power (-67.34%), while Chubu Electric Power (up 38.24%), VERBUND AG (up 16.54%) and First Solar (up 5.33%) made up for some of the loss with positive performance contributions.
Despite the performance headwind, we continue to see encouraging discussions around the world on the energy transition, including the following selected highlights.
Key Developments
The International Energy Agency (IEA) Released the World Energy Outlook 2023
In October, the IEA released the World Energy Outlook 2023, in which it says that the use of fossil fuels is not declining quickly enough, but the move to renewable energy is “unstoppable”.1 According to the report, “Tripling renewable energy capacity, doubling the pace of energy efficiency improvements to 4% per year, ramping up electrification and slashing methane emissions from fossil fuel operations together provide more than 80% of the emissions reductions needed by 2030 to put the energy sector on a pathway to limit warming to 1.5 °C.”2
Global Pledge on Renewables and Energy Efficiency
At COP28, the Global Pledge on Renewables and Energy Efficiency was signed by 121 countries.3 Among other objectives, those who sign the pledge commit to “work together to triple the world’s installed renewable energy generation capacity to at least 11,000 GW by 2030, taking into consideration different starting points and national circumstances.”4
COP 28 Concluded with a Deal to Transition away from All Fossil Fuels
After many nights of discussion, almost 200 countries reached a deal to transition away from all fossil fuels. This first-ever agreement once again enforces the global commitment to net zero emissions by 2050. Although the deal is not legally binding, the message is loud and clear. It is now on each country to set up its own agenda in order to phase out fossil fuels “in a just, orderly and equitable manner.”5
1 https://www.bbc.com/news/science-environment-67198206
2 IEA (2023), World Energy Outlook 2023, IEA, Paris. https://www.iea.org/reports/world-energy-outlook-2023
4 https://energy.ec.europa.eu/system/files/2023-12/Global_Renewables_and_Energy_Efficiency_Pledge.pdf
The posts on this blog are opinions, not advice. Please read our Disclaimers.