
What’s driving interest in thematics and how can indices help investors target world-shaping structural trends? Join S&P DJI’s Jason Ye for a closer look at how innovative benchmarks, including the S&P Kensho New Economy Indices, are tracking long-term, market-altering themes by design.
The posts on this blog are opinions, not advice. Please read our Disclaimers.
Tracking Thematics: How Indexing Megatrends Works
Who’s Naughty and Nice
Gold Hits All-Time Highs and DJCI Silver Tops 10% in November
What Do Insurance Companies Need to Know About SPIVA?
The Gold Standard of Indices Meet's Today's Technology
Tracking Thematics: How Indexing Megatrends Works
- Categories Thematics
- Tags 4th industrial revolution, changing demographics, clean energy, Climate Transition, disruptive technology, Electric Vehicles, ESG, health care, Jason Ye, machine learning, megatrends, natural language processing, robotics, S&P Kensho New Economies, sustainability, thematics
Who’s Naughty and Nice

- Categories Equities
- Tags 2023, Benedek Voros, equity performance, global equities, IIS, institutional investor, S&P 400, S&P 500, S&P 600, S&P BSE SENSEX, S&P Europe 350, S&P France BMI, S&P Germany BMI, S&P Italy BMI, S&P TOPIX 150, S&P TSX 60, S&P United Kingdom, S&P/HKEex LargeCap, Santa Claus Rally
At this time of year, my 9 year old excitedly polishes his boots so that, according to Hungarian tradition, Santa can fill them with sweets and toys during the night between December 5 and 6 (yes, he does arrive a few weeks early in Central Europe). Just like in years past, I am sure he won’t be disappointed. But will Old Saint Nick have any goodies for equity investors too?
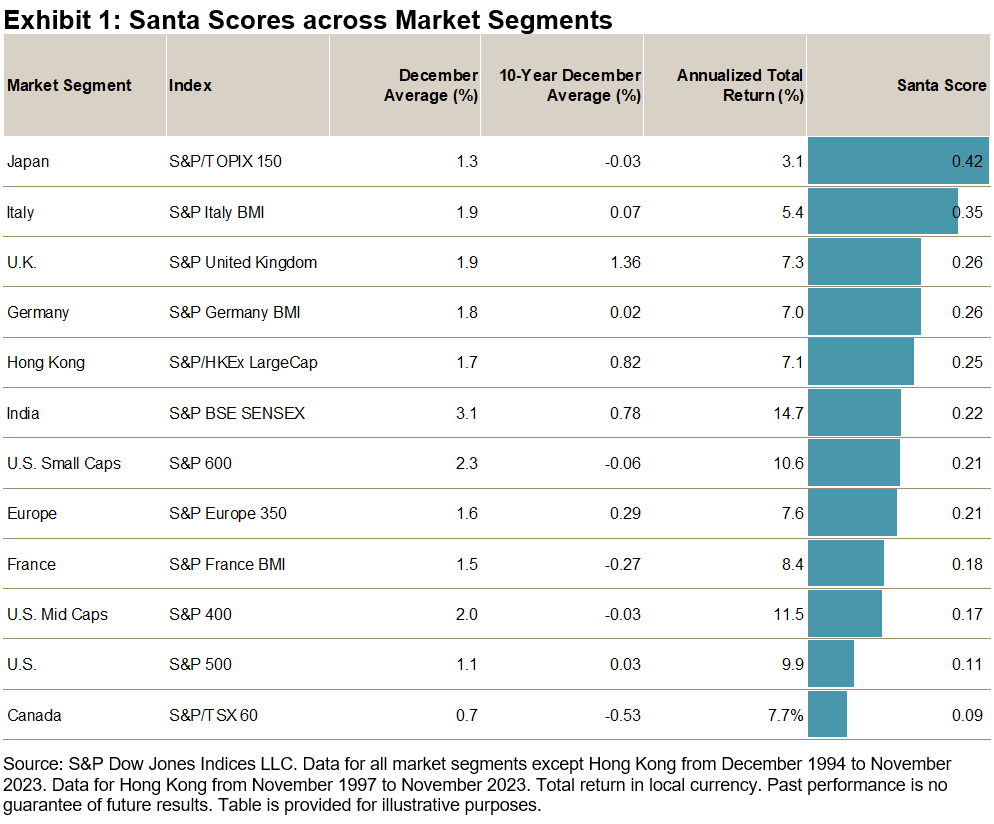
History suggests that there is at least some evidence supporting the idea of a “Santa Claus Rally.” We call our light-hearted measurement of choice the “Santa Score,” which we define as the ratio of a market’s average performance in the month of December to its total return in the corresponding year. Since there are 12 months in the year, a Santa Score of one-twelfth (around 0.08) would indicate that December had an average impact on the year’s total return. A Santa Score above 0.08 indicates that December was a better month for stocks, on average, than the other 11 months of the year.
As it turns out, all 12 market segments that we selected for our analysis fared well on the test. The Santa Score’s cross-market average of 0.23 indicates that since 1994, December, on average, has been about three times more profitable than other months. Having said that, there have been significant differences across various regions: Japanese investors usually had a happy and profitable December, with the last month of the year producing, on average, five times the return of the average month; meanwhile in Canada, December returns have tended to be only slightly above average. It is also notable that Santa was somewhat stingier in the past decade than in the previous two: the December average return in the last 10 years was significantly lower than in the prior 18 years, with 3 out of 12 market segments surveyed delivering an outright negative average return in the Decembers between 2013 and 2022.
Santa is known to reward nice children with candies but to leave coal for the naughty. Does he do something similar for equity markets? As Exhibit 2 shows, he does indeed. Historically, the average equity performance during December tends to be much better when the previous 11 months’ return was positive (“nice”) than when it was negative (“naughty”), with the spread widest in Canada, at 5.2%. The only exception is U.S. small caps, which tends to benefit from a January effect instead.
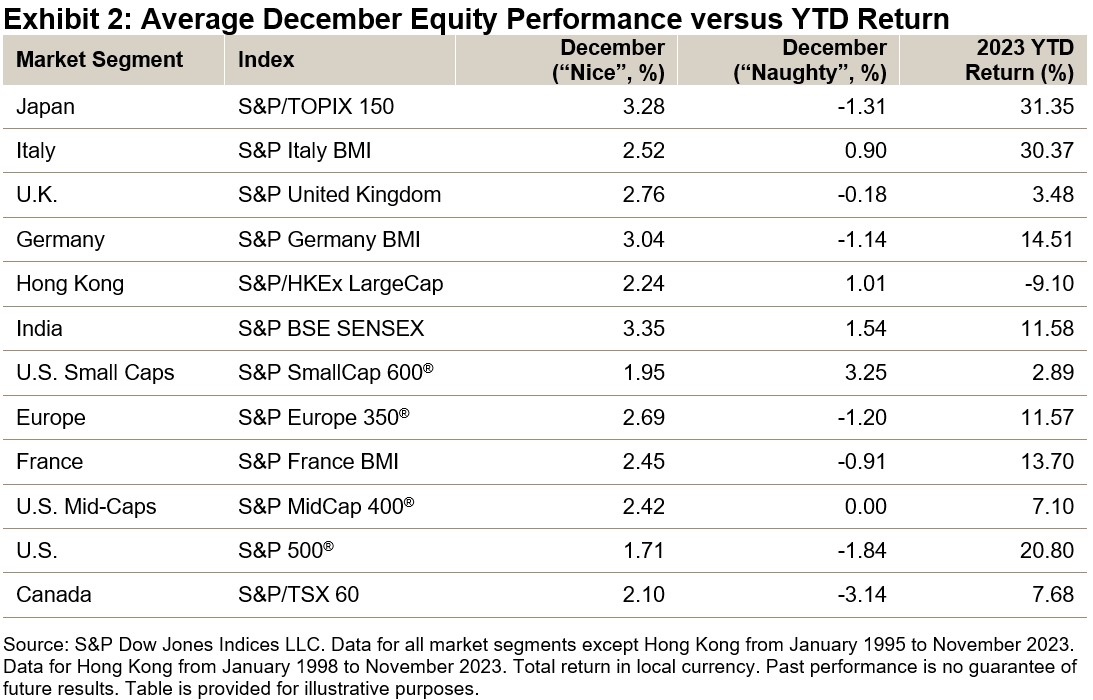
Looking at YTD returns, the good news is that all market segments besides Hong Kong have been nice so far in 2023—let’s hope Santa takes notice. But regardless of where markets head in the next few weeks: Happy holidays and a prosperous New Year to all!
The posts on this blog are opinions, not advice. Please read our Disclaimers.Gold Hits All-Time Highs and DJCI Silver Tops 10% in November

“Silver and gold, silver and gold,
Everyone wishes for silver and gold.”
-Burl Ives
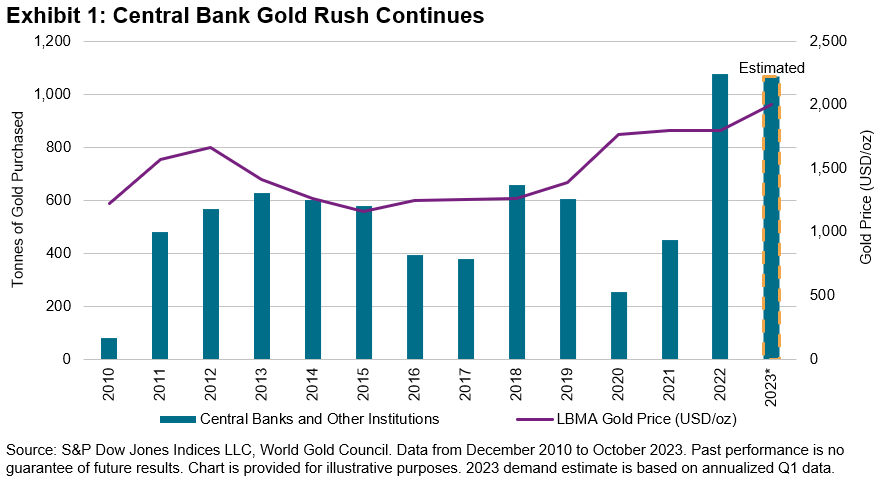
My all-time favorite stop-motion animation show was the 1964 TV special Rudolph the Red-Nosed Reindeer, narrated by Burl Ives. Playing the role of Sam the Snowman, Ives sang “Silver and Gold,” paying tribute to the work of Yukon Cornelius, a prospector mining near Santa’s workshop. Those tracking the Dow Jones Commodity Index Silver struck it rich, as the index posted a 10.6% gain in November. The Dow Jones Commodity Index Gold, not to be outdone, hit an all-time high before settling down on thin volumes. Central banks continued to add 800 tons of gold to their portfolio in the first three quarters of the year, led by the People’s Bank of China. Purchases thus far drove gold to an all-time high, as inflation wreaks havoc on fiat currencies. Following a year of record gold purchases, central banks are on pace to nearly match 2022 levels. Investors appear to be fighting the U.S. Fed, however, as net redemptions in physical gold ETFs have seen USD 12 billion in outflows YTD.
Beyond precious metals, renewed optimism of a rebounding Chinese economy led industrial metals to a strong monthly performance. Industrial metals, including the S&P GSCI Lead, S&P GSCI Zinc and S&P GSCI Copper, gained 2%, 3% and 4%, respectively.
While “silver bells” rang up 10% returns, cocoa and coffee registered 12% and 13%, respectively, with the S&P GSCI Coffee hitting double-digit returns for the second consecutive month. Reduced production due to heavy rainfall in the Ivory Coast boosted the S&P GSCI Cocoa to 72% YTD; combined with the S&P GSCI Sugar, which was up over 50% YTD, the two will surely sweeten the holiday season. Just don’t overdo it, else Yukon Cornelius will have to bring you to the dentist to pull out that sweet tooth.
The posts on this blog are opinions, not advice. Please read our Disclaimers.What Do Insurance Companies Need to Know About SPIVA?
How and when are insurers implementing index-based strategies as they seek liquidity, diversification, and risk mitigation? S&P DJI’s Raghu Ramachandran and Anu Ganti join BlackRock’s Andrew Masalin to discuss what’s driving passive outperformance and the use of ETFs by insurers through the lens of SPIVA.
The posts on this blog are opinions, not advice. Please read our Disclaimers.The Gold Standard of Indices Meet's Today's Technology
Meet the S&P 500 FC Index, an innovative index designed to adjust allocations based on intraday volatility signals as it seeks to increase stability, limit exposure to drawdowns, while optimizing exposure to the S&P 500 via BofA’s Fast Convergence technology.
The posts on this blog are opinions, not advice. Please read our Disclaimers.