Get Indexology® Blog updates via email.

In This List

Gold Hits All-Time Highs and DJCI Silver Tops 10% in November

What Do Insurance Companies Need to Know About SPIVA?

The Gold Standard of Indices Meet's Today's Technology

Finding Fee Savings in Fixed Income

The November 2023 Rebalance of the S&P 500 Low Volatility Index

Gold Hits All-Time Highs and DJCI Silver Tops 10% in November

Contributor Image
Brian Luke

Senior Director, Head of Commodities, Real & Digital Assets

S&P Dow Jones Indices

“Silver and gold, silver and gold,
Everyone wishes for silver and gold.”

-Burl Ives

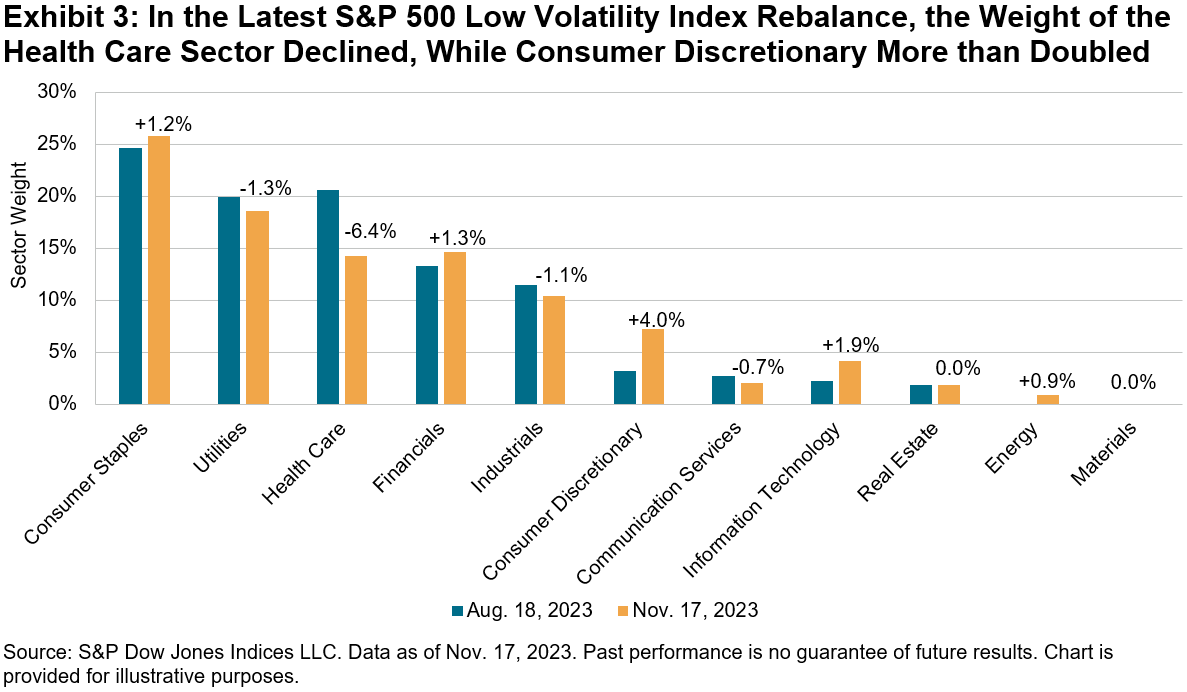
My all-time favorite stop-motion animation show was the 1964 TV special Rudolph the Red-Nosed Reindeer, narrated by Burl Ives. Playing the role of Sam the Snowman, Ives sang “Silver and Gold,” paying tribute to the work of Yukon Cornelius, a prospector mining near Santa’s workshop. Those tracking the Dow Jones Commodity Index Silver struck it rich, as the index posted a 10.6% gain in November. The Dow Jones Commodity Index Gold, not to be outdone, hit an all-time high before settling down on thin volumes. Central banks continued to add 800 tons of gold to their portfolio in the first three quarters of the year, led by the People’s Bank of China. Purchases thus far drove gold to an all-time high, as inflation wreaks havoc on fiat currencies. Following a year of record gold purchases, central banks are on pace to nearly match 2022 levels. Investors appear to be fighting the U.S. Fed, however, as net redemptions in physical gold ETFs have seen USD 12 billion in outflows YTD.

Beyond precious metals, renewed optimism of a rebounding Chinese economy led industrial metals to a strong monthly performance. Industrial metals, including the S&P GSCI Lead, S&P GSCI Zinc and S&P GSCI Copper, gained 2%, 3% and 4%, respectively.

While “silver bells” rang up 10% returns, cocoa and coffee registered 12% and 13%, respectively, with the S&P GSCI Coffee hitting double-digit returns for the second consecutive month. Reduced production due to heavy rainfall in the Ivory Coast boosted the S&P GSCI Cocoa to 72% YTD; combined with the S&P GSCI Sugar, which was up over 50% YTD, the two will surely sweeten the holiday season. Just don’t overdo it, else Yukon Cornelius will have to bring you to the dentist to pull out that sweet tooth.

The posts on this blog are opinions, not advice. Please read our Disclaimers.

What Do Insurance Companies Need to Know About SPIVA?

How and when are insurers implementing index-based strategies as they seek liquidity, diversification, and risk mitigation? S&P DJI’s Raghu Ramachandran and Anu Ganti join BlackRock’s Andrew Masalin to discuss what’s driving passive outperformance and the use of ETFs by insurers through the lens of SPIVA.

The posts on this blog are opinions, not advice. Please read our Disclaimers.

The Gold Standard of Indices Meet's Today's Technology

Meet the S&P 500 FC Index, an innovative index designed to adjust allocations based on intraday volatility signals as it seeks to increase stability, limit exposure to drawdowns, while optimizing exposure to the S&P 500 via BofA’s Fast Convergence technology.

The posts on this blog are opinions, not advice. Please read our Disclaimers.

Finding Fee Savings in Fixed Income

Contributor Image
Anu Ganti

U.S. Head of Index Investment Strategy

S&P Dow Jones Indices

One of the benefits of indexing is its low cost relative to active management. As indexing has grown, investors have benefited substantially by saving on fees and avoiding active underperformance. These benefits are not limited just to equities but have also extended to other asset classes including the fixed income space, where fees can play a particularly pivotal role.

In Exhibit 1, we see that index bond fund expenses in the U.S. and Europe have been consistently lower than their active counterparts for the past decade. While that spread has narrowed in recent years, we still observe a fee differential of 39 bps in the U.S. and 55 bps in Europe as of 2022.

Using the same average fee differentials between active and passive fixed income funds in the U.S. and Europe, as applied regionally to approximately USD 102 billion of assets invested in mutual funds and ETFs tracking iBoxx corporate bond indices in both regions, we can estimate a current run rate of equal to at least USD 465 million per year in fee savings made by passive investors thanks in part to the iBoxx series (see Exhibit 2).

Of course, this USD 465 million estimate understates the full cost savings of the fixed income index industry, since it encompasses funds tracking only select indices from S&P Dow Jones Indices in the U.S. and Europe.

Our Annual Survey of Indexed Assets shows global assets tracking our iBoxx Corporate indices were USD 121 billion as of December 2022 (this also includes institutional segregated mandates, as well as assets outside the U.S. and Europe). To provide context on the size of the passive market in fixed income, this number makes up only 1% of the global total of USD 11.5 trillion in assets of all open-end bond funds1 and only around 0.5% of global rated corporate debt outstanding.2 In other words, there is plenty of headroom for future passive growth in fixed income, and the prospects for greater fee savings are promising.

Obviously, the savings generated by the shift from active to passive management would be of no consolation if investors lost more in performance shortfalls than they gained in reduced fees. As readers of our SPIVA® reports may know, in the 15 years ending in June 2023, 94% of all actively managed General Investment Grade bond funds lagged the iBoxx $ Liquid Investment Grade Index. High Yield results were almost equally disappointing. As indexing in fixed income has gained momentum, bond market participants have benefited from fee savings and avoidance of active underperformance, a powerful combination.

1 2023 Investment Company Fact Book, Investment Company Institute. Regulated open-end funds include mutual funds, exchange-traded funds (ETFs) and institutional funds.

2 Credit Trends: Global State of Play: Debt Growth Diverging by Credit Quality. Level of global rated corporate debt reached USD 23.2 trillion as of July 1, 2023.

The posts on this blog are opinions, not advice. Please read our Disclaimers.

The November 2023 Rebalance of the S&P 500 Low Volatility Index

Contributor Image
George Valantasis

Associate Director, Factors and Dividends

S&P Dow Jones Indices

The S&P 500® continued its strong performance this year after posting a 9.8% gain in a span of less than three weeks from Oct. 30 to Nov. 17, 2023. During this period, the 10-year U.S. Treasury yield dropped approximately 45 bps1 and October’s year-over-year headline CPI inflation cooled to 3.2%.2 As Exhibit 1 shows, since the previous rebalance for the S&P 500 Low Volatility Index on Aug. 18, 2023, through the most recent rebalance on Nov. 17, 2023, the S&P 500 was up 3.7%, versus a decline of 0.4% for the S&P 500 Low Volatility Index. This type of divergence can happen especially during periods of strong performance and low volatility for the S&P 500. During this period, the annualized daily standard deviation for the S&P 500 was a relatively low 13.6%.

As Exhibit 2 shows, the trailing one-year volatility decreased for all 11 GICS sectors from July 31, 2023, to Oct. 31, 2023. The widespread decline in volatility across all 11 GICS sectors followed the same pattern in the three months prior to this period. Measured in absolute terms, volatility decreased the most for the Energy sector, although it remained the most volatile sector at 24.9%. As of Oct. 31, 2023, Consumer Staples was the least volatile sector, with a daily realized volatility of only 11.6%.

Amid the overall decrease in volatility, the latest rebalance of the S&P 500 Low Volatility Index brought some material changes to sector weightings, most notably in the Health Care and Consumer Discretionary sectors.

Following the most recent rebalance, Health Care’s weight dropped by 6.4%. Approximately 4.0% shifted to the Consumer Discretionary sector, more than doubling its weight to 7.3%. Other notable recipients were the Information Technology sector, which saw its weight almost double from 2.3% to 4.2%, as well as the Consumer Staples sector, which increased its weight to 26%.

After the Energy sector received a small allocation of approximately 1%, the Materials sector is now the only sector with no allocation in the S&P 500 Low Volatility Index. The latest rebalance became effective after the market close on Nov. 17, 2023.

1 https://fred.stlouisfed.org/series/DGS10

2 https://www.bls.gov/news.release/cpi.nr0.htm

The posts on this blog are opinions, not advice. Please read our Disclaimers.