Get Indexology® Blog updates via email.

In This List

The November 2023 Rebalance of the S&P 500 Low Volatility Index

A Tactical Look at Sectors

An Elevating Effect on Equal Weight?

The Magnificent Seven: A Taxing Question

Measuring Fixed Income Opportunities in Asia with Indices

The November 2023 Rebalance of the S&P 500 Low Volatility Index

Contributor Image
George Valantasis

Associate Director, Factors and Dividends

S&P Dow Jones Indices

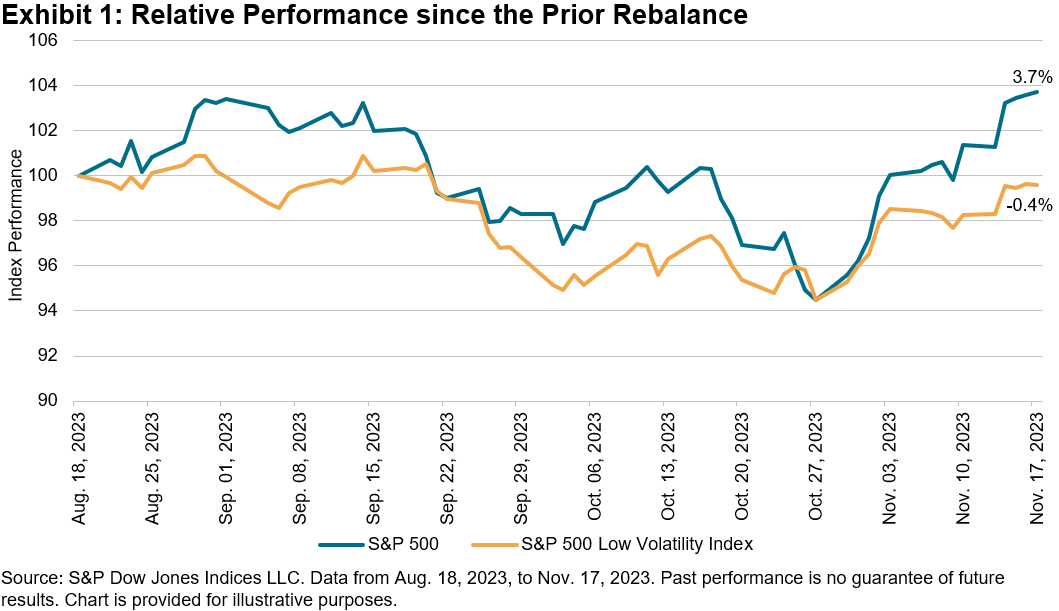
The S&P 500® continued its strong performance this year after posting a 9.8% gain in a span of less than three weeks from Oct. 30 to Nov. 17, 2023. During this period, the 10-year U.S. Treasury yield dropped approximately 45 bps1 and October’s year-over-year headline CPI inflation cooled to 3.2%.2 As Exhibit 1 shows, since the previous rebalance for the S&P 500 Low Volatility Index on Aug. 18, 2023, through the most recent rebalance on Nov. 17, 2023, the S&P 500 was up 3.7%, versus a decline of 0.4% for the S&P 500 Low Volatility Index. This type of divergence can happen especially during periods of strong performance and low volatility for the S&P 500. During this period, the annualized daily standard deviation for the S&P 500 was a relatively low 13.6%.

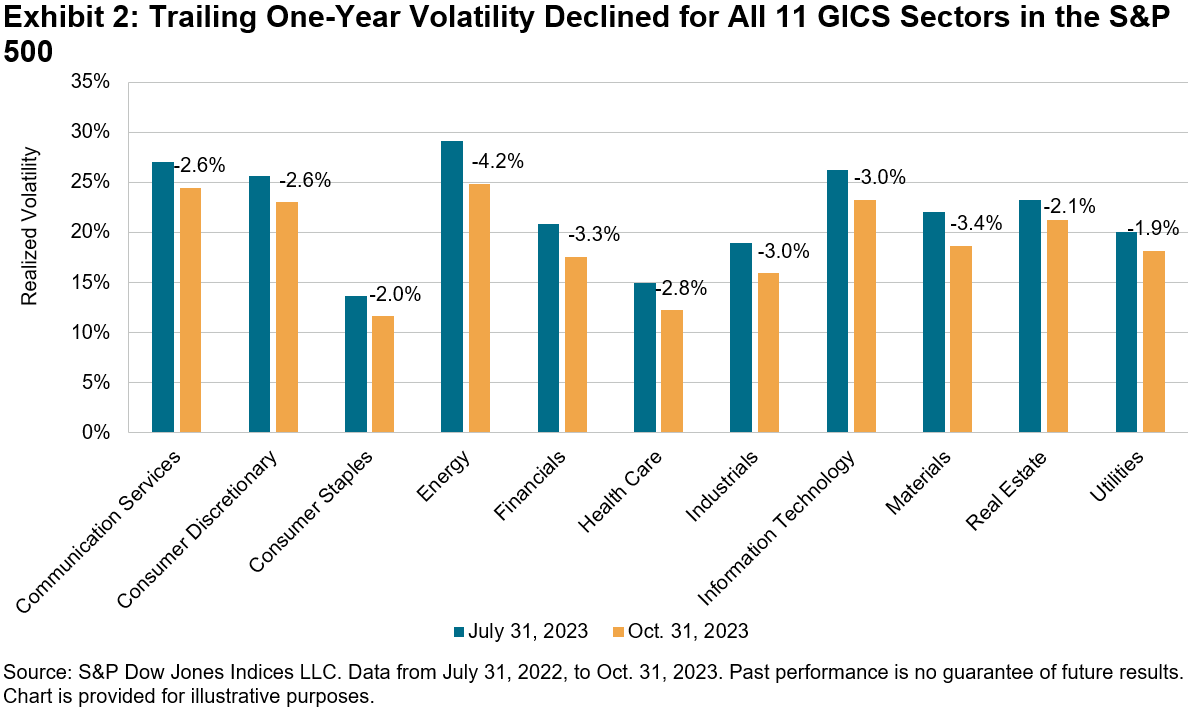
As Exhibit 2 shows, the trailing one-year volatility decreased for all 11 GICS sectors from July 31, 2023, to Oct. 31, 2023. The widespread decline in volatility across all 11 GICS sectors followed the same pattern in the three months prior to this period. Measured in absolute terms, volatility decreased the most for the Energy sector, although it remained the most volatile sector at 24.9%. As of Oct. 31, 2023, Consumer Staples was the least volatile sector, with a daily realized volatility of only 11.6%.

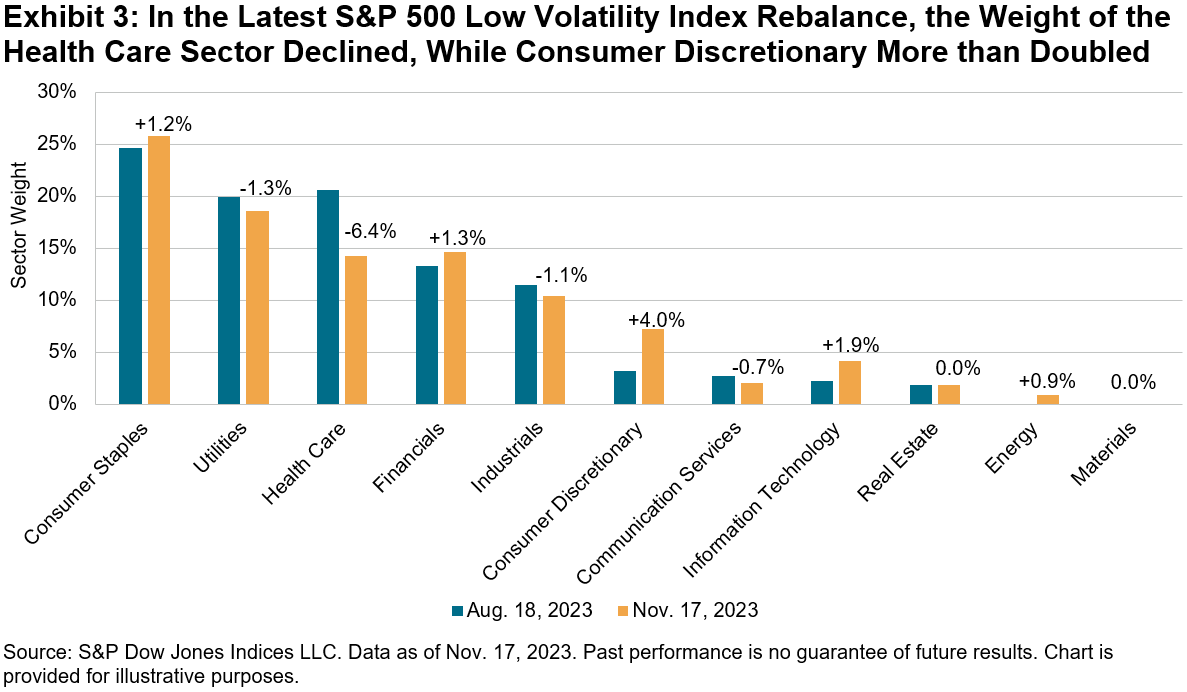
Amid the overall decrease in volatility, the latest rebalance of the S&P 500 Low Volatility Index brought some material changes to sector weightings, most notably in the Health Care and Consumer Discretionary sectors.

Following the most recent rebalance, Health Care’s weight dropped by 6.4%. Approximately 4.0% shifted to the Consumer Discretionary sector, more than doubling its weight to 7.3%. Other notable recipients were the Information Technology sector, which saw its weight almost double from 2.3% to 4.2%, as well as the Consumer Staples sector, which increased its weight to 26%.

After the Energy sector received a small allocation of approximately 1%, the Materials sector is now the only sector with no allocation in the S&P 500 Low Volatility Index. The latest rebalance became effective after the market close on Nov. 17, 2023.

1 https://fred.stlouisfed.org/series/DGS10

2 https://www.bls.gov/news.release/cpi.nr0.htm

The posts on this blog are opinions, not advice. Please read our Disclaimers.

A Tactical Look at Sectors

How are advisors using sector data to understand market trends and inform investment decisions? S&P DJI’s Anu Ganti joins Fairlead Strategies’ Katie Stockton to discuss practical applications for sector indices.

The posts on this blog are opinions, not advice. Please read our Disclaimers.

An Elevating Effect on Equal Weight?

Contributor Image
Anu Ganti

U.S. Head of Index Investment Strategy

S&P Dow Jones Indices

The trouncing of smaller caps by mega-cap stocks has been one of the hallmark market themes of this year, with the S&P 500® Top 50 outpacing the S&P SmallCap 600® by 30% YTD.1 As a result of its inherent small-cap bias, the S&P 500 Equal Weight Index (EWI) has suffered accordingly, underperforming the S&P 500 by 11% in the twelve months through October. But as we observe from the troughs and peaks in Exhibit 1, Equal Weight has always managed to recover from deep losses. February 2001, February 2010 and March 2021 are three prime examples, post major events like the tech bubble, financial crisis and COVID-19 recession.

While the strategy has weakened so far this year, we know from Exhibit 2 that Equal Weight tends to outperform over the long term. The strategy’s small size, anti-momentum and value tilts are key performance contributors. Further, Equal Weight’s innate rebalancing mechanism of selling the winners and buying the losers is an important benefit of the mean reversion we observe in Exhibit 1.

The quandary at hand is that it’s difficult to know in advance when the inflection point of outperformance for Equal Weight will occur. Historically, we have seen that turning points have coincided with extremes in mega-cap outperformance. We can visualize this relationship by ranking the months in our database by the 12-month relative performance of the S&P 500 Top 50 and dividing them into deciles. Next, we analyze the median subsequent 12-month performance of Equal Weight in each of these deciles. We observe that lower decile S&P 500 Top 50 months tended to be followed by Equal Weight outperformance in the next year, while higher deciles tended to be followed by Equal Weight underperformance.

Currently, thanks to the dominance of the Magnificent Seven stocks, we are at high levels of mega-cap outperformance relative to history, with the S&P 500 Top 50 outperforming the S&P 500 by 9% in the 12 months through October, beyond the 10th decile by a margin of 2%. Historically, we have seen that a retreat toward a lower decile tended to follow, accompanied by Equal Weight outperformance. Whether we experience a pullback in mega-cap strength or a continuation in mega-cap momentum remains to be seen.

1 Performance as of Nov. 17, 2023.

The posts on this blog are opinions, not advice. Please read our Disclaimers.

The Magnificent Seven: A Taxing Question

Contributor Image
Joseph Nelesen

Head of Specialists, Index Investment Strategy

S&P Dow Jones Indices

The Magnificent Seven” term has transcended its cinematic roots to become the collective moniker for a select group of U.S. mega-cap stocks responsible for over 90% of the S&P 500®’s YTD gains to October’s end. Their stellar performance has, naturally, elevated their valuations. It has also increased their already-hefty collective weight in the equity benchmark. Some might be wondering whether, rather than slavishly sticking to capitalization weights, is it now time to adopt an active approach, taking profits and avoiding further concentration?

Sharp rises in stock prices have been somewhat frequent historically, even among the market’s relative giants. Unfortunately, such occasions do not appear to present easy ways to outperform—at least judging by the collective evidence of 20 years of S&P DJI’s SPIVA® Scorecards. But even if the time is right to sell, many investors holding positions in the “Magnificent Seven” will have made a profit on them. Over and above any potential regret for their haste, selling out may invite another unwelcome consequence: a tax bill.

Recently, we published a major extension to the traditional SPIVA library with the first SPIVA After-Tax Scorecard. The report shows that, to put it bluntly: taxes matter. For example, Exhibit 1 (reproduced from the report) shows the impact of taxes on three-year underperformance rates by actively managed broad U.S. equity funds through December 2022.

Is it different this time? The current situation is not unusual. In most recent years, the top seven contributors1 ended the year looking relatively expensive (see Exhibit 2). A particularly intriguing comparison is seen in 2017. At that time, the so-called “FAANGs” faced a similar degree of market skepticism, with P/E ratios averaging nearly three times that of the index itself.

As it turned out: the seven top contributors in 2017 went on to contribute nearly 40% of the S&P 500’s 9.9% annualized return from December 2017 through October 2023. Five of them (including four of the FAANGs) are in today’s Magnificent Seven.

If it were simple to know when to sell seemingly overvalued stocks (as well as when to buy undervalued ones), actively managed funds might boast a better record. The inclusion of tax considerations only makes the evidence more emphatic. And while individual tax circumstances differ, the SPIVA After-Tax Scorecard highlights that taxes could have made a significant impact on the average returns of actively managed U.S. equity funds. They also show that, in recent times, the task of selecting an outperforming active fund net of poorly timed trades, fees and taxes was almost (if not completely) impossible.

1 We recognize that 7 is somewhat arbitrary; why not 6 or 8? For the sake of consistency and with a nod to the contemporary discourse, we stick with the top 7 contributors in each historical period and their trailing P/E ratios at that time.

The posts on this blog are opinions, not advice. Please read our Disclaimers.

Measuring Fixed Income Opportunities in Asia with Indices

How are indices helping investors track the continued development of Asian Bond markets? S&P DJI’s Randolf Tantzscher and SSGA’s Kheng Siang Ng discuss how indexing is helping market participants track the evolving fixed income opportunity set across currencies in Asia.

The posts on this blog are opinions, not advice. Please read our Disclaimers.