Get Indexology® Blog updates via email.

In This List

The Magnificent Seven: A Taxing Question

Measuring Fixed Income Opportunities in Asia with Indices

Material Change in a Material World

Tracking the Evolving Yield Landscape with Indices

Previewing the 2024 S&P GSCI Rebalance: Big Oil’s Mojo Is Back

The Magnificent Seven: A Taxing Question

Contributor Image
Joseph Nelesen

Head of Specialists, Index Investment Strategy

S&P Dow Jones Indices

The Magnificent Seven” term has transcended its cinematic roots to become the collective moniker for a select group of U.S. mega-cap stocks responsible for over 90% of the S&P 500®’s YTD gains to October’s end. Their stellar performance has, naturally, elevated their valuations. It has also increased their already-hefty collective weight in the equity benchmark. Some might be wondering whether, rather than slavishly sticking to capitalization weights, is it now time to adopt an active approach, taking profits and avoiding further concentration?

Sharp rises in stock prices have been somewhat frequent historically, even among the market’s relative giants. Unfortunately, such occasions do not appear to present easy ways to outperform—at least judging by the collective evidence of 20 years of S&P DJI’s SPIVA® Scorecards. But even if the time is right to sell, many investors holding positions in the “Magnificent Seven” will have made a profit on them. Over and above any potential regret for their haste, selling out may invite another unwelcome consequence: a tax bill.

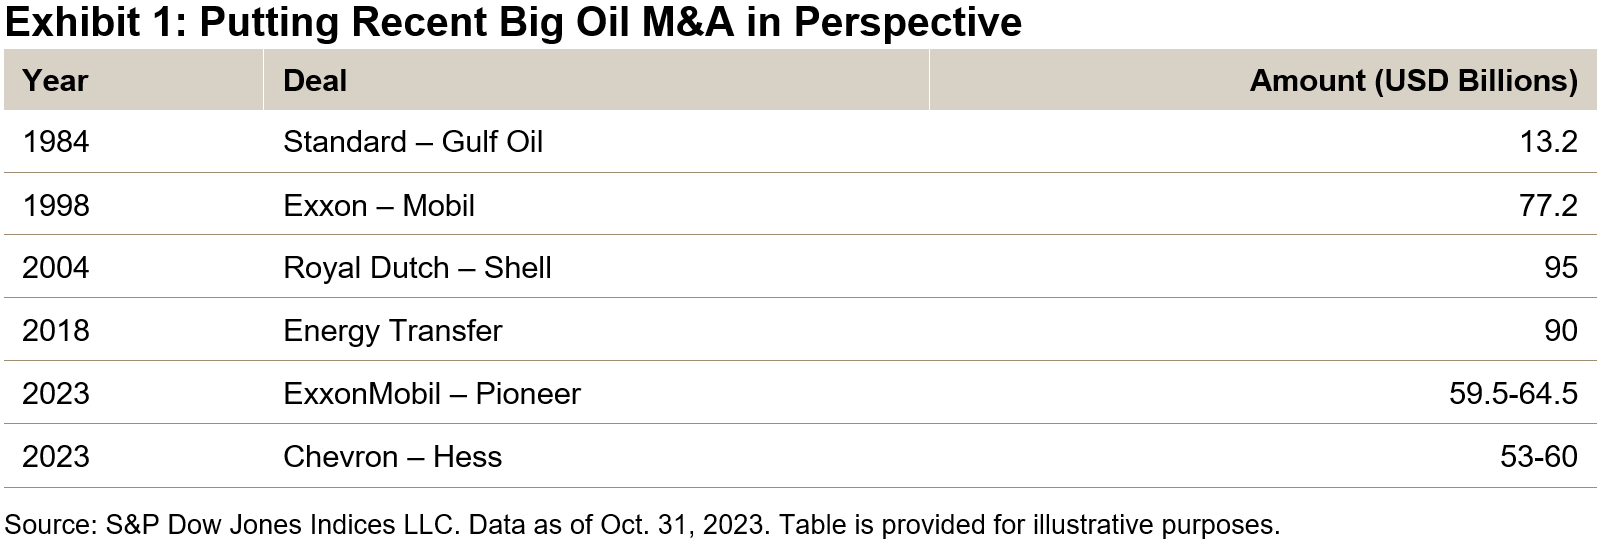
Recently, we published a major extension to the traditional SPIVA library with the first SPIVA After-Tax Scorecard. The report shows that, to put it bluntly: taxes matter. For example, Exhibit 1 (reproduced from the report) shows the impact of taxes on three-year underperformance rates by actively managed broad U.S. equity funds through December 2022.

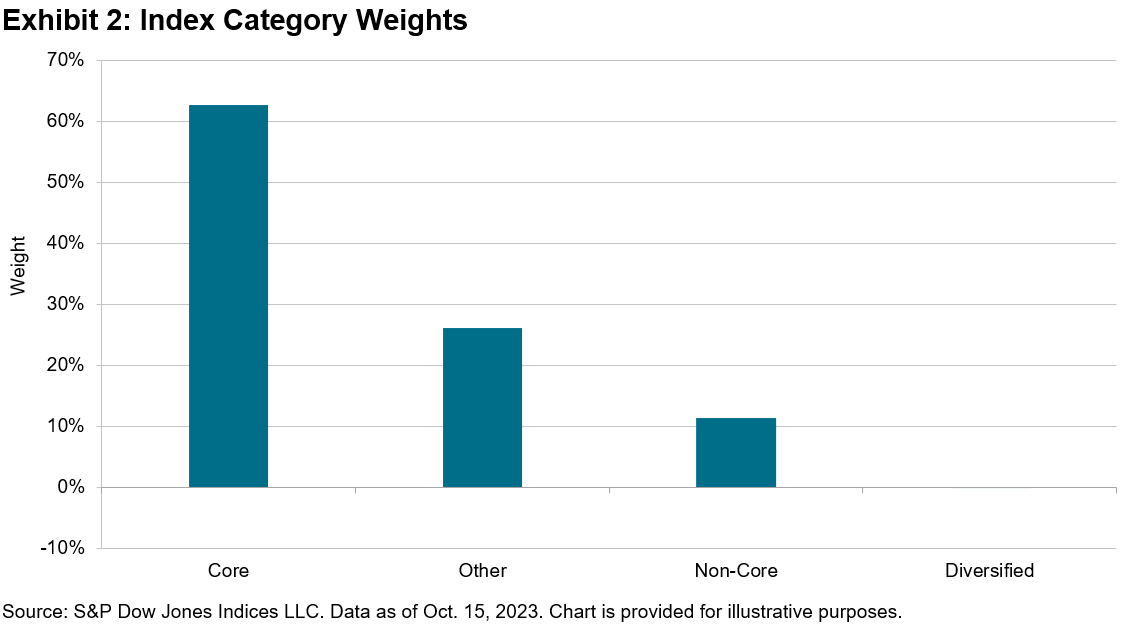
Is it different this time? The current situation is not unusual. In most recent years, the top seven contributors1 ended the year looking relatively expensive (see Exhibit 2). A particularly intriguing comparison is seen in 2017. At that time, the so-called “FAANGs” faced a similar degree of market skepticism, with P/E ratios averaging nearly three times that of the index itself.

As it turned out: the seven top contributors in 2017 went on to contribute nearly 40% of the S&P 500’s 9.9% annualized return from December 2017 through October 2023. Five of them (including four of the FAANGs) are in today’s Magnificent Seven.

If it were simple to know when to sell seemingly overvalued stocks (as well as when to buy undervalued ones), actively managed funds might boast a better record. The inclusion of tax considerations only makes the evidence more emphatic. And while individual tax circumstances differ, the SPIVA After-Tax Scorecard highlights that taxes could have made a significant impact on the average returns of actively managed U.S. equity funds. They also show that, in recent times, the task of selecting an outperforming active fund net of poorly timed trades, fees and taxes was almost (if not completely) impossible.

1 We recognize that 7 is somewhat arbitrary; why not 6 or 8? For the sake of consistency and with a nod to the contemporary discourse, we stick with the top 7 contributors in each historical period and their trailing P/E ratios at that time.

The posts on this blog are opinions, not advice. Please read our Disclaimers.

Measuring Fixed Income Opportunities in Asia with Indices

How are indices helping investors track the continued development of Asian Bond markets? S&P DJI’s Randolf Tantzscher and SSGA’s Kheng Siang Ng discuss how indexing is helping market participants track the evolving fixed income opportunity set across currencies in Asia.

The posts on this blog are opinions, not advice. Please read our Disclaimers.

Material Change in a Material World

Contributor Image
Srineel Jalagani

Senior Director, Thematic Indices

S&P Dow Jones Indices

As our climate changes, so do our ways of producing and consuming energy. A global effort is underway to replace fossil fuels with renewables in our energy matrix.1 This planned energy transition’s speed, scope and scale of impact on the global economy is unparalleled in our history.2 North America’s unique position of contributing nearly 18% of global greenhouse gas emissions, while only housing 5% of the world’s population, puts it under the spotlight. This region of the world is mostly self-reliant for its energy needs derived from carbon-based fuel sources. However, the transition to more renewable energy sources will likely see a higher dependence on the global supply of materials required for a successful energy transition.3

Capturing Relevance from Revenue and Exploration Datasets

To track possible opportunities related to changes in energy production and delivery, we launched the S&P/TSX Energy Transition Materials Index in August 2023. This index provides exposure to North American-listed companies involved in the exploration, mining or manufacturing of materials linked to the energy transition. The index is constructed using input from diverse datapoints—revenue breakdown across various categories from FactSet Revere Business Industry Classification System (RBICS), along with revenue earned, production value and exploration budget segments associated with each of the transition materials for individual companies provided by S&P Global Commodity Insights.

Economics would dictate increased capital spending by mining companies4 on exploration activities to capture the opportunity of rising demand for these transition-related materials. Including the exploration budgets of firms (sourced from S&P Global Commodity Insights) in determining their importance to the energy transition process is a key for a robust index grounded in the economics of supply and demand.

Transition-related materials are very similar to the metals group (aluminum, cobalt, copper, lithium, manganese, molybdenum, nickel, palladium, platinum, silver, rare earth elements and zinc) highlighted in the S&P Global Essential Metals Producers Index, another energy transition-focused index that was launched in August 2023.

The S&P/TSX Energy Transition Materials Index includes all twelve metals covered by the S&P Global Essential Metals Producers Index along with Uranium—which supports a view that nuclear power is a beneficiary of the push toward reduced fossil fuel dependency.5 These thirteen materials are categorized into core and non-core segments. Materials that are expected to see high demand growth specifically from energy transition-related changes are bucketed into core, while the remaining metals fall into the non-core group. The index construction process closely resembles that of the S&P Global Essential Metals Producers Index,6 where an exposure score calculation determines the relevance of each constituent to the theme. There is, however, one important difference.

The S&P/TSX Energy Transition Materials Index also includes companies based on the exploration budget (not just revenue segments) dedicated to these transition materials. Of the current 68 index constituents, 34 constituents (about 28% of the index weight) are included due to their exploration budgets. Of these 34 constituents, 24 do not have tagged revenue segments, underscoring the need for the S&P Global Commodity Insights exploration budget data to complete the index’s well-rounded exposure to the transition metals ecosystem

Index Composition

The index also has a minimum 50 stock count and each stock’s weight is initially set proportional to the product of its float market cap and its corresponding exposure score. Appropriate capping mechanisms are then applied to enhance the liquidity profile and diversification of the index.

The index’s North American-listed requirement puts 60% of the weight in Canadian listings, with the remaining weight in U.S. listings. A GICS® sub-industry breakdown of the constituents highlights the use case for RBICS and S&P Global Commodity Insights datasets to achieve the granularity needed for this index creation. Roughly half of the index exposure to core revenue segments of RBICS is grouped under the GICS sub-industries of Diversified Metals & Mining and Coal & Consumable Fuels.

1 https://www.spglobal.com/en/research-insights/articles/what-is-energy-transition

2 https://www.imf.org/en/Publications/fandd/issues/2022/12/bumps-in-the-energy-transition-yergin

3 https://www.spglobal.com/marketintelligence/en/mi/research-analysis/us-ira-and-critical-mineral-supply-challenge.html

4 https://www.nbcnews.com/science/environment/mining-gap-companies-push-find-raw-materials-electric-vehicle-boom-rcna5077

https://www.vanityfair.com/news/2022/04/the-billionaire-clubs-run-on-cobalt-says-everything-about-our-battery-powered-future

5 https://www.iea.org/news/nuclear-power-can-play-a-major-role-in-enabling-secure-transitions-to-low-emissions-energy-systems

6https://www.spglobal.com/spdji/en/documents/education/education-fueling-the-energy-transition.pdf

The posts on this blog are opinions, not advice. Please read our Disclaimers.

Tracking the Evolving Yield Landscape with Indices

How have shifts in U.S. interest rates influenced the fixed income opportunity set in Asia? S&P DJI’s Randolf Tantzscher joins SSgA’s Kheng Siang Ng for a closer look at how indices are helping investors track the development of global fixed income markets and assess potential shifts in the search for yield.

The posts on this blog are opinions, not advice. Please read our Disclaimers.

Previewing the 2024 S&P GSCI Rebalance: Big Oil’s Mojo Is Back

Contributor Image
Brian Luke

Senior Director, Head of Commodities, Real & Digital Assets

S&P Dow Jones Indices

Long-time investors in products linked to the S&P GSCI remain keenly aware of the outsized role oil has in broad commodity performance. Reviewing the projected weights of the 2024 S&P GSCI rebalance oil is expected to remain the largest commodity in the index. WTI and Brent crude oil are projected to swap positions and collectively account for over 40% of the S&P GSCI. World production averages of crude oil are predicted to fall 1.2% in 2024, reflecting a gradual decline in production averages from the time period used by S&P Dow Jones Indices.1

Big oil dominated the headlines in October after strong YTD performance in 2023. The S&P GSCI Crude Oil finished the third quarter up over 18%, outperforming stocks, bonds and broad commodities. This led to not one, but two blockbuster deals in October. ExxonMobil struck first, paying USD 59.5 billion for Pioneer Natural Resources, the largest acreage holder in the shale rich Permian basin. Chevron then ponied up to buy Hess Corp for USD 53 billion to gain access to the largest recent offshore oil discovery near the South American country of Guyana. These deal values, if closed, would be roughly double the famous KKR buyout of RJR Nabisco in 1989 and would rank within the top 10 in the 2020s.

Oil, along with other risk assets, slumped throughout the month, dropping 10%. Poor petroleum performance pushed the S&P GSCI down 4%, holding onto a 2.75% YTD gain. Industrial metals and livestock also fell in October, while natural gas gained 13% and gold rose 7% among the risk-off sentiment.

Energy transition is a significant topic among market participants. The S&P GSCI employs a production and weighted approach to measuring broad commodity performance. The decades-long decline of energy relative to other sectors has indeed taken place in the S&P GSCI. However, the recent M&A activity, as well as the S&P GSCI rebalance, indicates oil’s value to investors and importance to the market is not going away quickly.

1 The 2024 S&P GSCI Rebalance takes world production averages from 2016 to 2020.

The posts on this blog are opinions, not advice. Please read our Disclaimers.