
How are indices helping investors track the continued development of Asian Bond markets? S&P DJI’s Randolf Tantzscher and SSGA’s Kheng Siang Ng discuss how indexing is helping market participants track the evolving fixed income opportunity set across currencies in Asia.
The posts on this blog are opinions, not advice. Please read our Disclaimers.
Measuring Fixed Income Opportunities in Asia with Indices
Material Change in a Material World
Tracking the Evolving Yield Landscape with Indices
Previewing the 2024 S&P GSCI Rebalance: Big Oil’s Mojo Is Back
Investigating the Premium Available to Factor Returns via a Focus on Sustainability
Measuring Fixed Income Opportunities in Asia with Indices
Material Change in a Material World

As our climate changes, so do our ways of producing and consuming energy. A global effort is underway to replace fossil fuels with renewables in our energy matrix.1 This planned energy transition’s speed, scope and scale of impact on the global economy is unparalleled in our history.2 North America’s unique position of contributing nearly 18% of global greenhouse gas emissions, while only housing 5% of the world’s population, puts it under the spotlight. This region of the world is mostly self-reliant for its energy needs derived from carbon-based fuel sources. However, the transition to more renewable energy sources will likely see a higher dependence on the global supply of materials required for a successful energy transition.3
Capturing Relevance from Revenue and Exploration Datasets
To track possible opportunities related to changes in energy production and delivery, we launched the S&P/TSX Energy Transition Materials Index in August 2023. This index provides exposure to North American-listed companies involved in the exploration, mining or manufacturing of materials linked to the energy transition. The index is constructed using input from diverse datapoints—revenue breakdown across various categories from FactSet Revere Business Industry Classification System (RBICS), along with revenue earned, production value and exploration budget segments associated with each of the transition materials for individual companies provided by S&P Global Commodity Insights.
Economics would dictate increased capital spending by mining companies4 on exploration activities to capture the opportunity of rising demand for these transition-related materials. Including the exploration budgets of firms (sourced from S&P Global Commodity Insights) in determining their importance to the energy transition process is a key for a robust index grounded in the economics of supply and demand.
Transition-related materials are very similar to the metals group (aluminum, cobalt, copper, lithium, manganese, molybdenum, nickel, palladium, platinum, silver, rare earth elements and zinc) highlighted in the S&P Global Essential Metals Producers Index, another energy transition-focused index that was launched in August 2023.
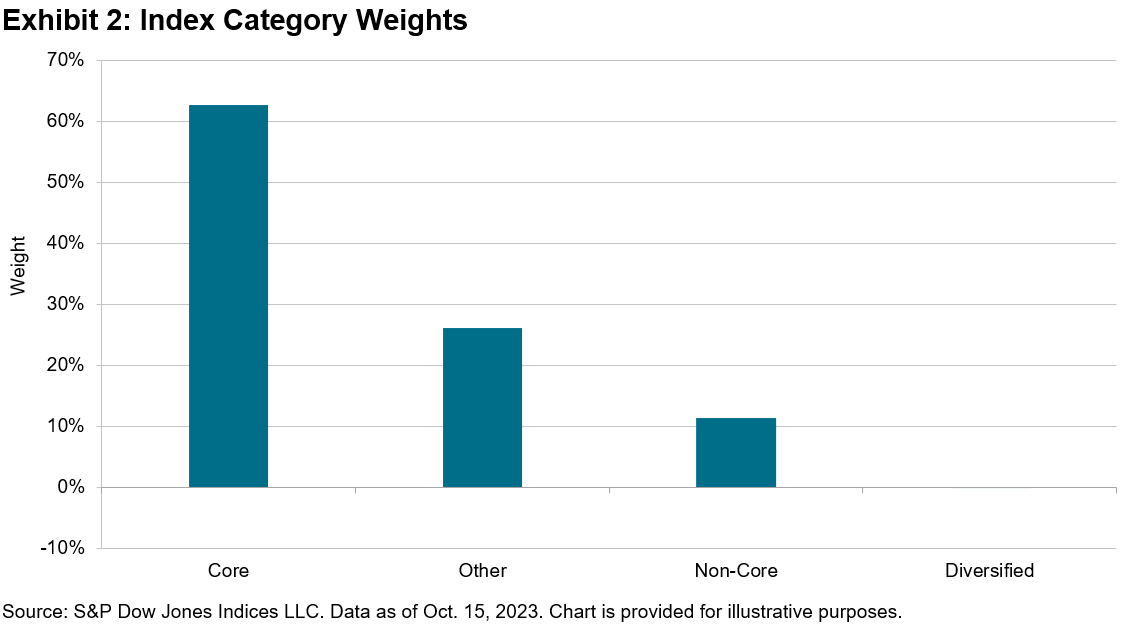
The S&P/TSX Energy Transition Materials Index includes all twelve metals covered by the S&P Global Essential Metals Producers Index along with Uranium—which supports a view that nuclear power is a beneficiary of the push toward reduced fossil fuel dependency.5 These thirteen materials are categorized into core and non-core segments. Materials that are expected to see high demand growth specifically from energy transition-related changes are bucketed into core, while the remaining metals fall into the non-core group. The index construction process closely resembles that of the S&P Global Essential Metals Producers Index,6 where an exposure score calculation determines the relevance of each constituent to the theme. There is, however, one important difference.
The S&P/TSX Energy Transition Materials Index also includes companies based on the exploration budget (not just revenue segments) dedicated to these transition materials. Of the current 68 index constituents, 34 constituents (about 28% of the index weight) are included due to their exploration budgets. Of these 34 constituents, 24 do not have tagged revenue segments, underscoring the need for the S&P Global Commodity Insights exploration budget data to complete the index’s well-rounded exposure to the transition metals ecosystem
Index Composition
The index also has a minimum 50 stock count and each stock’s weight is initially set proportional to the product of its float market cap and its corresponding exposure score. Appropriate capping mechanisms are then applied to enhance the liquidity profile and diversification of the index.
The index’s North American-listed requirement puts 60% of the weight in Canadian listings, with the remaining weight in U.S. listings. A GICS® sub-industry breakdown of the constituents highlights the use case for RBICS and S&P Global Commodity Insights datasets to achieve the granularity needed for this index creation. Roughly half of the index exposure to core revenue segments of RBICS is grouped under the GICS sub-industries of Diversified Metals & Mining and Coal & Consumable Fuels.
![]()
1 https://www.spglobal.com/en/research-insights/articles/what-is-energy-transition
2 https://www.imf.org/en/Publications/fandd/issues/2022/12/bumps-in-the-energy-transition-yergin
6https://www.spglobal.com/spdji/en/documents/education/education-fueling-the-energy-transition.pdf
The posts on this blog are opinions, not advice. Please read our Disclaimers.Tracking the Evolving Yield Landscape with Indices
How have shifts in U.S. interest rates influenced the fixed income opportunity set in Asia? S&P DJI’s Randolf Tantzscher joins SSgA’s Kheng Siang Ng for a closer look at how indices are helping investors track the development of global fixed income markets and assess potential shifts in the search for yield.
The posts on this blog are opinions, not advice. Please read our Disclaimers.Previewing the 2024 S&P GSCI Rebalance: Big Oil’s Mojo Is Back

Long-time investors in products linked to the S&P GSCI remain keenly aware of the outsized role oil has in broad commodity performance. Reviewing the projected weights of the 2024 S&P GSCI rebalance oil is expected to remain the largest commodity in the index. WTI and Brent crude oil are projected to swap positions and collectively account for over 40% of the S&P GSCI. World production averages of crude oil are predicted to fall 1.2% in 2024, reflecting a gradual decline in production averages from the time period used by S&P Dow Jones Indices.1
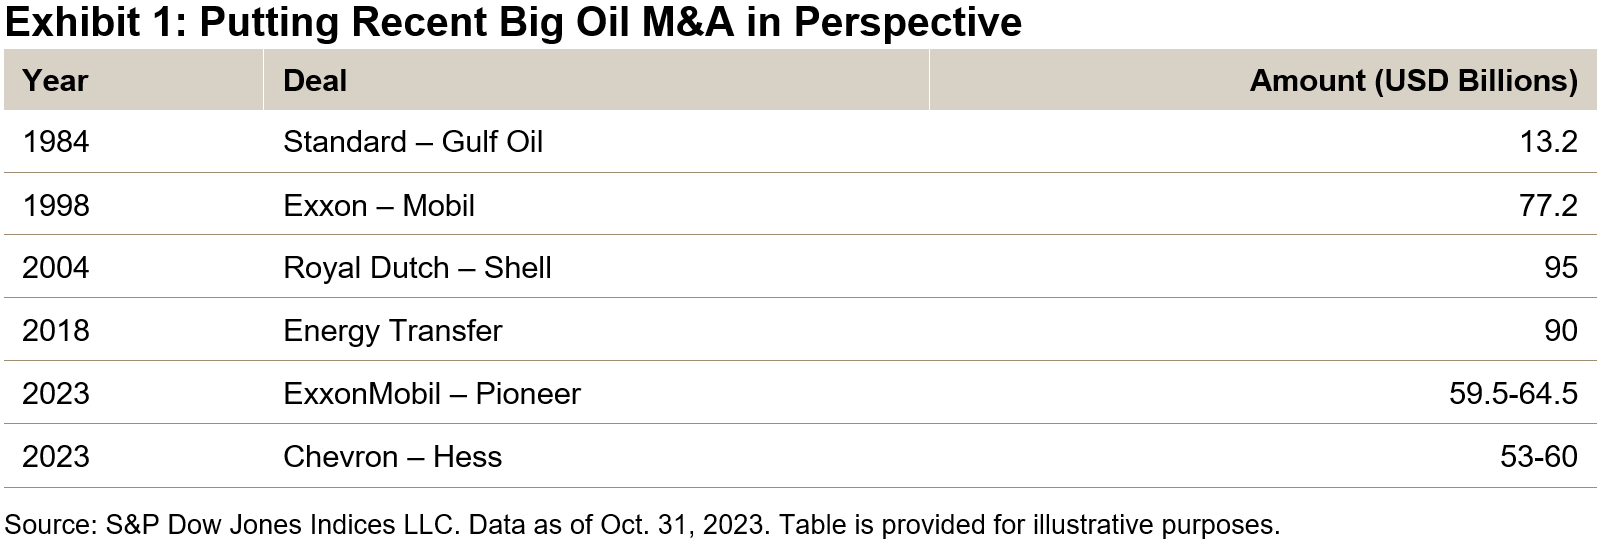
Big oil dominated the headlines in October after strong YTD performance in 2023. The S&P GSCI Crude Oil finished the third quarter up over 18%, outperforming stocks, bonds and broad commodities. This led to not one, but two blockbuster deals in October. ExxonMobil struck first, paying USD 59.5 billion for Pioneer Natural Resources, the largest acreage holder in the shale rich Permian basin. Chevron then ponied up to buy Hess Corp for USD 53 billion to gain access to the largest recent offshore oil discovery near the South American country of Guyana. These deal values, if closed, would be roughly double the famous KKR buyout of RJR Nabisco in 1989 and would rank within the top 10 in the 2020s.
Oil, along with other risk assets, slumped throughout the month, dropping 10%. Poor petroleum performance pushed the S&P GSCI down 4%, holding onto a 2.75% YTD gain. Industrial metals and livestock also fell in October, while natural gas gained 13% and gold rose 7% among the risk-off sentiment.
Energy transition is a significant topic among market participants. The S&P GSCI employs a production and weighted approach to measuring broad commodity performance. The decades-long decline of energy relative to other sectors has indeed taken place in the S&P GSCI. However, the recent M&A activity, as well as the S&P GSCI rebalance, indicates oil’s value to investors and importance to the market is not going away quickly.
1 The 2024 S&P GSCI Rebalance takes world production averages from 2016 to 2020.
The posts on this blog are opinions, not advice. Please read our Disclaimers.Investigating the Premium Available to Factor Returns via a Focus on Sustainability

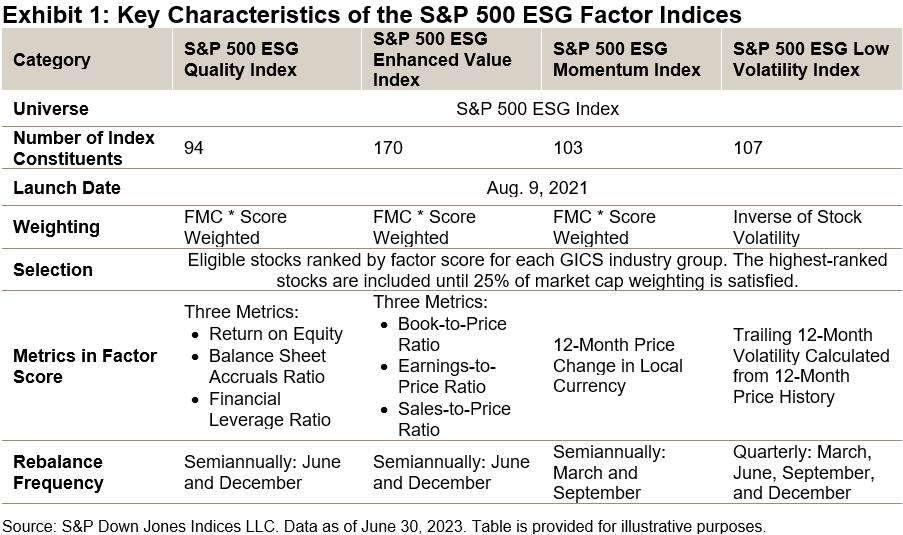
Factor indices aim to provide investors the means to access factor exposure in a cost-effective and transparent way. S&P DJI offers sustainability versions of factor indices that incorporate environmental, social and governance (ESG) scores, which allow investors to align their investments with their interests while seeking to improve risk/return dynamics. Launched in 2021, our suite of S&P 500 ESG Indices encompasses single-factor indices based on quality, momentum, enhanced value and low volatility.
Combining Factors and ESG Methodologies
The creation of the indices starts with the S&P 500® ESG Index. This version of the index has already undergone a transformation from the S&P 500 by including sustainability criteria. The index focuses on those companies with higher S&P DJI ESG Scores in each industry group, which add up to 75% of the underlying index universe’s cumulative float-adjusted market capitalization (FMC). The GICS® industry weightings therefore remain similar to those of the underlying S&P 500.
For further information on this index, see The S&P 500 ESG Index: Defining the Sustainable Core and How Does the S&P 500 ESG Index Work?
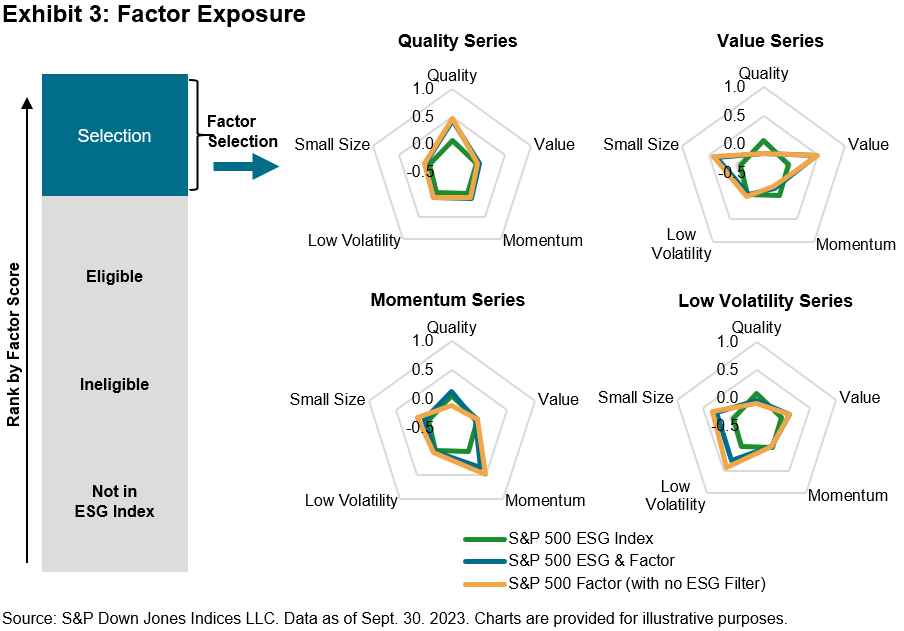
Taking the S&P 500 ESG Index as the base universe, the factor indices select stocks characterized as having relatively better factor scores within their respective GICS industry group. This sequence is followed to ensure that the factor’s exposure is prioritized and to help avoid factor dilution as compared to the non-ESG equivalent. The indices target 25% FMC of each industry group, using our S&P DJI factor scores that are calculated using the metrics detailed in Exhibit 1. Additional information can be also found in the methodology.
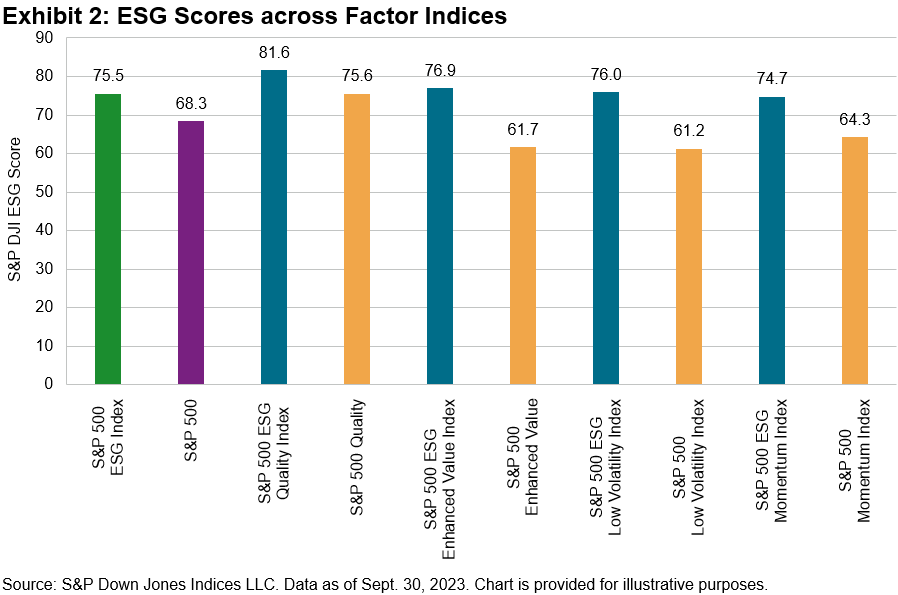
As of Sept. 30, 2023, all ESG factor indices had S&P DJI ESG Scores that were higher than those of both the non-ESG factor indices and the S&P 500 ESG Index.
Reviewing the exposures in the ESG factor indices shows that the indices were highly focused within their primary exposures, while secondary exposures to other factors were relatively low. Exhibits 3 and 4 also show that the ESG factor indices had similar factor exposures to their non-ESG counterparts. The addition of the ESG criteria did not dilute the factor exposures.
The return data for each of the indices shows that, over longer time periods, the ESG versions of the factor indices had higher risk-adjusted return ratios, indicating that higher returns were available for lower levels of risk. As expected, diverse market environments drove varying performance across factors over different time periods.
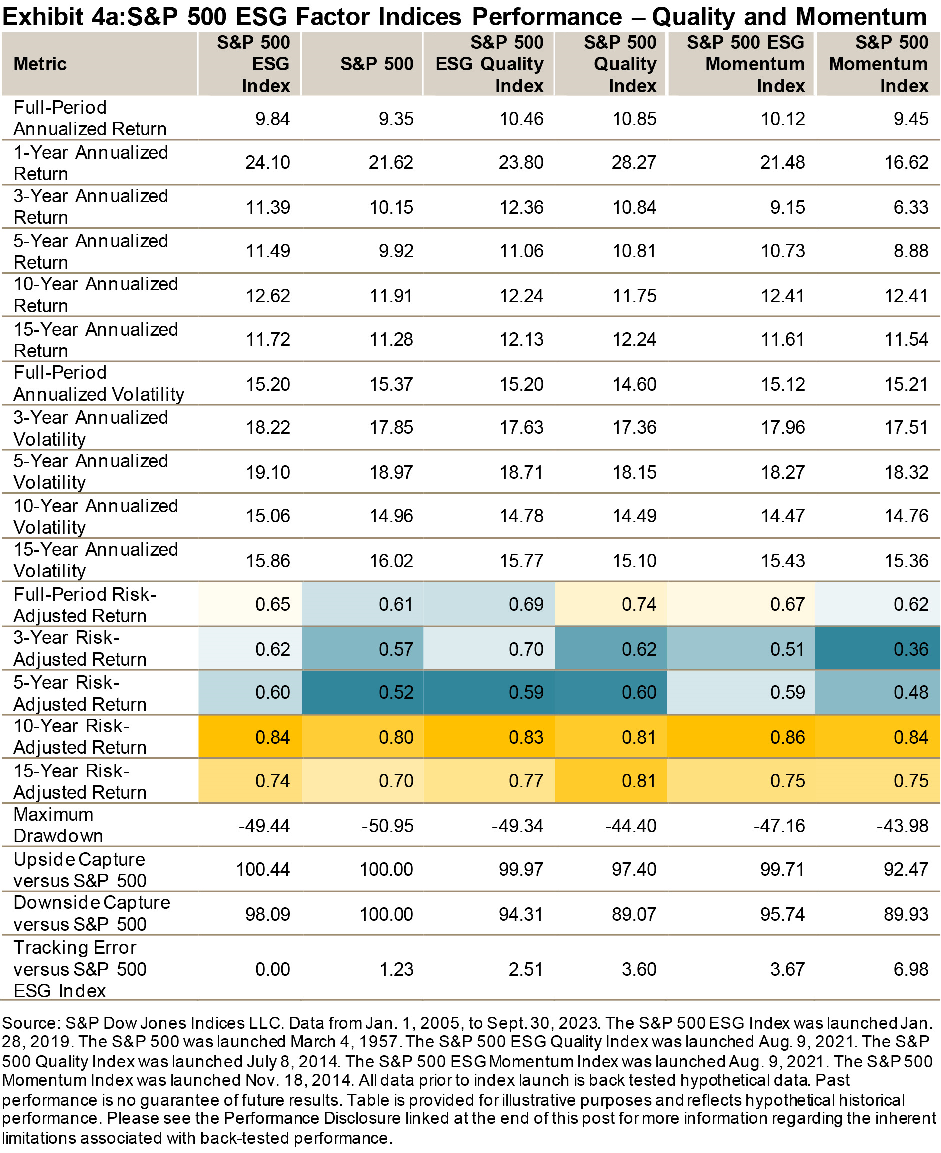
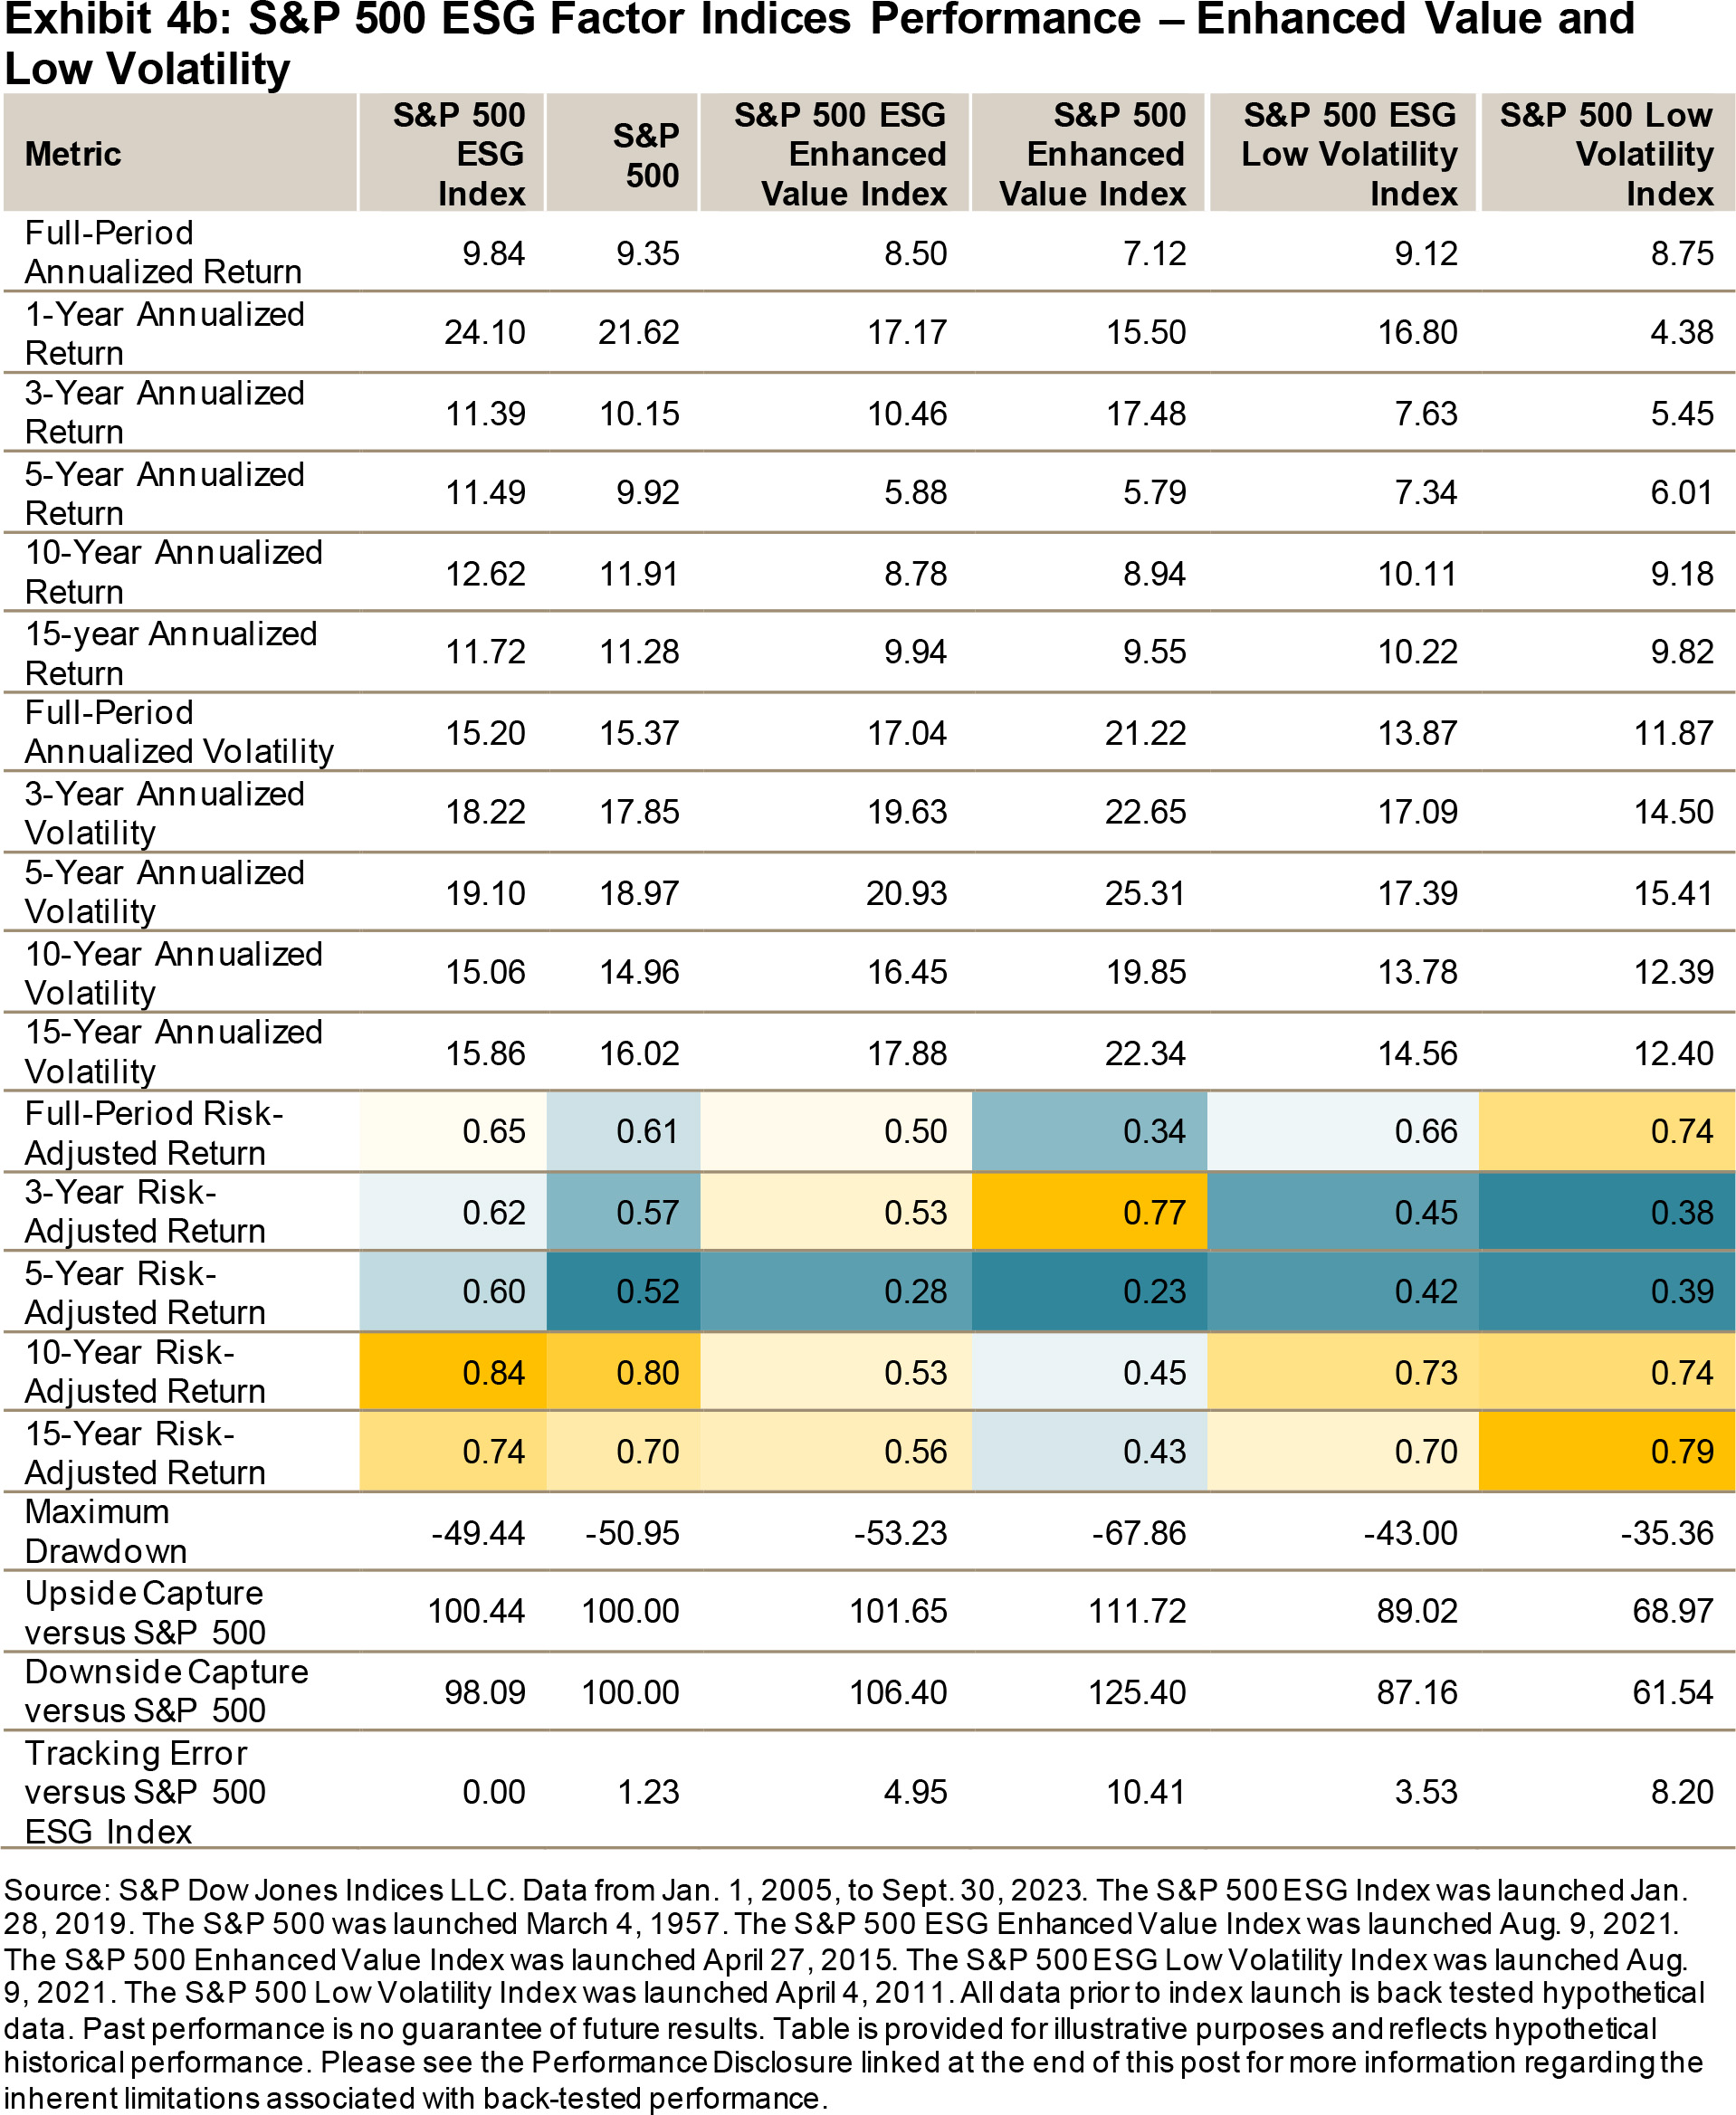
There is evidence to suggest that the selection for avoiding the lowest ESG-scoring companies relative to the S&P 500 may lead to higher performance over the longer term. S&P ESG Factor Indices have historically offered a factor return consistent with the targeted factor exposures. Over the period studied, adding the sustainability element did not affect the factor tilt, but it may have improved returns, as it allowed the companies with the highest ESG scores to be selected into the ESG factor indices. Based on the back-tested data, the S&P ESG Factor Indices have broadly outperformed their non-ESG counterparts since September 2005.
The posts on this blog are opinions, not advice. Please read our Disclaimers.