Get Indexology® Blog updates via email.

In This List

Previewing the 2024 S&P GSCI Rebalance: Big Oil’s Mojo Is Back

Investigating the Premium Available to Factor Returns via a Focus on Sustainability

The Importance of Profitability in Australian Small Caps

Tracking the Sun with Indices

Can Active Managers Outsmart the S&P 500 Dividend Aristocrats?

Previewing the 2024 S&P GSCI Rebalance: Big Oil’s Mojo Is Back

Contributor Image
Brian Luke

Senior Director, Head of Commodities, Real & Digital Assets

S&P Dow Jones Indices

Long-time investors in products linked to the S&P GSCI remain keenly aware of the outsized role oil has in broad commodity performance. Reviewing the projected weights of the 2024 S&P GSCI rebalance oil is expected to remain the largest commodity in the index. WTI and Brent crude oil are projected to swap positions and collectively account for over 40% of the S&P GSCI. World production averages of crude oil are predicted to fall 1.2% in 2024, reflecting a gradual decline in production averages from the time period used by S&P Dow Jones Indices.1

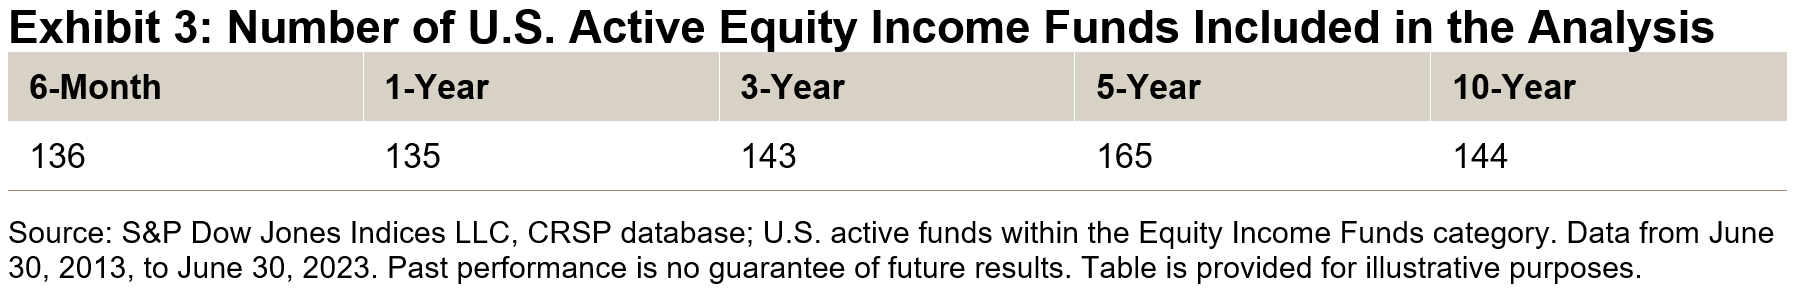
Big oil dominated the headlines in October after strong YTD performance in 2023. The S&P GSCI Crude Oil finished the third quarter up over 18%, outperforming stocks, bonds and broad commodities. This led to not one, but two blockbuster deals in October. ExxonMobil struck first, paying USD 59.5 billion for Pioneer Natural Resources, the largest acreage holder in the shale rich Permian basin. Chevron then ponied up to buy Hess Corp for USD 53 billion to gain access to the largest recent offshore oil discovery near the South American country of Guyana. These deal values, if closed, would be roughly double the famous KKR buyout of RJR Nabisco in 1989 and would rank within the top 10 in the 2020s.

Oil, along with other risk assets, slumped throughout the month, dropping 10%. Poor petroleum performance pushed the S&P GSCI down 4%, holding onto a 2.75% YTD gain. Industrial metals and livestock also fell in October, while natural gas gained 13% and gold rose 7% among the risk-off sentiment.

Energy transition is a significant topic among market participants. The S&P GSCI employs a production and weighted approach to measuring broad commodity performance. The decades-long decline of energy relative to other sectors has indeed taken place in the S&P GSCI. However, the recent M&A activity, as well as the S&P GSCI rebalance, indicates oil’s value to investors and importance to the market is not going away quickly.

1 The 2024 S&P GSCI Rebalance takes world production averages from 2016 to 2020.

The posts on this blog are opinions, not advice. Please read our Disclaimers.

Investigating the Premium Available to Factor Returns via a Focus on Sustainability

Contributor Image
Elizabeth Bebb

Director, Factor & Dividend Indices

S&P Dow Jones Indices

Factor indices aim to provide investors the means to access factor exposure in a cost-effective and transparent way. S&P DJI offers sustainability versions of factor indices that incorporate environmental, social and governance (ESG) scores, which allow investors to align their investments with their interests while seeking to improve risk/return dynamics. Launched in 2021, our suite of S&P 500 ESG Indices encompasses single-factor indices based on quality, momentum, enhanced value and low volatility.

Combining Factors and ESG Methodologies

The creation of the indices starts with the S&P 500® ESG Index. This version of the index has already undergone a transformation from the S&P 500 by including sustainability criteria. The index focuses on those companies with higher S&P DJI ESG Scores in each industry group, which add up to 75% of the underlying index universe’s cumulative float-adjusted market capitalization (FMC). The GICS® industry weightings therefore remain similar to those of the underlying S&P 500.

For further information on this index, see The S&P 500 ESG Index: Defining the Sustainable Core and How Does the S&P 500 ESG Index Work?

Taking the S&P 500 ESG Index as the base universe, the factor indices select stocks characterized as having relatively better factor scores within their respective GICS industry group. This sequence is followed to ensure that the factor’s exposure is prioritized and to help avoid factor dilution as compared to the non-ESG equivalent. The indices target 25% FMC of each industry group, using our S&P DJI factor scores that are calculated using the metrics detailed in Exhibit 1. Additional information can be also found in the methodology.

As of Sept. 30, 2023, all ESG factor indices had S&P DJI ESG Scores that were higher than those of both the non-ESG factor indices and the S&P 500 ESG Index.

Reviewing the exposures in the ESG factor indices shows that the indices were highly focused within their primary exposures, while secondary exposures to other factors were relatively low. Exhibits 3 and 4 also show that the ESG factor indices had similar factor exposures to their non-ESG counterparts. The addition of the ESG criteria did not dilute the factor exposures.

The return data for each of the indices shows that, over longer time periods, the ESG versions of the factor indices had higher risk-adjusted return ratios, indicating that higher returns were available for lower levels of risk. As expected, diverse market environments drove varying performance across factors over different time periods.

There is evidence to suggest that the selection for avoiding the lowest ESG-scoring companies relative to the S&P 500 may lead to higher performance over the longer term. S&P ESG Factor Indices have historically offered a factor return consistent with the targeted factor exposures. Over the period studied, adding the sustainability element did not affect the factor tilt, but it may have improved returns, as it allowed the companies with the highest ESG scores to be selected into the ESG factor indices. Based on the back-tested data, the S&P ESG Factor Indices have broadly outperformed their non-ESG counterparts since September 2005.

The posts on this blog are opinions, not advice. Please read our Disclaimers.

The Importance of Profitability in Australian Small Caps

Contributor Image
Sean Freer

Director, Global Equity Indices

S&P Dow Jones Indices

It has long been evident that small-cap companies with a track record of generating earnings have outperformed relative to their peers. Profitability matters for small-cap companies, and the S&P/ASX Small Ordinaries Select Index was launched in 2018 to provide a measurement of these companies in Australia.

The S&P/ASX Small Ordinaires Select Index—which includes a profitably screen on constituent selection—turns five this December. This is a timely moment to reflect on the index’s performance versus its benchmark, the S&P/ASX Small Ordinaries.

As of Sept. 30, 2023, the “select” approach has outperformed the S&P/ASX Small Ordinaries over all time periods studied, as well as demonstrating lower risk and, in turn, better risk-adjusted returns (see Exhibit 1). Notably, the past 12 months have been fruitful for the select approach, with the S&P/ASX Small Ordinaries Select Index outperforming the broader S&P/ASX Small Ordinaries by 5.85%.

When looking at rolling three- and five-year periods, the S&P/ASX Small Ordinaries Select Index outperformed the S&P/ASX Small Ordinaries over 70% of the time.

Positive EPS Approach Creates a Distinctive Small-Cap Index

Companies must have a track record of generating positive earnings to be eligible for inclusion in the S&P/ASX Small Ordinaries Select Index. The methodology requires constituents of the benchmark S&P/ASX Small Ordinaries to have a positive earnings per share (EPS) over the previous 24 months (two 12-month EPS periods) to be eligible for inclusion in the S&P/ASX Small Ordinaries Select Index. For existing constituents, over the prior 24 months, one of the previous two 12-month EPS periods must be positive for continued inclusion. The S&P/ASX Small Ordinaries universe includes companies outside the S&P/ASX 100 but within the S&P/ASX 300. This results in an index comprising 200 companies that represent the smaller end of the market. Currently, the S&P/ASX Small Ordinaries Select Index includes 142 of these companies that meet the profitability criteria.

While sector weights change over time, the “select” index had higher weights in the Real Estate, Financials and Industrials sectors and lower weights in Energy, Health Care and Information Technology as of Sept. 30, 2023 (see Exhibit 3).

Active Managers May Find the Select Approach Harder to Outperform

The recently released SPIVA Australia Mid-Year 2023 Scorecard showed the majority (55%) of Australian equity mutual funds underperformed the S&P/ASX 200 over the one-year period ending June 30, 2023. This figure increases to 81% and 79% over the 5- and 10-year periods, respectively. However, the scorecard shows that mid- and small-cap funds have historically fared better versus their benchmark. Yet, if we were to compare small-cap active funds to the S&P/ASX Small Ordinaries Select Index, small-cap managers would find it to be a more difficult benchmark to outperform, particularly over the past 12 months when profitability has led to above average relative outperformance.

Individual Company Contribution Drove Outperformance over the Past Year

Despite being underweight relative to the S&P/ASX Small Ordinaries, the Materials sector led in terms of performance contribution in the S&P/ASX Small Ordinaries Select Index over the 12-month period ending Sept. 30, 2023. This implies that the individual Materials companies within the select index had a more meaningful contribution to return, while the less profitable Materials companies excluded from the select index detracted from the performance of the broader S&P/ASX Small Ordinaries. Meanwhile, the S&P/ASX Small Ordinaries Select Index’s higher relative weight in the Financials and Industrials sectors also led to a higher performance contribution from those sectors compared to the S&P/ASX Small Ordinaries.

Since its launch in 2018, the profitability approach applied by the S&P/ASX Small Ordinaries Select Index has led to it outperforming its underlying index, the S&P/ASX Small Ordinaries, and it has also resulted in an index that is more difficult for active managers to beat historically.

The posts on this blog are opinions, not advice. Please read our Disclaimers.

Tracking the Sun with Indices

How can an index measure the companies driving the continued rise of solar power?  Take a custom look at how indexing works for solar with S&P DJI’s Michael Mell and MAC Solar Index’s Richard Asplund.

The posts on this blog are opinions, not advice. Please read our Disclaimers.

Can Active Managers Outsmart the S&P 500 Dividend Aristocrats?

Contributor Image
Rupert Watts

Head of Factors and Dividends

S&P Dow Jones Indices

Underperformance of many active managers against their broad market benchmarks has been well documented.1 However, we thought it would be interesting to apply this comparison specifically to the dividend market. In this blog, we will examine how the S&P 500® Dividend Aristocrats® stacks up against actively managed U.S. equity income funds.

Recognized as one of the most prominent dividend indices, the S&P 500 Dividend Aristocrats follows a simple but stringent metric to select constituents.2 To be eligible for inclusion, companies must be a member of the S&P 500 and have raised dividends for a minimum of 25 consecutive years. These companies tend to exhibit stable earnings, solid fundamentals and strong histories of profitability and growth. The index includes 67 companies as of June 2023.

The funds used in our analysis are sourced from the CRSP database within the Equity Income Funds category. The analysis was conducted using the same methodology and underlying analytical engine used to produce S&P DJI’s semiannual SPIVA® U.S. Scorecards.

As seen in Exhibit 1, the S&P 500 Dividend Aristocrats has proven difficult to beat, with over 98% of U.S. active managers underperforming the index over the past 10 years. Furthermore, it has outperformed the majority of active managers across all time periods measured.

The performance analysis is similarly striking. Exhibit 2 shows how the average annualized return of these U.S. active equity income managers (calculated two ways) compares across different time periods. Over the 10 years ending June 2023, the performance of the S&P 500 Dividend Aristocrats has been an impressive 12.0% annualized—outperforming by a wide margin.

Conclusion

The track record of significant outperformance is yet another reason why the S&P 500 Dividend Aristocrats is an iconic dividend index. This simple but rigorous methodology has not only proved difficult for most active equity income managers to beat, but it has also made it a standout among its passive peers.

The author would like to thank Davide Di Gioia, Chief SPIVA Engineer, for his contribution to this analysis.

1 See our SPIVA Scorecards for more information on the active vs. passive debate.

2 See index methodology for more information.

The posts on this blog are opinions, not advice. Please read our Disclaimers.