Get Indexology® Blog updates via email.

In This List

The Importance of Profitability in Australian Small Caps

Tracking the Sun with Indices

Can Active Managers Outsmart the S&P 500 Dividend Aristocrats?

Why Do Dividends Matter?

Seeking Shelter in Short-Term Municipals

The Importance of Profitability in Australian Small Caps

Contributor Image
Sean Freer

Director, Global Equity Indices

S&P Dow Jones Indices

It has long been evident that small-cap companies with a track record of generating earnings have outperformed relative to their peers. Profitability matters for small-cap companies, and the S&P/ASX Small Ordinaries Select Index was launched in 2018 to provide a measurement of these companies in Australia.

The S&P/ASX Small Ordinaires Select Index—which includes a profitably screen on constituent selection—turns five this December. This is a timely moment to reflect on the index’s performance versus its benchmark, the S&P/ASX Small Ordinaries.

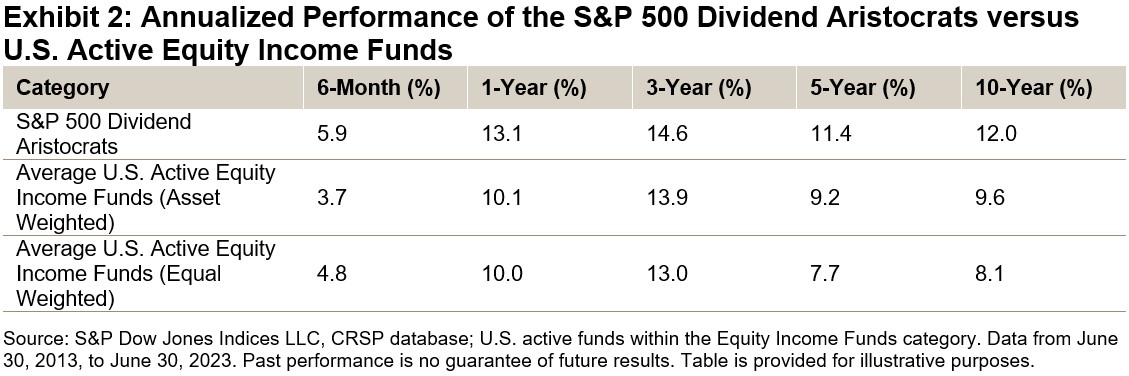
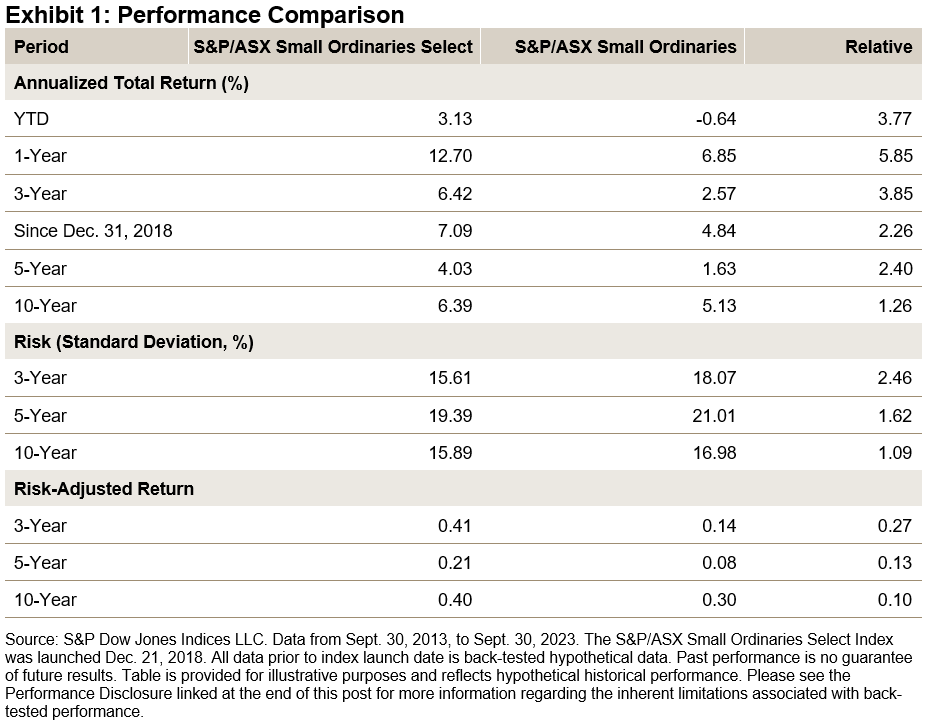
As of Sept. 30, 2023, the “select” approach has outperformed the S&P/ASX Small Ordinaries over all time periods studied, as well as demonstrating lower risk and, in turn, better risk-adjusted returns (see Exhibit 1). Notably, the past 12 months have been fruitful for the select approach, with the S&P/ASX Small Ordinaries Select Index outperforming the broader S&P/ASX Small Ordinaries by 5.85%.

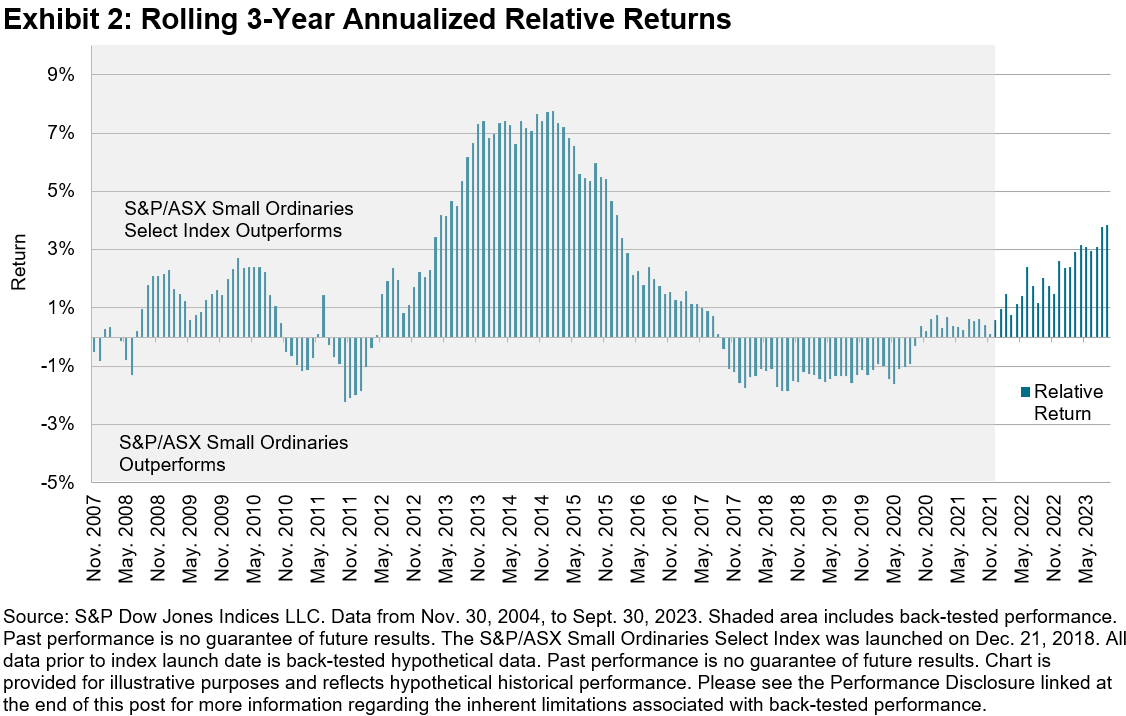
When looking at rolling three- and five-year periods, the S&P/ASX Small Ordinaries Select Index outperformed the S&P/ASX Small Ordinaries over 70% of the time.

Positive EPS Approach Creates a Distinctive Small-Cap Index

Companies must have a track record of generating positive earnings to be eligible for inclusion in the S&P/ASX Small Ordinaries Select Index. The methodology requires constituents of the benchmark S&P/ASX Small Ordinaries to have a positive earnings per share (EPS) over the previous 24 months (two 12-month EPS periods) to be eligible for inclusion in the S&P/ASX Small Ordinaries Select Index. For existing constituents, over the prior 24 months, one of the previous two 12-month EPS periods must be positive for continued inclusion. The S&P/ASX Small Ordinaries universe includes companies outside the S&P/ASX 100 but within the S&P/ASX 300. This results in an index comprising 200 companies that represent the smaller end of the market. Currently, the S&P/ASX Small Ordinaries Select Index includes 142 of these companies that meet the profitability criteria.

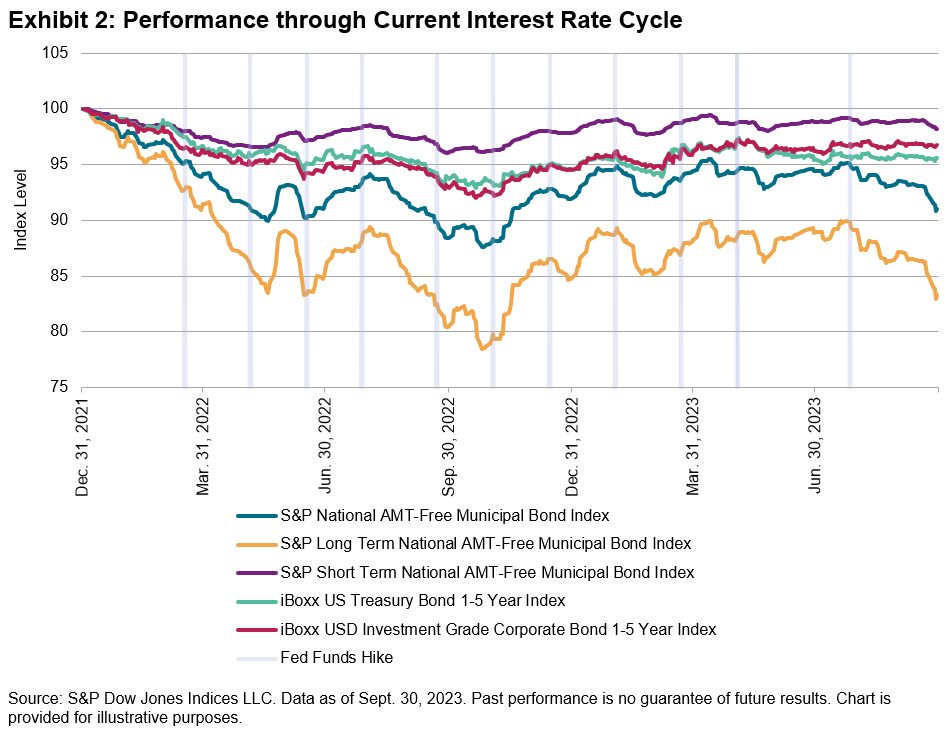
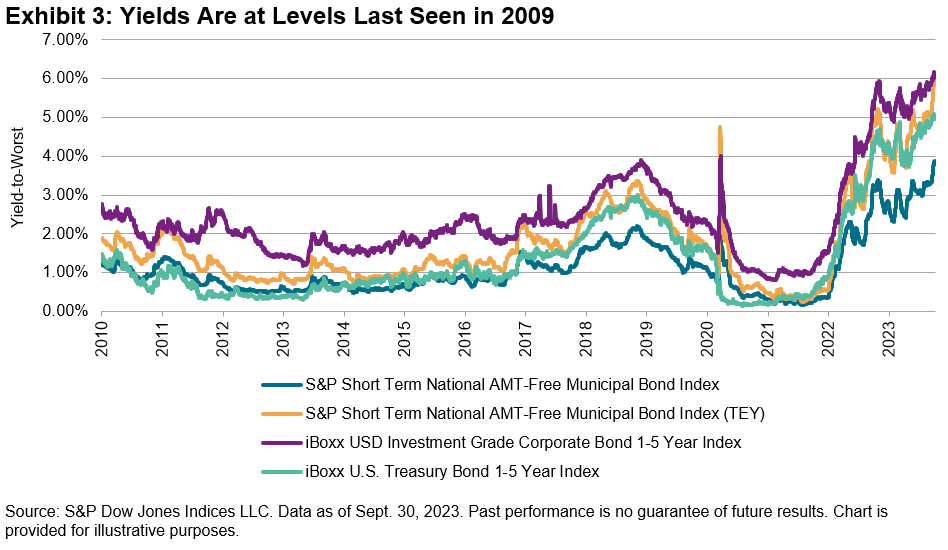
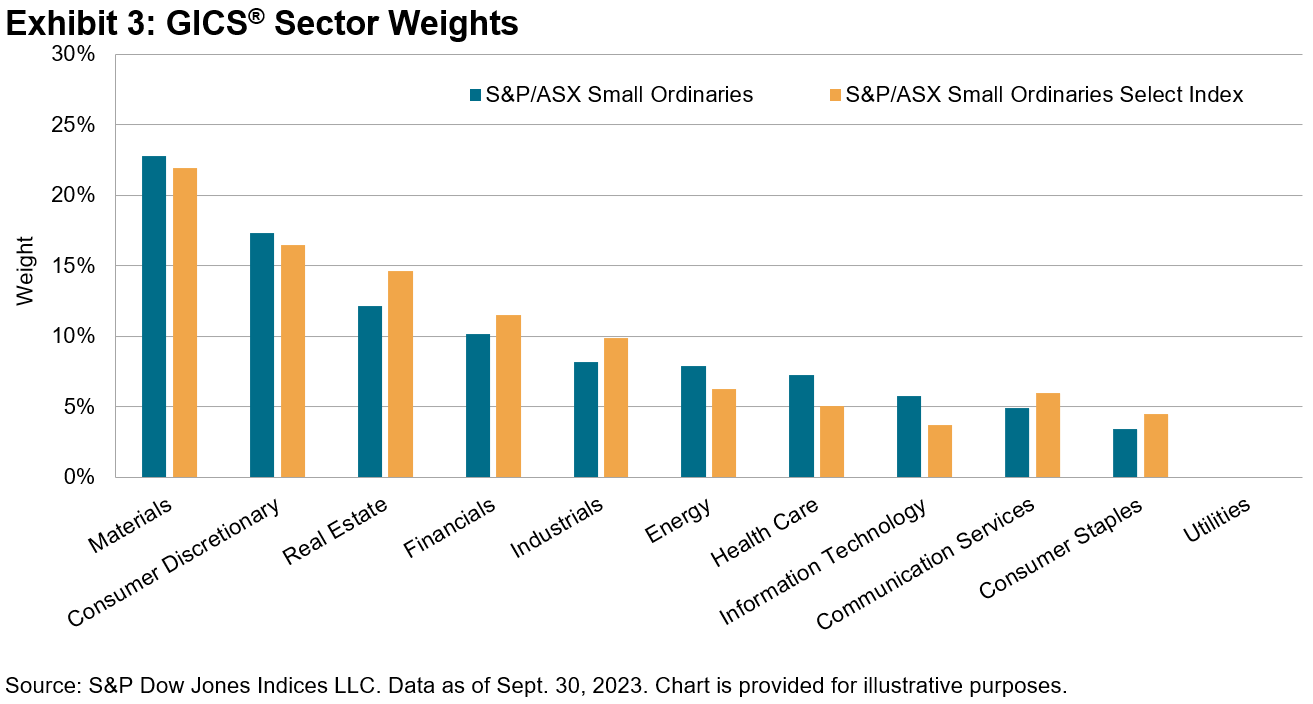
While sector weights change over time, the “select” index had higher weights in the Real Estate, Financials and Industrials sectors and lower weights in Energy, Health Care and Information Technology as of Sept. 30, 2023 (see Exhibit 3).

Active Managers May Find the Select Approach Harder to Outperform

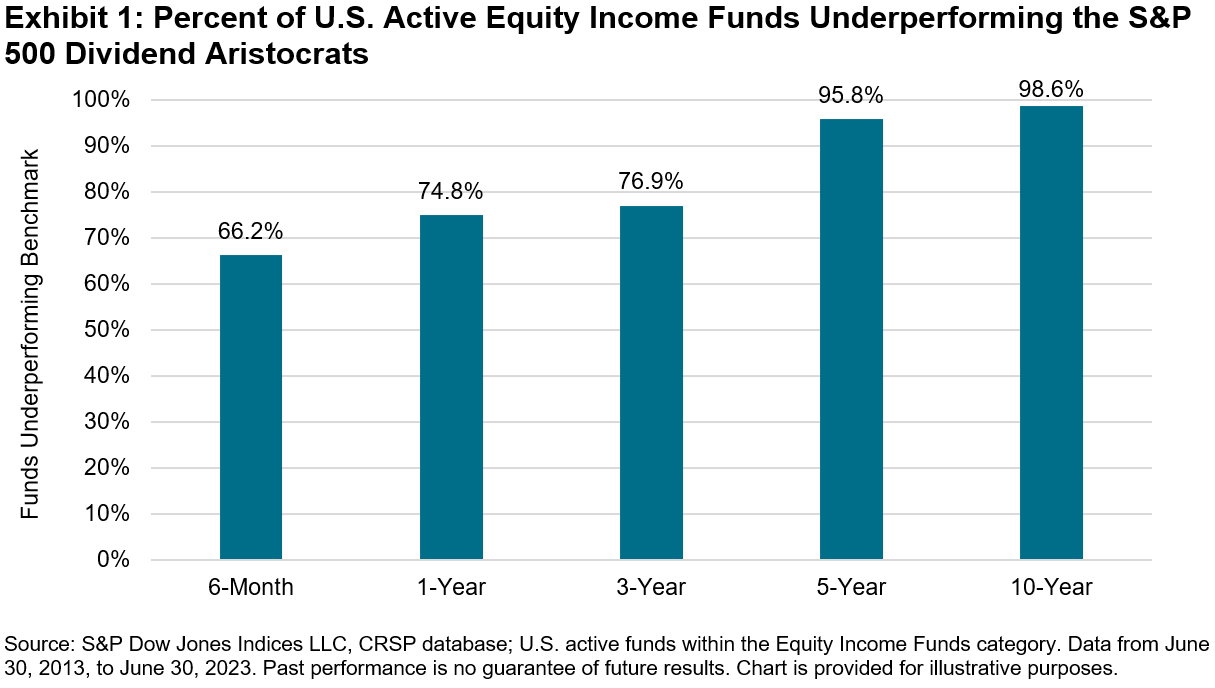
The recently released SPIVA Australia Mid-Year 2023 Scorecard showed the majority (55%) of Australian equity mutual funds underperformed the S&P/ASX 200 over the one-year period ending June 30, 2023. This figure increases to 81% and 79% over the 5- and 10-year periods, respectively. However, the scorecard shows that mid- and small-cap funds have historically fared better versus their benchmark. Yet, if we were to compare small-cap active funds to the S&P/ASX Small Ordinaries Select Index, small-cap managers would find it to be a more difficult benchmark to outperform, particularly over the past 12 months when profitability has led to above average relative outperformance.

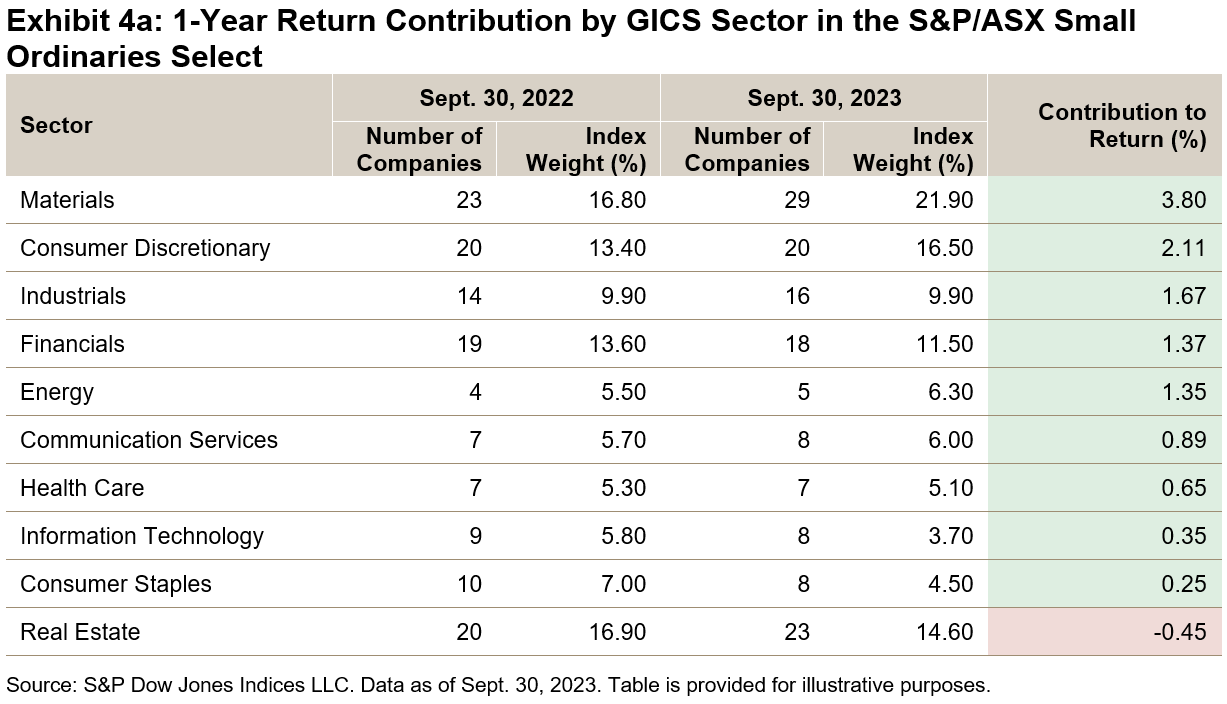
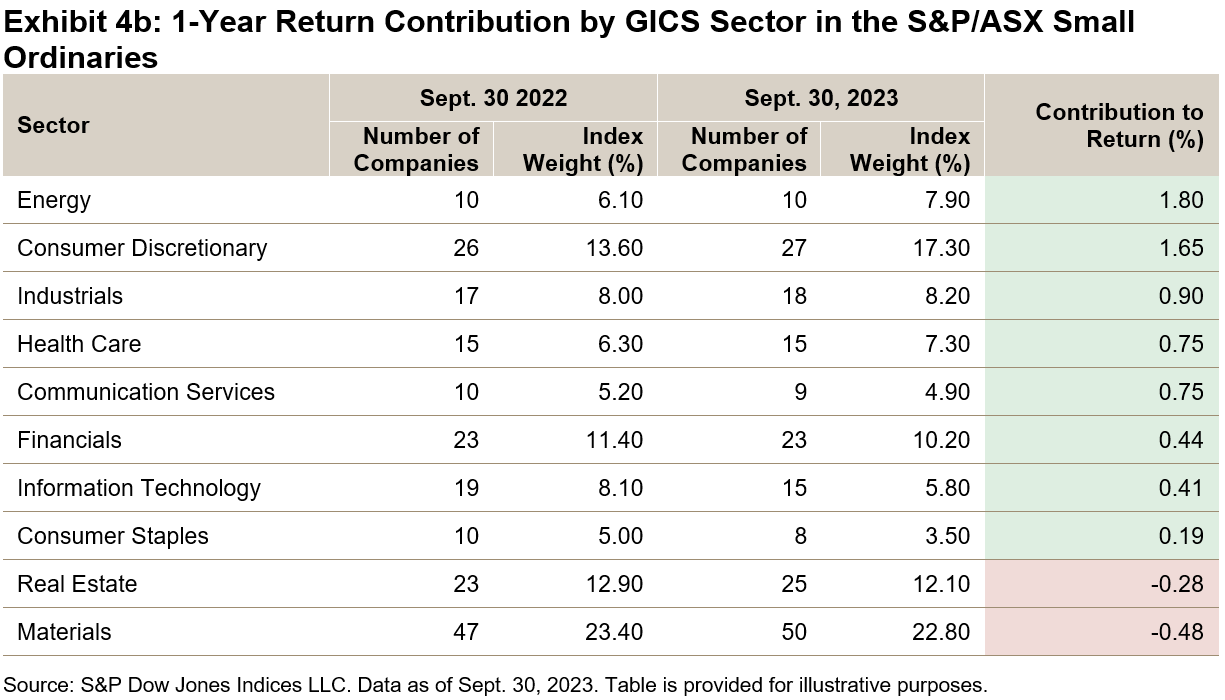
Individual Company Contribution Drove Outperformance over the Past Year

Despite being underweight relative to the S&P/ASX Small Ordinaries, the Materials sector led in terms of performance contribution in the S&P/ASX Small Ordinaries Select Index over the 12-month period ending Sept. 30, 2023. This implies that the individual Materials companies within the select index had a more meaningful contribution to return, while the less profitable Materials companies excluded from the select index detracted from the performance of the broader S&P/ASX Small Ordinaries. Meanwhile, the S&P/ASX Small Ordinaries Select Index’s higher relative weight in the Financials and Industrials sectors also led to a higher performance contribution from those sectors compared to the S&P/ASX Small Ordinaries.

Since its launch in 2018, the profitability approach applied by the S&P/ASX Small Ordinaries Select Index has led to it outperforming its underlying index, the S&P/ASX Small Ordinaries, and it has also resulted in an index that is more difficult for active managers to beat historically.

The posts on this blog are opinions, not advice. Please read our Disclaimers.

Tracking the Sun with Indices

How can an index measure the companies driving the continued rise of solar power?  Take a custom look at how indexing works for solar with S&P DJI’s Michael Mell and MAC Solar Index’s Richard Asplund.

The posts on this blog are opinions, not advice. Please read our Disclaimers.

Can Active Managers Outsmart the S&P 500 Dividend Aristocrats?

Contributor Image
Rupert Watts

Head of Factors and Dividends

S&P Dow Jones Indices

Underperformance of many active managers against their broad market benchmarks has been well documented.1 However, we thought it would be interesting to apply this comparison specifically to the dividend market. In this blog, we will examine how the S&P 500® Dividend Aristocrats® stacks up against actively managed U.S. equity income funds.

Recognized as one of the most prominent dividend indices, the S&P 500 Dividend Aristocrats follows a simple but stringent metric to select constituents.2 To be eligible for inclusion, companies must be a member of the S&P 500 and have raised dividends for a minimum of 25 consecutive years. These companies tend to exhibit stable earnings, solid fundamentals and strong histories of profitability and growth. The index includes 67 companies as of June 2023.

The funds used in our analysis are sourced from the CRSP database within the Equity Income Funds category. The analysis was conducted using the same methodology and underlying analytical engine used to produce S&P DJI’s semiannual SPIVA® U.S. Scorecards.

As seen in Exhibit 1, the S&P 500 Dividend Aristocrats has proven difficult to beat, with over 98% of U.S. active managers underperforming the index over the past 10 years. Furthermore, it has outperformed the majority of active managers across all time periods measured.

The performance analysis is similarly striking. Exhibit 2 shows how the average annualized return of these U.S. active equity income managers (calculated two ways) compares across different time periods. Over the 10 years ending June 2023, the performance of the S&P 500 Dividend Aristocrats has been an impressive 12.0% annualized—outperforming by a wide margin.

Conclusion

The track record of significant outperformance is yet another reason why the S&P 500 Dividend Aristocrats is an iconic dividend index. This simple but rigorous methodology has not only proved difficult for most active equity income managers to beat, but it has also made it a standout among its passive peers.

The author would like to thank Davide Di Gioia, Chief SPIVA Engineer, for his contribution to this analysis.

1 See our SPIVA Scorecards for more information on the active vs. passive debate.

2 See index methodology for more information.

The posts on this blog are opinions, not advice. Please read our Disclaimers.

Why Do Dividends Matter?

Income generation may be sought out by a variety of market participants, including those nearing retirement and those seeking a source of passive income. S&P DJI’s Jason Ye takes us inside the Dow Jones U.S. Dividend 100 Index for a look at yield beyond fixed income.

The posts on this blog are opinions, not advice. Please read our Disclaimers.

Seeking Shelter in Short-Term Municipals

Contributor Image
Jason Giordano

Director, Fixed Income, Product Management

S&P Dow Jones Indices

As has been the case for most of 2023, markets continue to grapple with the notion of whether the Fed will maintain its plan of “higher for longer.” Last week’s release of strong economic data (improved GDP expectations and strong unemployment) exacerbated selling in longer-dated treasuries, sending yields higher. As a result, U.S. Treasury bonds are on track to have their third consecutive year of negative performance—something that has never happened in the 95-year history of U.S. government securities.

The municipal bond market has faced additional challenges as both rising rates and poor technicals have resulted in a double whammy for most investors looking for tax-exempt income. Lipper has reported outflows from municipal funds in four of the last six months. Lower demand has added further price pressure on municipal bonds, especially in the 7- to 10-year range. However, there is a bright spot at the “front of the curve.” The S&P Short Term National AMT-Free Municipal Bond Index is the only member of the S&P AMT-Free Municipal Bond series that has managed to remain in positive territory through the first three quarters of 2023 (see Exhibit 1).

As expected, short-duration investments have outperformed during the current interest rate cycle, which began back in March 2022. Since that time, the Federal Open Market Committee (FOMC) has increased the fed funds rate 11 times for a total of 525 bps. Long-duration bonds have felt the brunt of these increases, with the S&P Long Term National AMT-Free Municipal Index experiencing a drawdown of over 20% (still faring much better than the S&P U.S. Treasury Bond 20+ year Index’s 40% drawdown). Meanwhile, the max drawdown of the S&P Short Term National AMT-Free Municipal Bond Index never exceeded 4% (see Exhibit 2).

The silver lining, perhaps, is that yields across nearly all sectors and maturities are at or near 15-year highs. Yields on the S&P Short Term National AMT-Free Municipal Bond Index crossed 3% in August and sat at 3.83% as of Sept. 30, 2023, 200 bps above the previous year. Furthermore, the taxable equivalent yield is closing in on 6%; 95 bps higher than similar maturity treasury notes and only 15 bps lower than short-term investment grade corporates (see Exhibit 3).

However, higher yields beget increased interest expense for issuers. Interest expense and interest coverage ratios are significant drivers of credit ratings and when it comes to credit quality, not all investment grade sectors are the same. Using the S&P National AMT-Free Municipal Bond Index as a proxy, more than 72% of the investment grade municipal market is rated AA- or higher while less than 10% is rated BBB+ or worse. Conversely, as measured by the iBoxx USD Investment Grade Corporate Bond Index, only 8% of the investment grade corporate market is rated AA- or higher while more than half (53%) is rated BBB+ or worse.

Many fixed income investors may view this period as an opportunity to take advantage of higher yields with an expectation of a Fed pivot in the near future. But if inflation remains stubborn and the Fed is forced to maintain a “higher for longer” monetary policy, short-term municipals’ historic ability to offer relatively high taxable-equivalent yields, high credit quality and lower sensitivity to potential tightening may make them an option worth considering.

The posts on this blog are opinions, not advice. Please read our Disclaimers.