Get Indexology® Blog updates via email.

In This List

Seeking Shelter in Short-Term Municipals

Why Do U.S. Mid-Cap Equities Matter?

Active Success: Still Elusive

Exploring Dividends Down Under

The Challenge Continues: Results from the SPIVA Latin America Mid-Year 2023 Scorecard

Seeking Shelter in Short-Term Municipals

Contributor Image
Jason Giordano

Director, Fixed Income, Product Management

S&P Dow Jones Indices

As has been the case for most of 2023, markets continue to grapple with the notion of whether the Fed will maintain its plan of “higher for longer.” Last week’s release of strong economic data (improved GDP expectations and strong unemployment) exacerbated selling in longer-dated treasuries, sending yields higher. As a result, U.S. Treasury bonds are on track to have their third consecutive year of negative performance—something that has never happened in the 95-year history of U.S. government securities.

The municipal bond market has faced additional challenges as both rising rates and poor technicals have resulted in a double whammy for most investors looking for tax-exempt income. Lipper has reported outflows from municipal funds in four of the last six months. Lower demand has added further price pressure on municipal bonds, especially in the 7- to 10-year range. However, there is a bright spot at the “front of the curve.” The S&P Short Term National AMT-Free Municipal Bond Index is the only member of the S&P AMT-Free Municipal Bond series that has managed to remain in positive territory through the first three quarters of 2023 (see Exhibit 1).

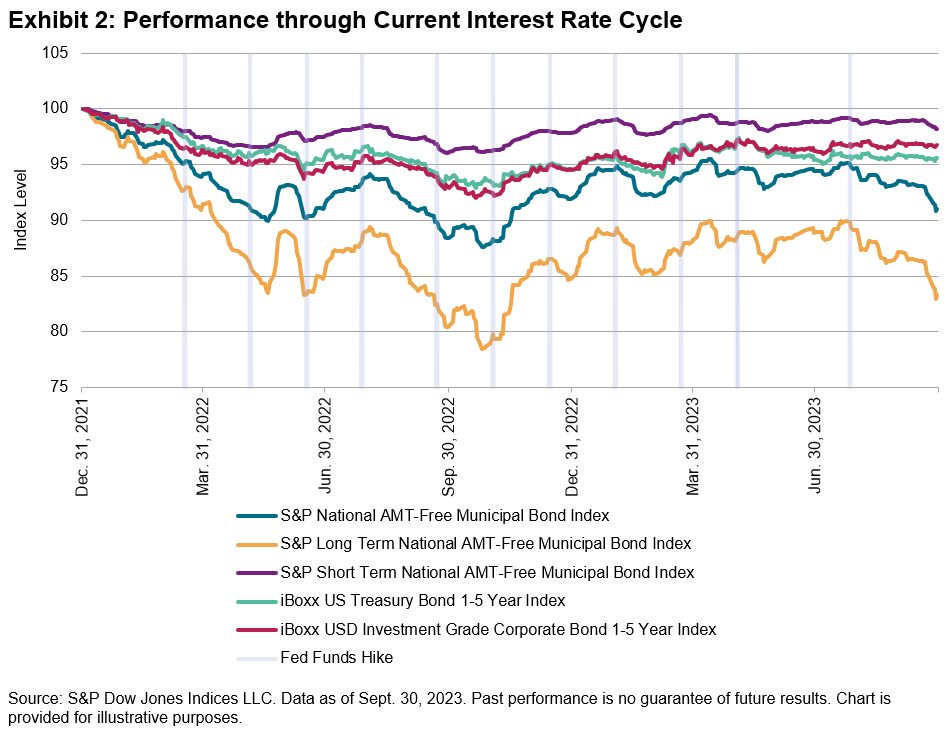
As expected, short-duration investments have outperformed during the current interest rate cycle, which began back in March 2022. Since that time, the Federal Open Market Committee (FOMC) has increased the fed funds rate 11 times for a total of 525 bps. Long-duration bonds have felt the brunt of these increases, with the S&P Long Term National AMT-Free Municipal Index experiencing a drawdown of over 20% (still faring much better than the S&P U.S. Treasury Bond 20+ year Index’s 40% drawdown). Meanwhile, the max drawdown of the S&P Short Term National AMT-Free Municipal Bond Index never exceeded 4% (see Exhibit 2).

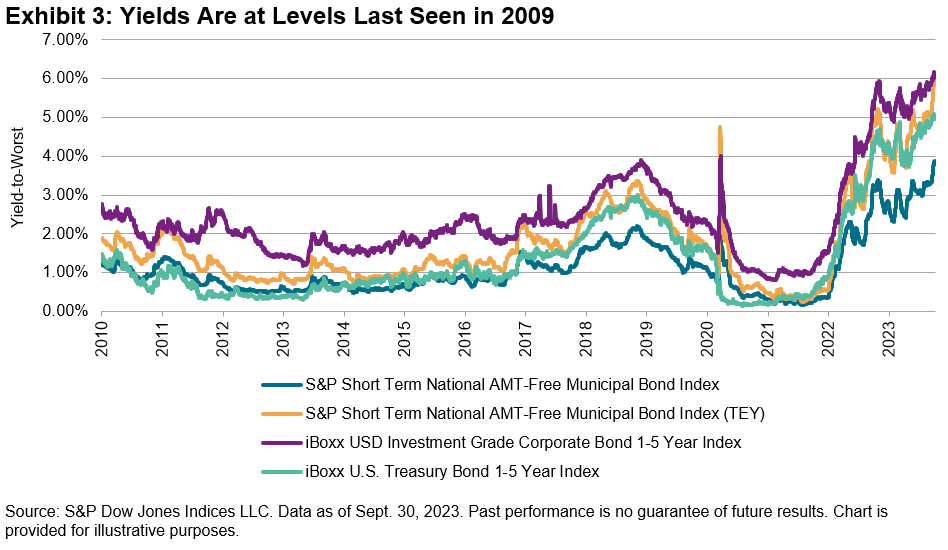
The silver lining, perhaps, is that yields across nearly all sectors and maturities are at or near 15-year highs. Yields on the S&P Short Term National AMT-Free Municipal Bond Index crossed 3% in August and sat at 3.83% as of Sept. 30, 2023, 200 bps above the previous year. Furthermore, the taxable equivalent yield is closing in on 6%; 95 bps higher than similar maturity treasury notes and only 15 bps lower than short-term investment grade corporates (see Exhibit 3).

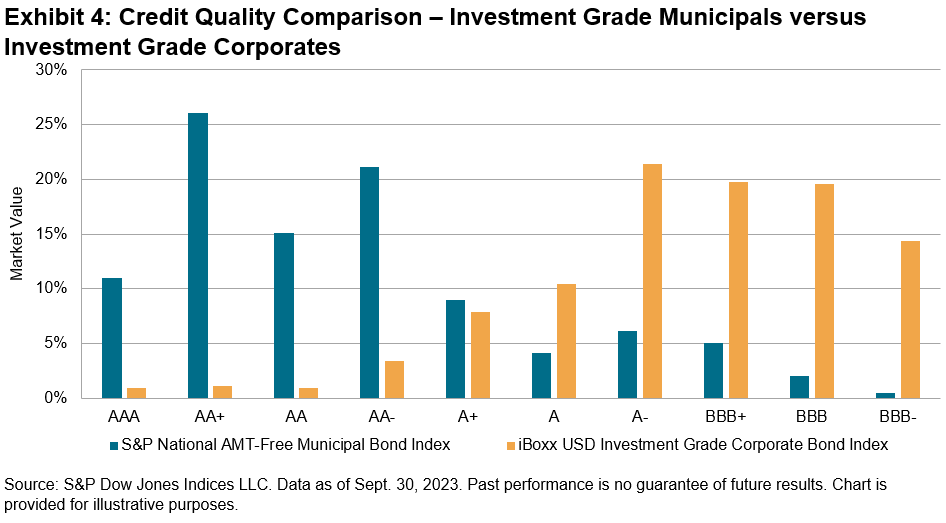
However, higher yields beget increased interest expense for issuers. Interest expense and interest coverage ratios are significant drivers of credit ratings and when it comes to credit quality, not all investment grade sectors are the same. Using the S&P National AMT-Free Municipal Bond Index as a proxy, more than 72% of the investment grade municipal market is rated AA- or higher while less than 10% is rated BBB+ or worse. Conversely, as measured by the iBoxx USD Investment Grade Corporate Bond Index, only 8% of the investment grade corporate market is rated AA- or higher while more than half (53%) is rated BBB+ or worse.

Many fixed income investors may view this period as an opportunity to take advantage of higher yields with an expectation of a Fed pivot in the near future. But if inflation remains stubborn and the Fed is forced to maintain a “higher for longer” monetary policy, short-term municipals’ historic ability to offer relatively high taxable-equivalent yields, high credit quality and lower sensitivity to potential tightening may make them an option worth considering.

The posts on this blog are opinions, not advice. Please read our Disclaimers.

Why Do U.S. Mid-Cap Equities Matter?

Take a deep dive into the S&P MidCap 400 as S&P DJI’s Hamish Preston and Sherifa Issifu explore what makes the S&P 400 relevant globally and the distinctive sector and risk/return characteristics of this slice of the U.S. equity market.

The posts on this blog are opinions, not advice. Please read our Disclaimers.

Active Success: Still Elusive

Contributor Image
Craig Lazzara

Former Managing Director, Index Investment Strategy

S&P Dow Jones Indices

Anyone even vaguely conversant with our SPIVA® Scorecards will realize that most active managers underperform passive benchmarks most of the time. This result is robust across geographies and across time, and is reflected in our recently issued mid-year 2023 report for the U.S. market.

Although the scorecard covers 39 categories of equity and fixed income managers, the largest and most closely watched comparison is that between large-cap U.S. equity managers and the S&P 500®. Exhibit 1 shows that 60% of large-cap managers underperformed the S&P 500 in the first six months of 2023; not since 2009 has a majority of large-cap managers outperformed.

More important than the last six months’ results is the long-run record of active performance, and here our mid-year report is consistent with its predecessors: as time periods lengthen, active outperformance becomes harder to find. Although “only” 60% of large-cap managers lagged the S&P 500 in the first six months of 2023, after 10 years the underperformance rate is 86%, and after 20 years it’s 94%. We see similar results across all manager categories.

The deterioration of results over the long term is strong inferential evidence that the true likelihood of active outperformance is less than 50%; if this were not so, we would expect longer-term results to be better than shorter. As we’ve observed before, skill persists, while luck is ephemeral.

There are good reasons why active managers typically underperform, but market movements in early 2023 exacerbated the challenge. Exhibit 2 illustrates the shift in relative sectoral performance between 2022 and the first six months of this year.

The three worst-performing sectors in 2022 were the only three sectors to beat the S&P 500 in the first half of 2023. For an active manager to navigate through such a sector reversal is difficult in any circumstance, and especially so when, as now, the three sectors coming into favor are also the three with the index’s highest average capitalization. As Exhibit 3 illustrates, the average return of the stocks in the S&P 500’s largest capitalization decile was more than double the average return of the next-best-performing decile.

When an index’s largest constituents are among its best performers, active management becomes especially difficult: the larger a stock’s index weight is, the less likely it is that active managers will overweight it. The relatively weak performance of the largest stocks helped to explain the comparatively good performance of active managers in 2022, just as their relatively strong performance in early 2023 served as a headwind.

That headwind blows with particular strength in Exhibit 4, which shows the distribution of the performance of the members of the S&P 500 for the first six months of 2023. The median stock in the index rose by 4.8%, while the simple average of all returns was 7.7%. Because the largest stocks in the index were among the best performers, the index’s 16.9% cap-weighted return was well above the simple average. The skewed distribution of returns, and the presence of so many large names on the right tail of the distribution, meant that only 28% of the stocks in the S&P 500 outperformed the index during the first six months.

Twenty-three years of SPIVA data have taught us that successful active management is rare. The remarkable performance of the S&P 500’s largest stocks made it particularly difficult in the first half of 2023. If the index’s larger caps continue to outperform, active managers’ difficulties are likely to continue.

The posts on this blog are opinions, not advice. Please read our Disclaimers.

Exploring Dividends Down Under

What’s driving demand for index-based access to dividends in Australia? S&P DJI’s Jason Ye surveys the dividend landscape in the Australian market and examines how market participants are using indices in the search for yield.

The posts on this blog are opinions, not advice. Please read our Disclaimers.

The Challenge Continues: Results from the SPIVA Latin America Mid-Year 2023 Scorecard

Contributor Image
Joseph Nelesen

Head of Specialists, Index Investment Strategy

S&P Dow Jones Indices

In the history of SPIVA (S&P Indices Versus Active) Scorecards, most active managers have tended to underperform benchmarks most of the time, especially over longer periods. The SPIVA Latin America Mid-Year 2023 Scorecard revealed that active managers produced mixed performance during the first half of 2023.

During H1 2023, more than one-half of active managers underperformed in the five out of seven categories observed, ranging from 54% for Brazil Mid-/Small-Cap funds to 91% for Mexico Equity funds. The only categories in which fewer than one-half of managers underperformed were Brazil Corporate Bond and Chile Equity funds, at 30% and 36%, respectively. Over longer time horizons, outperformance was fleeting across all seven categories, with 10-year underperformance rates ranging from 82% for Brazil Large-Cap funds to 96% for Brazil Corporate Bond funds (see Exhibit 1).

Active managers sought outperformance in a generally strong market environment, with the S&P Latin America BMI rising 21.4% over the first half of the year and each regional benchmark studied generating positive performance for H1 (see Exhibits 2 and 3). The start to the year was in marked contrast to 2022, which ended with two benchmarks, S&P Brazil MidSmallCap and Mexico’s S&P/BMV IRT, in negative territory.

One historically common headwind for active managers has been the presence of a positively skewed distribution of constituent returns. Put more simply, a small number of stocks typically outperforms the benchmark return while the majority lags. This scenario was certainly present in Mexico, where only 37% of constituents outperformed the S&P/BMV IRT in H1 2023, perhaps a contributing factor to the extremely high underperformance rate of Mexico Equity funds. However, more than one-half of benchmark constituents outperformed across all four other equity categories (see Exhibit 4). This relatively unusual scenario meant that a randomly selected stock in each of the four benchmarks had over a 50% chance of being an outperformer. Despite this lack of positive skew, few managers capitalized on the opportunity, as the Chile Equity fund category was the sole category in which fewer than one-half of managers underperformed.

Across most Latin American equity markets, dispersion levels in H1 2023 fell slightly from 2022’s elevated levels (see Exhibit 5). Higher dispersion, a measure of cross-sectional volatility expressing differences between stock returns within each index, has typically been associated not only with greater rewards from picking outperforming stocks but also with greater penalties from selecting underperformers.

For fund selectors, risks of underperformance are twofold. First, results show that most funds underperform their benchmark over time, making the process of finding a future winner statistically unlikely. Second, the penalty of selecting an underperforming fund has historically been more punishing in terms of average negative performance than the average upside generated from outperforming funds. More precisely, bottom-quartile funds underperformed their respective benchmarks to a greater degree than top-quartile funds outperformed in four out of seven categories in H1 2023 (see Exhibit 6).

While the results for the full year are yet to be seen, for many active fund managers in Latin America, performance challenges during the first half may have made the climb ahead look much steeper.


The posts on this blog are opinions, not advice. Please read our Disclaimers.