
What’s driving demand for index-based access to dividends in Australia? S&P DJI’s Jason Ye surveys the dividend landscape in the Australian market and examines how market participants are using indices in the search for yield.
The posts on this blog are opinions, not advice. Please read our Disclaimers.
Exploring Dividends Down Under
The Challenge Continues: Results from the SPIVA Latin America Mid-Year 2023 Scorecard
Diversifying Commodities Rise 16% in Q3 2023 as Equities Drop
Tracking Shariah Compliance with Indices
Measuring the Global Clean Energy Opportunity Set
Exploring Dividends Down Under
- Categories Factors
- Tags Ausbiz, Australia, Australia FA, buy-write, covered call, Dividend, dividend income, dividend opportunities, dividends, factors, factors and dividends, high dividend, income strategies, Jason Ye, options, S&P/ASX 200, S&P/ASX 200 High Dividend Index, S&P/ASX 300, S&P/ASX Sustainability Screened Dividend Opportunities Index, yield
The Challenge Continues: Results from the SPIVA Latin America Mid-Year 2023 Scorecard

In the history of SPIVA (S&P Indices Versus Active) Scorecards, most active managers have tended to underperform benchmarks most of the time, especially over longer periods. The SPIVA Latin America Mid-Year 2023 Scorecard revealed that active managers produced mixed performance during the first half of 2023.
During H1 2023, more than one-half of active managers underperformed in the five out of seven categories observed, ranging from 54% for Brazil Mid-/Small-Cap funds to 91% for Mexico Equity funds. The only categories in which fewer than one-half of managers underperformed were Brazil Corporate Bond and Chile Equity funds, at 30% and 36%, respectively. Over longer time horizons, outperformance was fleeting across all seven categories, with 10-year underperformance rates ranging from 82% for Brazil Large-Cap funds to 96% for Brazil Corporate Bond funds (see Exhibit 1).

Active managers sought outperformance in a generally strong market environment, with the S&P Latin America BMI rising 21.4% over the first half of the year and each regional benchmark studied generating positive performance for H1 (see Exhibits 2 and 3). The start to the year was in marked contrast to 2022, which ended with two benchmarks, S&P Brazil MidSmallCap and Mexico’s S&P/BMV IRT, in negative territory.


One historically common headwind for active managers has been the presence of a positively skewed distribution of constituent returns. Put more simply, a small number of stocks typically outperforms the benchmark return while the majority lags. This scenario was certainly present in Mexico, where only 37% of constituents outperformed the S&P/BMV IRT in H1 2023, perhaps a contributing factor to the extremely high underperformance rate of Mexico Equity funds. However, more than one-half of benchmark constituents outperformed across all four other equity categories (see Exhibit 4). This relatively unusual scenario meant that a randomly selected stock in each of the four benchmarks had over a 50% chance of being an outperformer. Despite this lack of positive skew, few managers capitalized on the opportunity, as the Chile Equity fund category was the sole category in which fewer than one-half of managers underperformed.

Across most Latin American equity markets, dispersion levels in H1 2023 fell slightly from 2022’s elevated levels (see Exhibit 5). Higher dispersion, a measure of cross-sectional volatility expressing differences between stock returns within each index, has typically been associated not only with greater rewards from picking outperforming stocks but also with greater penalties from selecting underperformers.

For fund selectors, risks of underperformance are twofold. First, results show that most funds underperform their benchmark over time, making the process of finding a future winner statistically unlikely. Second, the penalty of selecting an underperforming fund has historically been more punishing in terms of average negative performance than the average upside generated from outperforming funds. More precisely, bottom-quartile funds underperformed their respective benchmarks to a greater degree than top-quartile funds outperformed in four out of seven categories in H1 2023 (see Exhibit 6).

While the results for the full year are yet to be seen, for many active fund managers in Latin America, performance challenges during the first half may have made the climb ahead look much steeper.
The posts on this blog are opinions, not advice. Please read our Disclaimers.
Diversifying Commodities Rise 16% in Q3 2023 as Equities Drop

Commodities, as represented by the S&P GSCI, rose over 4% in September and 16% in Q3 2023. This highlighted the potential diversification qualities of this asset class, as equities and fixed income both fell during the month. Commodities’ low correlations to other asset classes can provide a cushion when other higher-allocated asset classes drop during risk-off scenarios as was seen last month. Adding commodities to a strategy tends to dampen overall portfolio risk and drawdowns over time. Historically, during periods of great macroeconomic shifts like we are experiencing now, a diversified portfolio has tended to perform better than more highly concentrated ones. During periods of high and sticky inflation readings, commodities have provided a hedge when other asset classes tend to drop from higher input costs.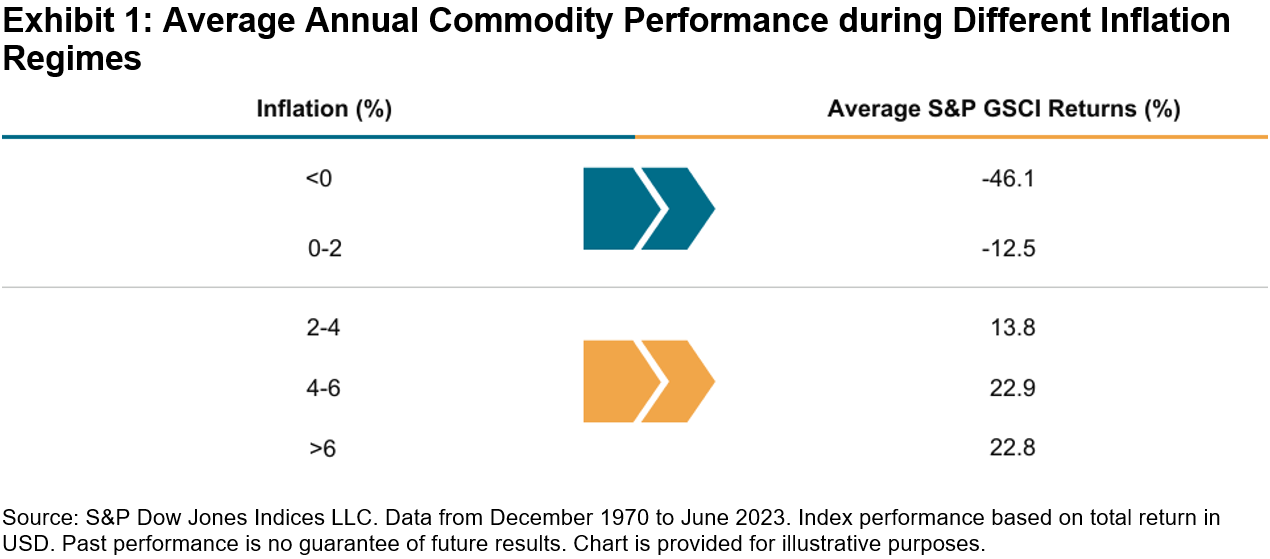
The main contributors to the outsized performance last month were the energy commodities. Supply cuts from Saudi Arabia and Russia were the strongest catalysts as demand persisted globally. The headline S&P GSCI currently has a weight in energy commodities of over 60% due to its construction as a world production-weighted index. Market participants replicating it as an inflation hedge witnessed higher returns recently in comparison to other comparable commodity indices, which tend to be more equally weighted. Energy commodities tend to have the highest inflation beta or sensitivity to changes in inflation over time. Other commodities used in petroleum products such as sugar also rose by 5%, with its heavy use in ethanol in South America.
The S&P GSCI Industrial Metals rose 3.51% in the third quarter, with the five metals’ prices continuing to bounce back from tough first half 2023 performances. Expectations for China’s economy to accelerate were never met, but stimulus measures are slowly being introduced. China tends to be the biggest contributor to metal demand and this has the potential to still be the case during the energy transition. The International Energy Agency (IEA) updated its Net Zero Roadmap in September, when it said electricity is poised to emerge as the new oil of the global energy system. Metal demand will likely pick up over time due to the use of certain industrial, precious and rare earth metals increasing by many times more across a wide span of clean energy technologies.
The S&P GSCI Agriculture fell 4.35% and the S&P GSCI Precious Metals fell 3.76% in the third quarter. Both sectors, along with most commodities, were hit by the headwind of a rising U.S. dollar. For the agriculture commodities, lower soybean usage and surprisingly larger wheat production figures were reported in the latest USDA quarterly stocks report. Within the precious metals, gold and silver both fell as real rates continued to rise. Gold tends to be inversely correlated to real rates but this hasn’t been the case for most of 2023. Recent heavy central bank bullion buying may have been the reason for gold’s resilience so far in 2023.
The posts on this blog are opinions, not advice. Please read our Disclaimers.Tracking Shariah Compliance with Indices
How are indices helping expand the range of Shariah-compliant tools for market participants? S&P DJI’s John Welling and Chimera Capital’s Sherif Salem join Dubai Financial Markets’ Eric Salomons for a look inside how S&P DJI’s Shariah-compliant and Sukuk indices are helping investors evaluate and access local, regional, and global markets while adhering to Islamic law and aligning with client objectives.
The posts on this blog are opinions, not advice. Please read our Disclaimers.Measuring the Global Clean Energy Opportunity Set
Climate change, resource scarcity and the transition to a low-carbon economy are creating robust, long-term demand for global clean energy solutions. Look inside the S&P Global Clean Energy Index, an innovative index built on robust datasets that seeks to track pure, liquid and transparent exposure to clean energy.
The posts on this blog are opinions, not advice. Please read our Disclaimers.