Get Indexology® Blog updates via email.

In This List

Diversifying Commodities Rise 16% in Q3 2023 as Equities Drop

Tracking Shariah Compliance with Indices

Measuring the Global Clean Energy Opportunity Set

Exploring the Case for Global Diversification in the Middle East

Introducing the Dispersion Index (DSPX)

Diversifying Commodities Rise 16% in Q3 2023 as Equities Drop

Contributor Image
Jim Wiederhold

Former Director, Commodities and Real Assets

S&P Dow Jones Indices

Commodities, as represented by the S&P GSCI, rose over 4% in September and 16% in Q3 2023. This highlighted the potential diversification qualities of this asset class, as equities and fixed income both fell during the month. Commodities’ low correlations to other asset classes can provide a cushion when other higher-allocated asset classes drop during risk-off scenarios as was seen last month. Adding commodities to a strategy tends to dampen overall portfolio risk and drawdowns over time. Historically, during periods of great macroeconomic shifts like we are experiencing now, a diversified portfolio has tended to perform better than more highly concentrated ones. During periods of high and sticky inflation readings, commodities have provided a hedge when other asset classes tend to drop from higher input costs.

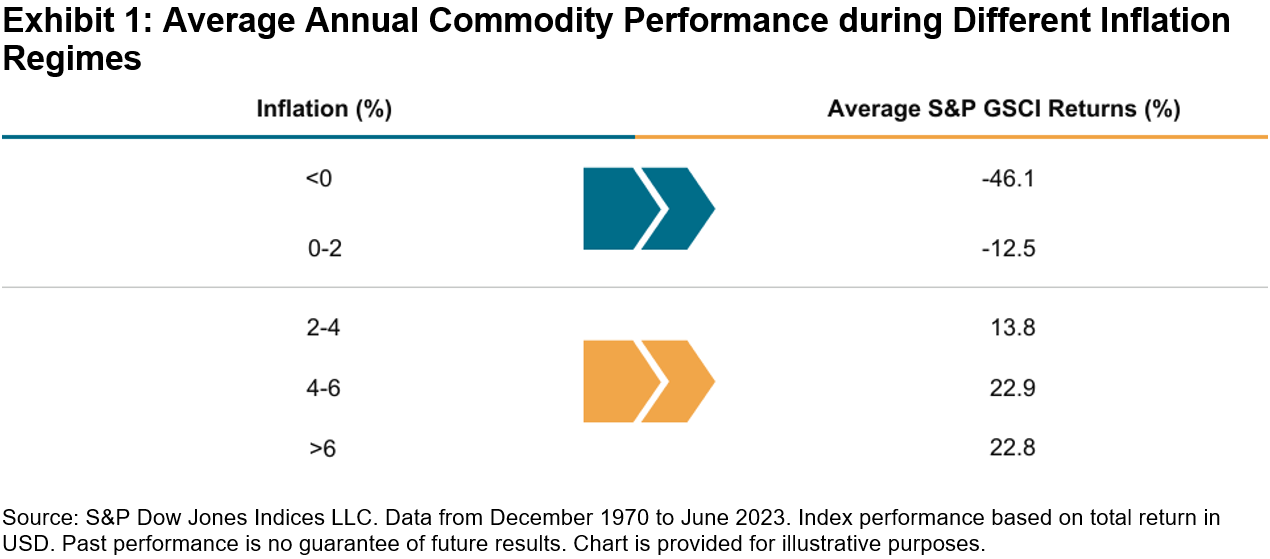
The main contributors to the outsized performance last month were the energy commodities. Supply cuts from Saudi Arabia and Russia were the strongest catalysts as demand persisted globally. The headline S&P GSCI currently has a weight in energy commodities of over 60% due to its construction as a world production-weighted index. Market participants replicating it as an inflation hedge witnessed higher returns recently in comparison to other comparable commodity indices, which tend to be more equally weighted. Energy commodities tend to have the highest inflation beta or sensitivity to changes in inflation over time. Other commodities used in petroleum products such as sugar also rose by 5%, with its heavy use in ethanol in South America.

The S&P GSCI Industrial Metals rose 3.51% in the third quarter, with the five metals’ prices continuing to bounce back from tough first half 2023 performances. Expectations for China’s economy to accelerate were never met, but stimulus measures are slowly being introduced. China tends to be the biggest contributor to metal demand and this has the potential to still be the case during the energy transition. The International Energy Agency (IEA) updated its Net Zero Roadmap in September, when it said electricity is poised to emerge as the new oil of the global energy system. Metal demand will likely pick up over time due to the use of certain industrial, precious and rare earth metals increasing by many times more across a wide span of clean energy technologies.

The S&P GSCI Agriculture fell 4.35% and the S&P GSCI Precious Metals fell 3.76% in the third quarter. Both sectors, along with most commodities, were hit by the headwind of a rising U.S. dollar. For the agriculture commodities, lower soybean usage and surprisingly larger wheat production figures were reported in the latest USDA quarterly stocks report. Within the precious metals, gold and silver both fell as real rates continued to rise. Gold tends to be inversely correlated to real rates but this hasn’t been the case for most of 2023. Recent heavy central bank bullion buying may have been the reason for gold’s resilience so far in 2023.

The posts on this blog are opinions, not advice. Please read our Disclaimers.

Tracking Shariah Compliance with Indices

How are indices helping expand the range of Shariah-compliant tools for market participants? S&P DJI’s John Welling and Chimera Capital’s Sherif Salem join Dubai Financial Markets’ Eric Salomons for a look inside how S&P DJI’s Shariah-compliant and Sukuk indices are helping investors evaluate and access local, regional, and global markets while adhering to Islamic law and aligning with client objectives.

The posts on this blog are opinions, not advice. Please read our Disclaimers.

Measuring the Global Clean Energy Opportunity Set

Climate change, resource scarcity and the transition to a low-carbon economy are creating robust, long-term demand for global clean energy solutions. Look inside the S&P Global Clean Energy Index, an innovative index built on robust datasets that seeks to track pure, liquid and transparent exposure to clean energy.

The posts on this blog are opinions, not advice. Please read our Disclaimers.

Exploring the Case for Global Diversification in the Middle East

What’s the role of global diversification in the Middle East? S&P DJI’s John Welling and Chimera Capital’s Sherif Salem join Dubai Financial Markets’ Eric Salomons for a closer look at the growing role of passive investing in the Middle East and how investors are using indices to inform allocations.

The posts on this blog are opinions, not advice. Please read our Disclaimers.

Introducing the Dispersion Index (DSPX)

Contributor Image
Tim Edwards

Managing Director, Index Investment Strategy

S&P Dow Jones Indices

At 9:45 am Eastern Time on Sept. 27, 2023, a new index began publishing under the ticker DSPXSM, with an initial live value of 26.81. This index, the Cboe S&P 500® Dispersion Index (the Dispersion Index to its friends), might be loosely described as a “VIX® for dispersion.” But what is it? Why is it called that? And what is it good for? A short introduction is in order.

Measuring Market Opportunity

Dispersion is a fundamental measure of risk and opportunity in the stock market; it measures how differently stocks are performing, or are expected to perform. Dispersion is a complementary measure to market volatility; the latter measures overall fluctuations in stock averages like the S&P 500, while dispersion measures fluctuations in stocks relative to each other.

We measure dispersion historically by the observed spread of stock returns (as in S&P DJI’s regular monthly dispersion dashboard). Separately, we can derive an expectation for future dispersion from listed options. The Dispersion Index is based on such expectations for dispersion over the next 30 calendar days.

The Dispersion Index is published as an annualized figure, so that the initial DSPX level of 26.81 implies a market expectation that the spread of annualized S&P 500 stock returns will have a standard deviation of 26.81% over the next month. Exhibit 1 shows the historical hypothetical levels of the index over the period for which data are available.

A Market Standard for Tradeable U.S. Equity Dispersion

The Dispersion Index was launched in collaboration between Cboe and S&P Dow Jones Indices, using the Cboe Volatility Index® (VIX) and the S&P 500 universe as core building blocks. The VIX methodology is applied to both S&P 500 index options and options on selected S&P 500 constituents, with maturities either side of the next 30 days. The difference between the option prices for the S&P 500’s single-stock constituents and prices for options on the index tells us how much more movement the market anticipates in stocks. This is, in essence, an expectation for future dispersion. Full details of the calculation are available in the methodology.

What DSPX Tells Us: The Opportunity Index

The Dispersion Index’s stablemate, VIX, is known for offering a premier gauge of market sentiment—hence its moniker as “The Fear Index,” as well as being known as an often inaccurate but nonetheless useful predictor for future volatility.

The information encoded in the Dispersion Index is related, but different: by measuring how differently stocks are expected to perform, dispersion assesses the magnitude of the potential rewards (or potential embarrassment) from active stock selection. In this sense, DSPX might be more appropriately monikered as “The Opportunity Index.”

Illustrating its potential credentials as a “predictor” of future stock-picking opportunities, Exhibit 2 compares the index level to the actual S&P 500 dispersion measured over the subsequent 30 calendar days. Like its stablemate, DSPX would have been an often inaccurate but nonetheless informative indicator.

The use of the S&P 500 as the starting equity universe and the integration of the VIX methodology connects the Dispersion Index to a broad ecosystem of tradeable equity and volatility products and means that DSPX may in the future become “tradeable” itself.

Until such time, by collaborating to create the Dispersion Index, Cboe and S&P Dow Jones Indices are providing market participants with a real-time, comprehensive indicator for near-term dispersion in the world’s largest equity market.

The posts on this blog are opinions, not advice. Please read our Disclaimers.