
Climate change, resource scarcity and the transition to a low-carbon economy are creating robust, long-term demand for global clean energy solutions. Look inside the S&P Global Clean Energy Index, an innovative index built on robust datasets that seeks to track pure, liquid and transparent exposure to clean energy.
The posts on this blog are opinions, not advice. Please read our Disclaimers.
Measuring the Global Clean Energy Opportunity Set
Exploring the Case for Global Diversification in the Middle East
Introducing the Dispersion Index (DSPX)
Splitting Size in U.S. Equities: S&P DJI versus MSCI in H1 2023
Balancing High Yield and Growing Dividends in a Sector-Neutral Framework with the S&P Sector-Neutral High Yield Dividend Aristocrats
Measuring the Global Clean Energy Opportunity Set
Exploring the Case for Global Diversification in the Middle East
- Categories Equities
- Tags Active vs. Passive, Chimera Capital, Dubai Financial Markets, Eric Salomons, ESG, ETFs, factors, global diversification, Index innovations, index-based strategies, IPOs, John Welling, large-cap equities, Middle East, S&P 500, Sherif Salem, sustainability, thematics, U.S. Equities, UAE
What’s the role of global diversification in the Middle East? S&P DJI’s John Welling and Chimera Capital’s Sherif Salem join Dubai Financial Markets’ Eric Salomons for a closer look at the growing role of passive investing in the Middle East and how investors are using indices to inform allocations.
The posts on this blog are opinions, not advice. Please read our Disclaimers.Introducing the Dispersion Index (DSPX)

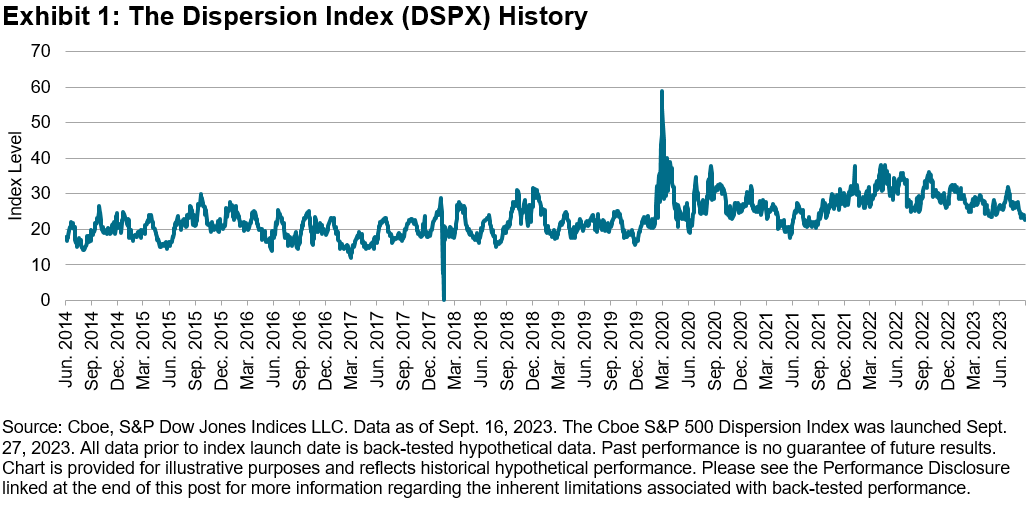
At 9:45 am Eastern Time on Sept. 27, 2023, a new index began publishing under the ticker DSPXSM, with an initial live value of 26.81. This index, the Cboe S&P 500® Dispersion Index (the Dispersion Index to its friends), might be loosely described as a “VIX® for dispersion.” But what is it? Why is it called that? And what is it good for? A short introduction is in order.
Measuring Market Opportunity
Dispersion is a fundamental measure of risk and opportunity in the stock market; it measures how differently stocks are performing, or are expected to perform. Dispersion is a complementary measure to market volatility; the latter measures overall fluctuations in stock averages like the S&P 500, while dispersion measures fluctuations in stocks relative to each other.
We measure dispersion historically by the observed spread of stock returns (as in S&P DJI’s regular monthly dispersion dashboard). Separately, we can derive an expectation for future dispersion from listed options. The Dispersion Index is based on such expectations for dispersion over the next 30 calendar days.
The Dispersion Index is published as an annualized figure, so that the initial DSPX level of 26.81 implies a market expectation that the spread of annualized S&P 500 stock returns will have a standard deviation of 26.81% over the next month. Exhibit 1 shows the historical hypothetical levels of the index over the period for which data are available.
A Market Standard for Tradeable U.S. Equity Dispersion
The Dispersion Index was launched in collaboration between Cboe and S&P Dow Jones Indices, using the Cboe Volatility Index® (VIX) and the S&P 500 universe as core building blocks. The VIX methodology is applied to both S&P 500 index options and options on selected S&P 500 constituents, with maturities either side of the next 30 days. The difference between the option prices for the S&P 500’s single-stock constituents and prices for options on the index tells us how much more movement the market anticipates in stocks. This is, in essence, an expectation for future dispersion. Full details of the calculation are available in the methodology.
What DSPX Tells Us: The Opportunity Index
The Dispersion Index’s stablemate, VIX, is known for offering a premier gauge of market sentiment—hence its moniker as “The Fear Index,” as well as being known as an often inaccurate but nonetheless useful predictor for future volatility.
The information encoded in the Dispersion Index is related, but different: by measuring how differently stocks are expected to perform, dispersion assesses the magnitude of the potential rewards (or potential embarrassment) from active stock selection. In this sense, DSPX might be more appropriately monikered as “The Opportunity Index.”
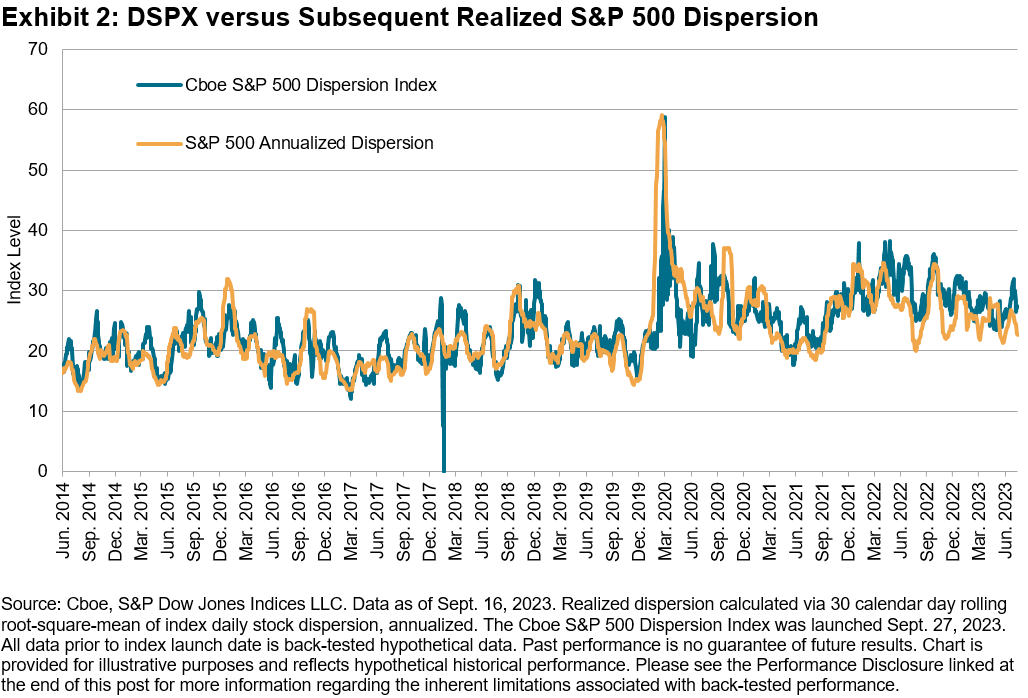
Illustrating its potential credentials as a “predictor” of future stock-picking opportunities, Exhibit 2 compares the index level to the actual S&P 500 dispersion measured over the subsequent 30 calendar days. Like its stablemate, DSPX would have been an often inaccurate but nonetheless informative indicator.
The use of the S&P 500 as the starting equity universe and the integration of the VIX methodology connects the Dispersion Index to a broad ecosystem of tradeable equity and volatility products and means that DSPX may in the future become “tradeable” itself.
Until such time, by collaborating to create the Dispersion Index, Cboe and S&P Dow Jones Indices are providing market participants with a real-time, comprehensive indicator for near-term dispersion in the world’s largest equity market.
The posts on this blog are opinions, not advice. Please read our Disclaimers.Splitting Size in U.S. Equities: S&P DJI versus MSCI in H1 2023

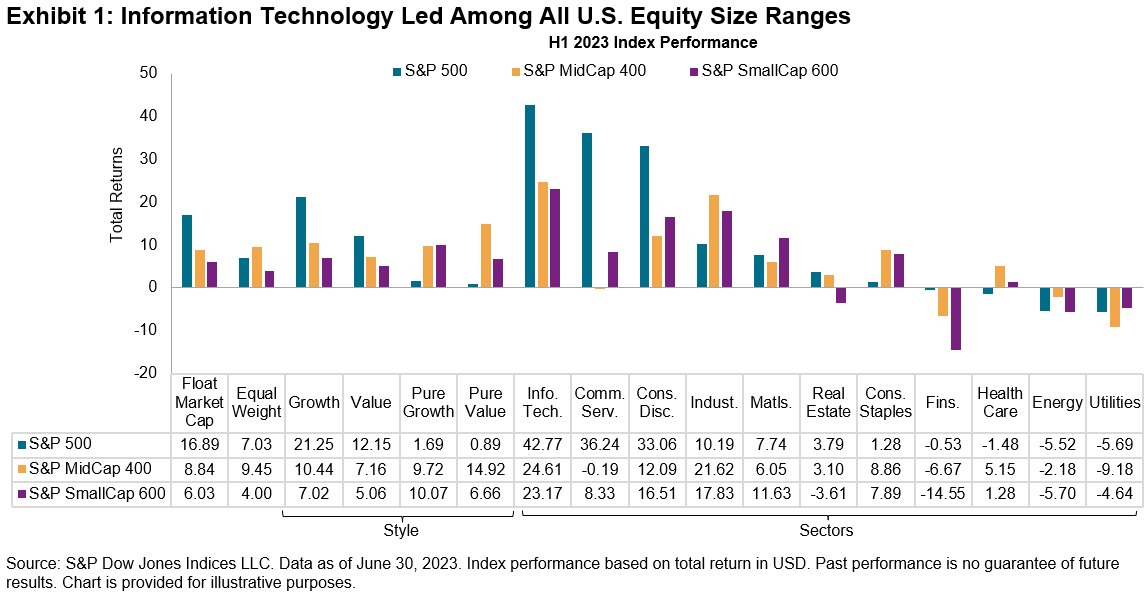
The first half of 2023 saw a strong rebound from 2022 for equities: the S&P 500® gained 17% as the U.S. outperformed the S&P Global Ex-U.S. BMI (up 10%). Information Technology led the way across the U.S. cap spectrum, possibly reflecting investors’ expectations regarding the potential impact of artificial intelligence.
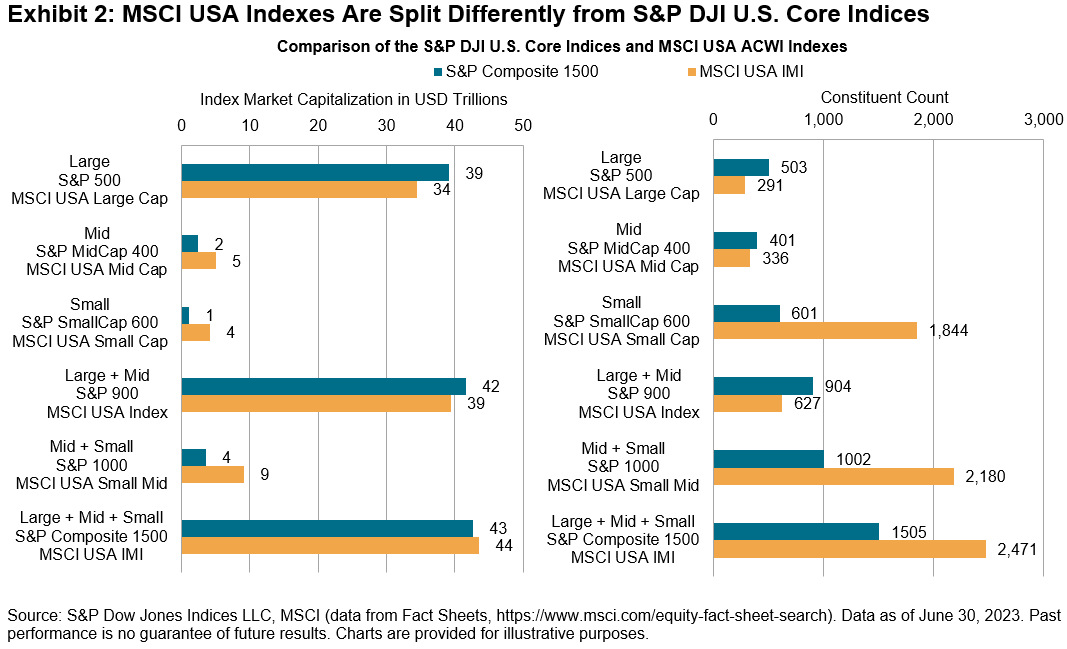
The S&P Composite 1500® combines the S&P 500, S&P MidCap 400® and S&P SmallCap 600®, representing the investable portion of the large-, mid- and small-cap U.S. equity market, respectively. While other index series like the MSCI USA Investable Market Index (IMI), Russell 3000 and CRSP US Total Market aim to measure the U.S. market, differences in index construction can lead to clear distinctions in size and composition, as illustrated by Exhibit 2.
S&P DJI U.S. Core Equity Indices underperformed their MSCI USA Index counterparts in H1 2023, typically driven by a lower exposure to Information Technology, which was the best performing sector. However, when looking at 20-year and nearly 30-year time horizons, S&P DJI U.S. Core Equity Indices typically outperformed in the long-term.
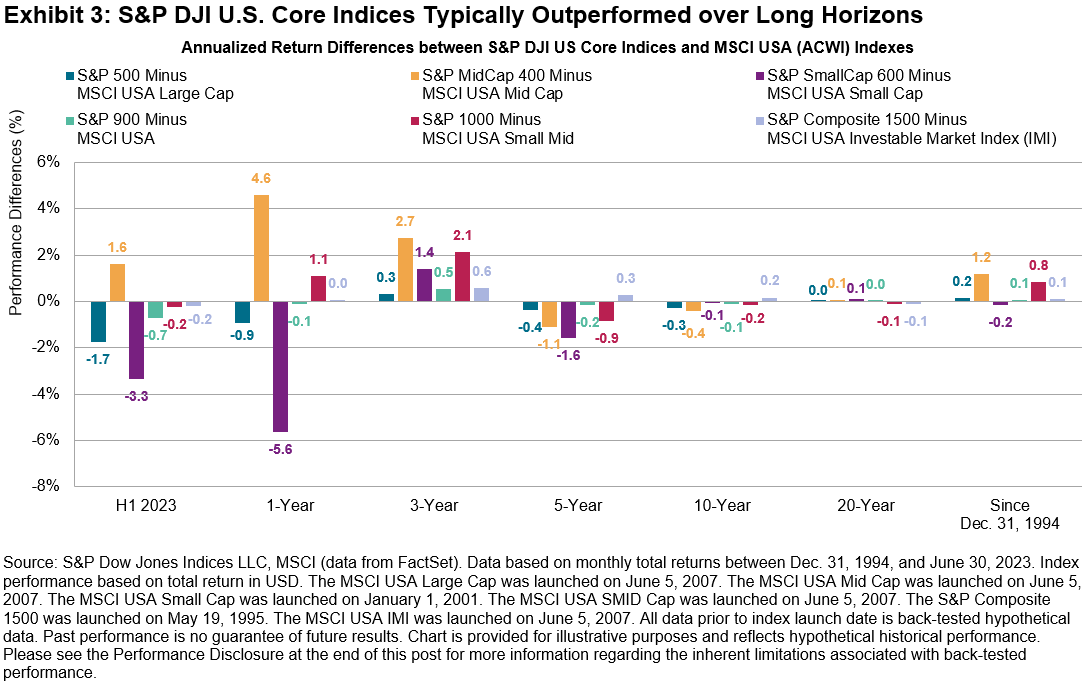
One relative bright spot for the S&P DJI U.S. Core Equities in H1 2023 was the S&P MidCap 400. Despite the S&P 400® having a lower exposure to Information Technology than MSCI USA Mid Cap of 5.4%, the S&P 400 outperformed by 2% in H1 2023, extending its 2022 outperformance of 5%. The S&P 400 also outperformed the S&P 500 Equal Weight Index by nearly 2%.
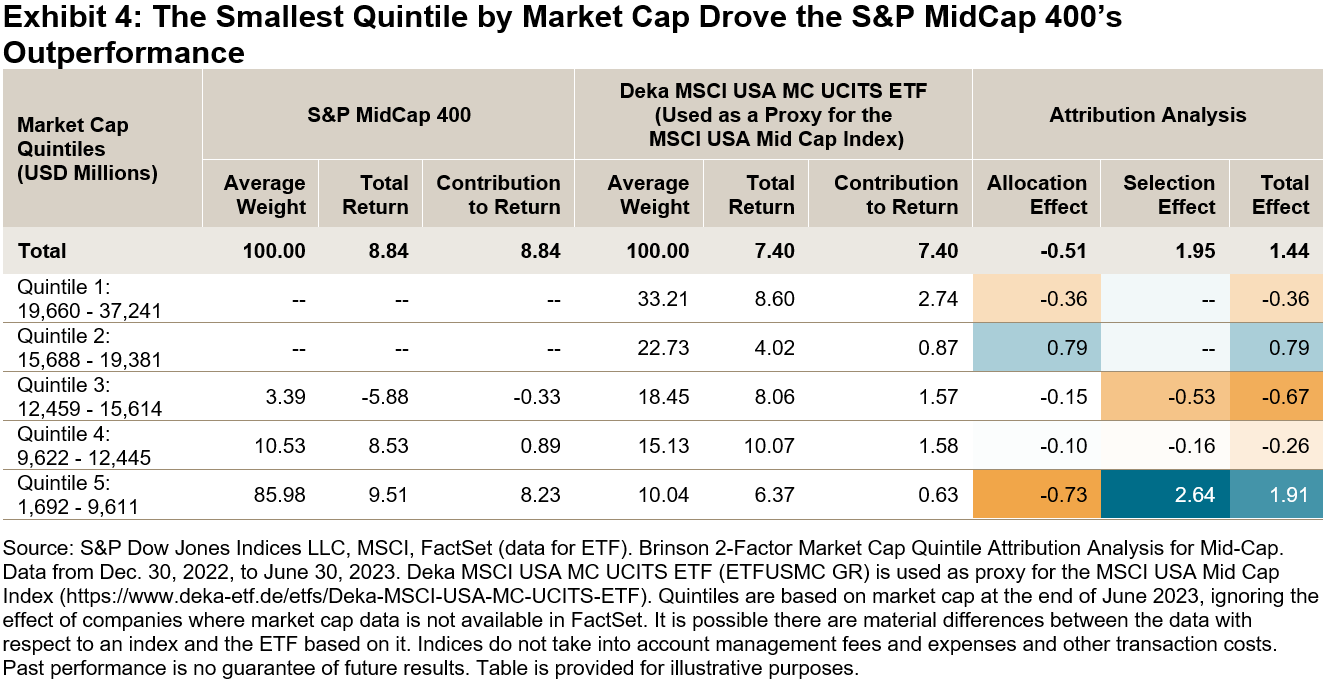
There are several potential candidates to explain the S&P 400’s relative performance versus the MSCI USA Mid Cap Index. For example, size, earnings screen and sector exposures. To better understand some of these factors, we conducted an analysis comparing the relative size, sector and stock selection effects between the two mid-cap indices.
Overall, the choice of companies within S&P 400 sectors mattered more than the sector and size exposures in isolation. When splitting our two universes into quintiles, Exhibit 4 shows that more than 50% of the MSCI USA Mid Cap Index belonged to the largest two size quintiles at the end of H1 2023. The total allocation effect in H1 2023 was negative. In contrast, the S&P MidCap 400 had more exposure to the smallest quintiles, with the selection effect in the Quintile 5 driving its outperformance in the first half 2023.
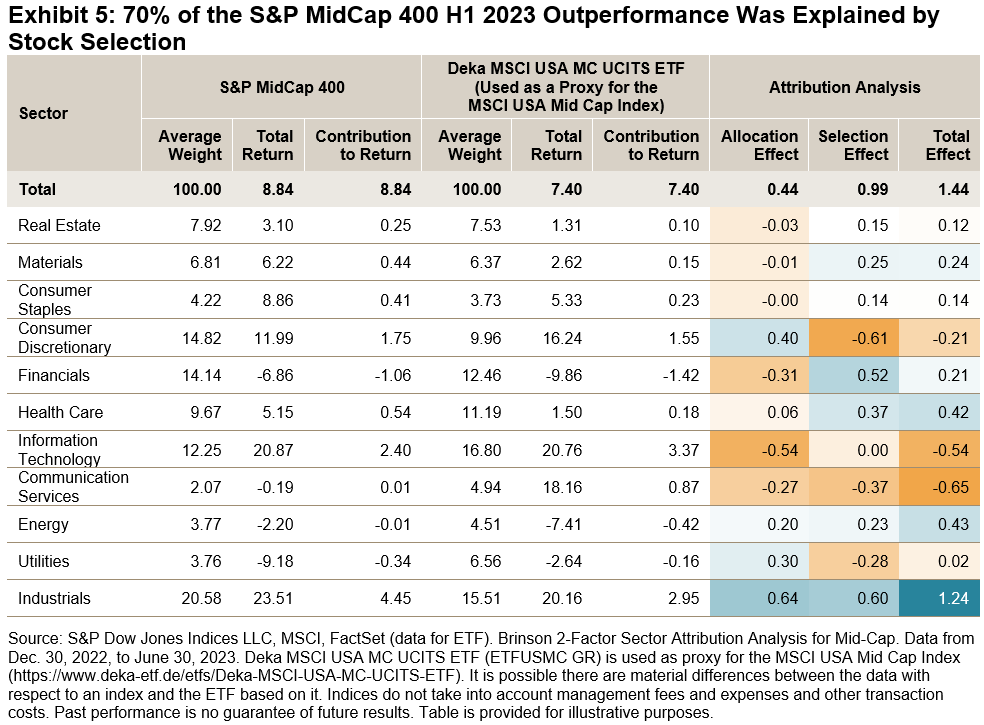
The choice of stocks explained 70% of the S&P 400’s relative outperformance. Exhibit 5 shows the Two-Factor Brinson Attribution of the S&P 400 against the MSCI USA Mid-Cap Index by GICS® Sector and analyzes how much of the S&P 400’s H1 2023 relative return can be explained by differences in sector exposures (allocation effect) versus the choice of constituents in each sector (the selection effect). When looking at sectors, a lower exposure to Information Technology detracted from performance, an overweight to Industrials was one component to outperformance in H1 2023, which rose 22% in H1 as shown in Exhibit 1. However, in several instances the allocation effect of sectors was neutral or negative (e.g., Financials), but a strong selection effect (choice of stocks) within sectors in those instances meant that the total effect was positive.
While both index series are designed to measure the performance of large, mid and small size segments and various combinations of the U.S. equity market, differences in defining the size split and index construction (such as the S&P Composite 1500’s earning screen) have historically resulted in contrasting size exposure, index characteristics and performance.
The posts on this blog are opinions, not advice. Please read our Disclaimers.Balancing High Yield and Growing Dividends in a Sector-Neutral Framework with the S&P Sector-Neutral High Yield Dividend Aristocrats

In September 2022, S&P DJI was pleased to add the S&P Sector-Neutral High Yield Dividend Aristocrats® to the S&P Dividend Aristocrats Index Series. While most dividend indices have notable sector under- and overweights versus their underlying benchmark, this index is the first in the series to be sector neutral. As such, this index emphasizes dividend growth and high yield while keeping the same sector weights as its benchmark, the S&P Composite 1500®. In this blog, we will review the methodology of this index and explain how it may serve as a more balanced dividend growth strategy that is more closely aligned with its benchmark.
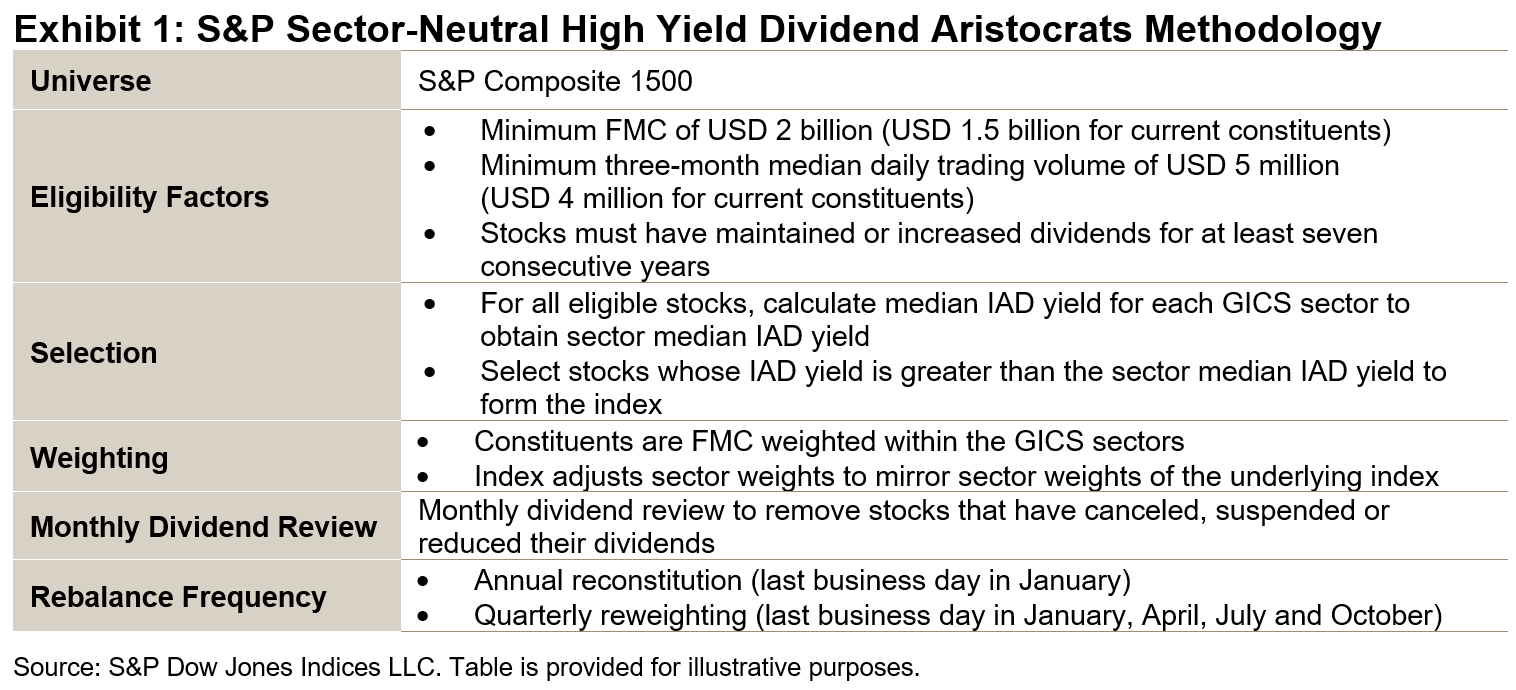
Exhibit 1 summarizes the methodology construction of the S&P Sector-Neutral High Yield Dividend Aristocrats. A hallmark of the S&P Dividend Aristocrats Indices is the dividend growth requirement, which typically requires constituents to raise their total dividend per share every year for a minimum number of years. To facilitate sector-neutrality in this index, the minimum was set at seven years of stable or growing dividends. This threshold ensures that enough constituents from each sector qualify, while incorporating many of the desired characteristics of a dividend growth strategy.
Companies that meet the dividend growth requirement must also have an indicated annual dividend (IAD) yield that is greater than the sector median yield. Constituents are weighted by float market cap (FMC) within the GICS® sectors. To incorporate sector-neutrality, the index adjusts the sector weights to mirror the sector weights of the S&P Composite 1500.
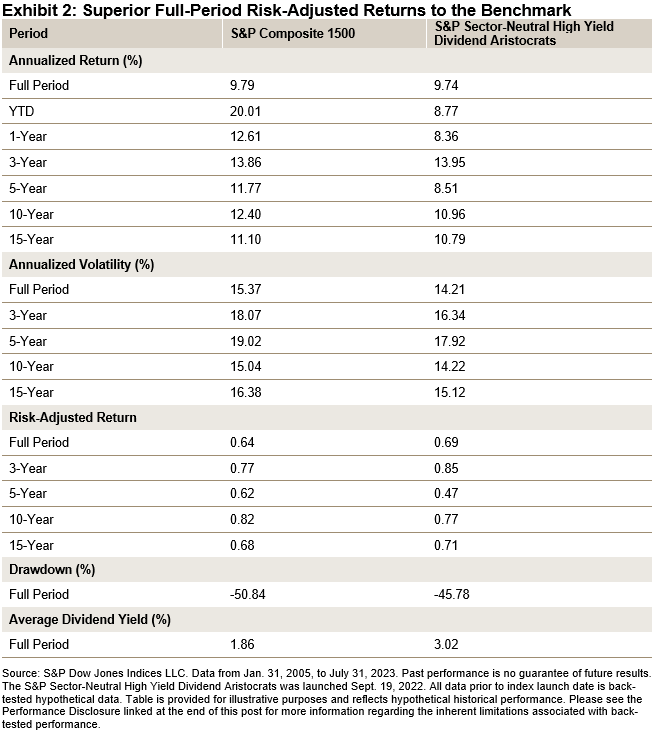
As Exhibit 2 shows, the index’s absolute performance versus the benchmark has been almost identical since its first value date (Jan. 31, 2005). Importantly, however, the S&P Sector-Neutral High Yield Dividend Aristocrats has exhibited lower volatility relative to the benchmark, leading to superior risk-adjusted returns. Additionally, the maximum drawdown over the period was approximately 5% lower.
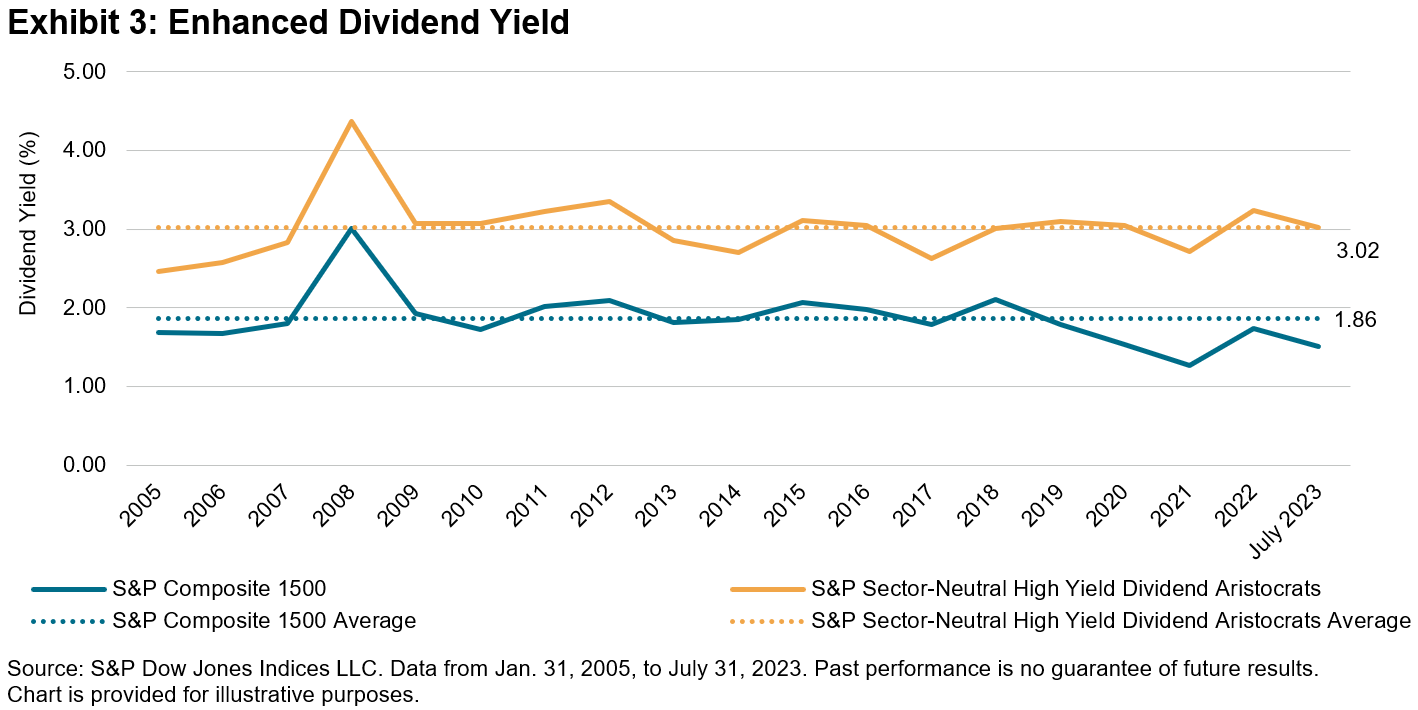
As Exhibit 3 shows, the index’s dividend yield has been larger than the S&P Composite 1500 every year since 2005. Furthermore, the average dividend yield for the S&P Sector-Neutral High Yield Dividend Aristocrats was 3.02% versus 1.86% for the benchmark over the same period. The significant uptick in dividend yield is a positive result of the index only selecting constituents whose IAD yield is greater than the sector median IAD yield.
As Exhibit 4 shows, the index has historically provided downside protection relative to the S&P Composite 1500, exhibiting an 86.5% downside capture ratio. This metric supports the notion that the S&P Dividend Aristocrats methodology provides stability since the ability to consistently maintain or grow dividends every year through different economic environments can be an indication of financial strength and discipline.
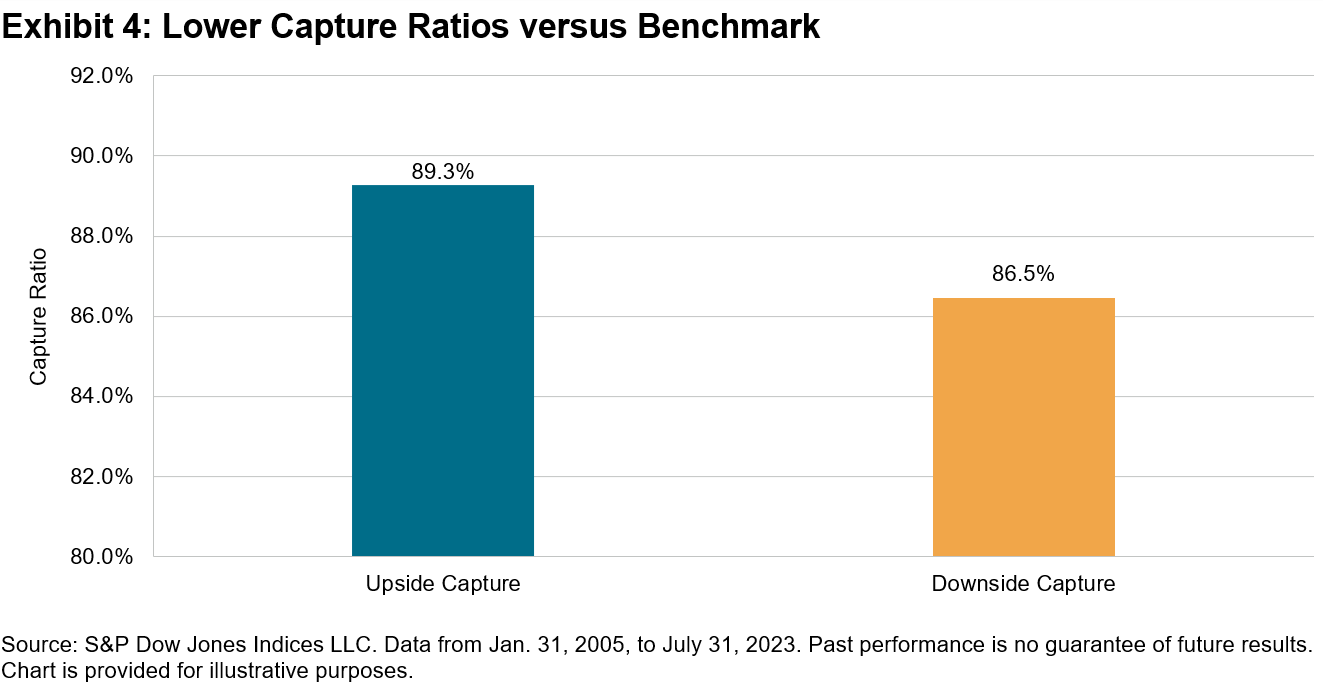
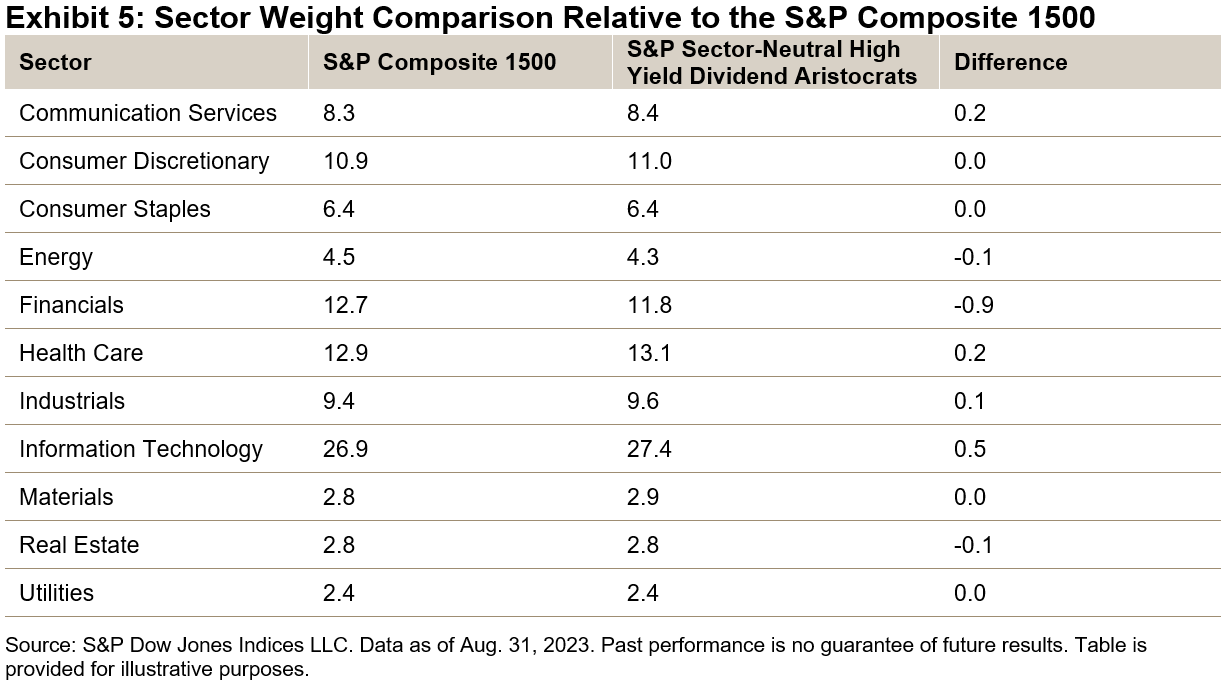
Exhibit 5 highlights the considerable similarity in sector weights due to the sector-neutral approach implemented in the methodology. Small deviations in sector weights can be expected due to constituent performance within the sectors between reweightings.
Historically, the S&P Sector-Neutral High Yield Dividend Aristocrats has had comparable returns and sector weights relative to its benchmark, while also providing enhanced dividend yields and downside protection. For investors seeking a balanced dividend strategy focused both on dividend growth and yield, the S&P Sector Neutral High Yield Dividend Aristocrats is a compelling option to consider.
The posts on this blog are opinions, not advice. Please read our Disclaimers.