Get Indexology® Blog updates via email.

In This List

Splitting Size in U.S. Equities: S&P DJI versus MSCI in H1 2023

Balancing High Yield and Growing Dividends in a Sector-Neutral Framework with the S&P Sector-Neutral High Yield Dividend Aristocrats

Analyzing Active in Australia: Lessons from the SPIVA Australia Mid-Year 2023 Scorecard

Innovating for Insurance: Charting a "Smarter" Path to the S&P 500

S&P U.S. Indices Mid-Year 2023: Analyzing Relative Returns to CRSP

Splitting Size in U.S. Equities: S&P DJI versus MSCI in H1 2023

Contributor Image
Sherifa Issifu

Senior Analyst, U.S. Equity Indices

S&P Dow Jones Indices

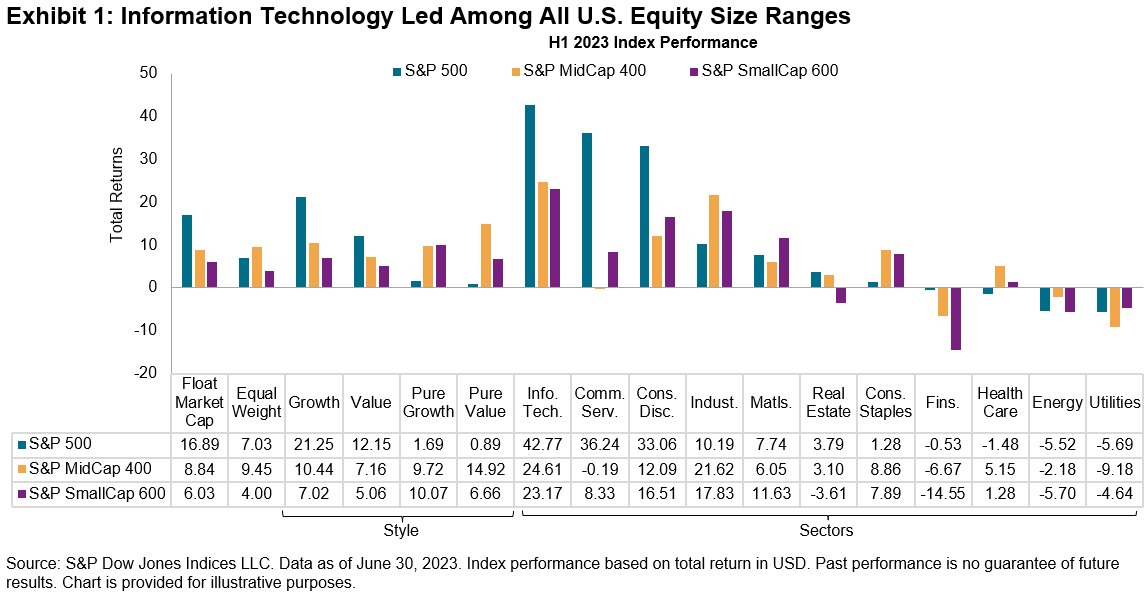
The first half of 2023 saw a strong rebound from 2022 for equities: the S&P 500® gained 17% as the U.S. outperformed the S&P Global Ex-U.S. BMI (up 10%). Information Technology led the way across the U.S. cap spectrum, possibly reflecting investors’ expectations regarding the potential impact of artificial intelligence.

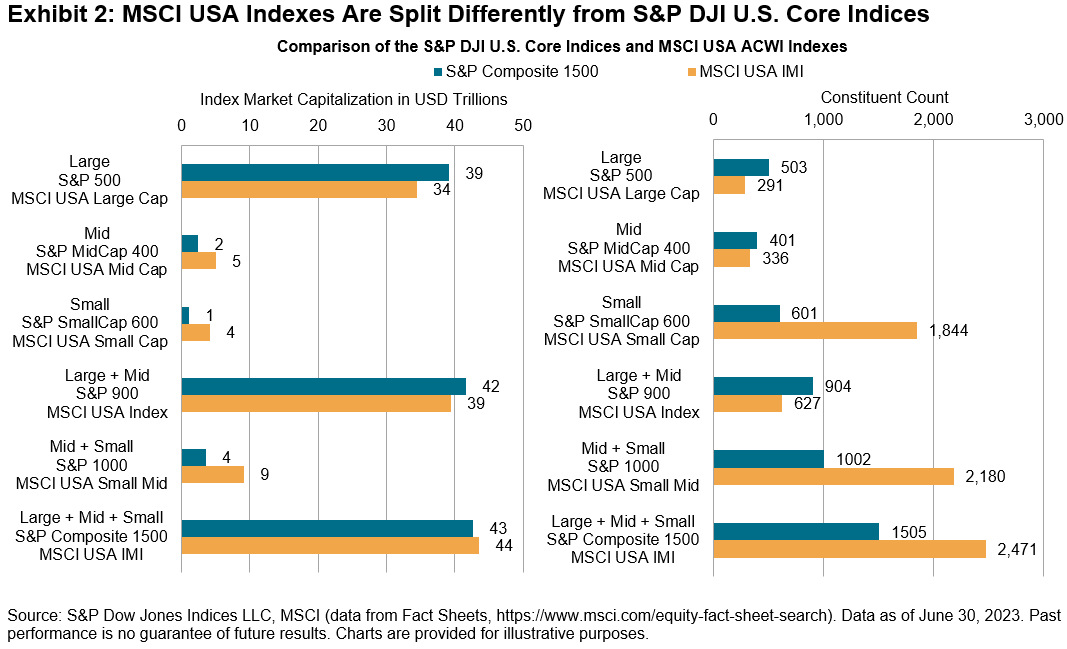
The S&P Composite 1500® combines the S&P 500, S&P MidCap 400® and S&P SmallCap 600®, representing the investable portion of the large-, mid- and small-cap U.S. equity market, respectively. While other index series like the MSCI USA Investable Market Index (IMI), Russell 3000 and CRSP US Total Market aim to measure the U.S. market, differences in index construction can lead to clear distinctions in size and composition, as illustrated by Exhibit 2.

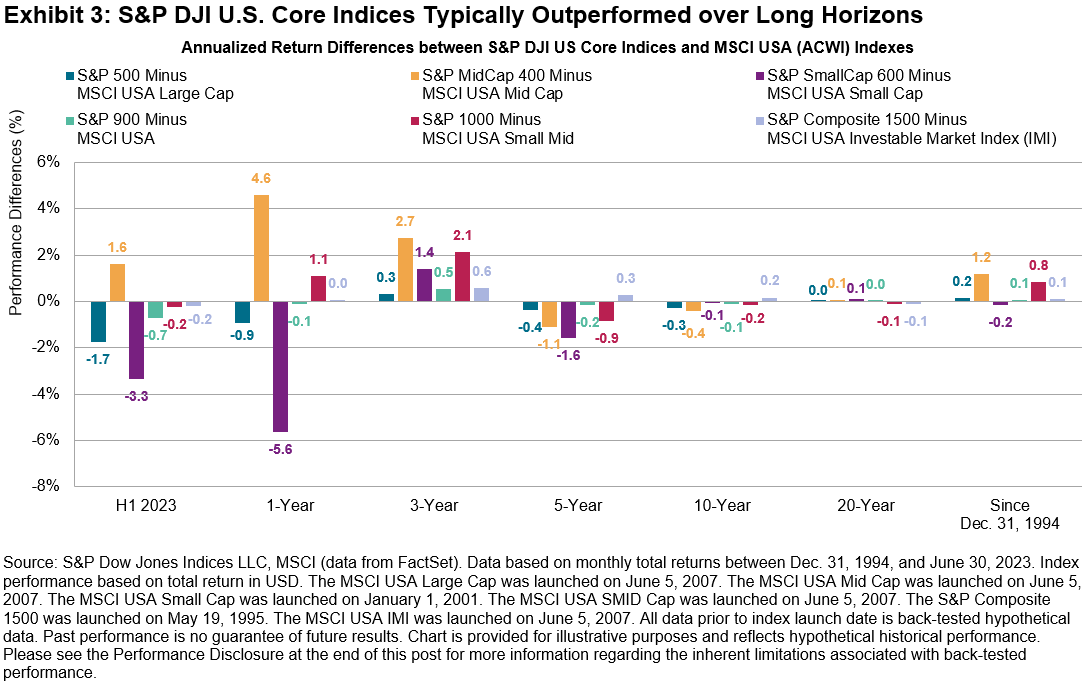
S&P DJI U.S. Core Equity Indices underperformed their MSCI USA Index counterparts in H1 2023, typically driven by a lower exposure to Information Technology, which was the best performing sector. However, when looking at 20-year and nearly 30-year time horizons, S&P DJI U.S. Core Equity Indices typically outperformed in the long-term.

One relative bright spot for the S&P DJI U.S. Core Equities in H1 2023 was the S&P MidCap 400. Despite the S&P 400® having a lower exposure to Information Technology than MSCI USA Mid Cap of 5.4%, the S&P 400 outperformed by 2% in H1 2023, extending its 2022 outperformance of 5%. The S&P 400 also outperformed the S&P 500 Equal Weight Index by nearly 2%.

There are several potential candidates to explain the S&P 400’s relative performance versus the MSCI USA Mid Cap Index. For example, size, earnings screen and sector exposures. To better understand some of these factors, we conducted an analysis comparing the relative size, sector and stock selection effects between the two mid-cap indices.

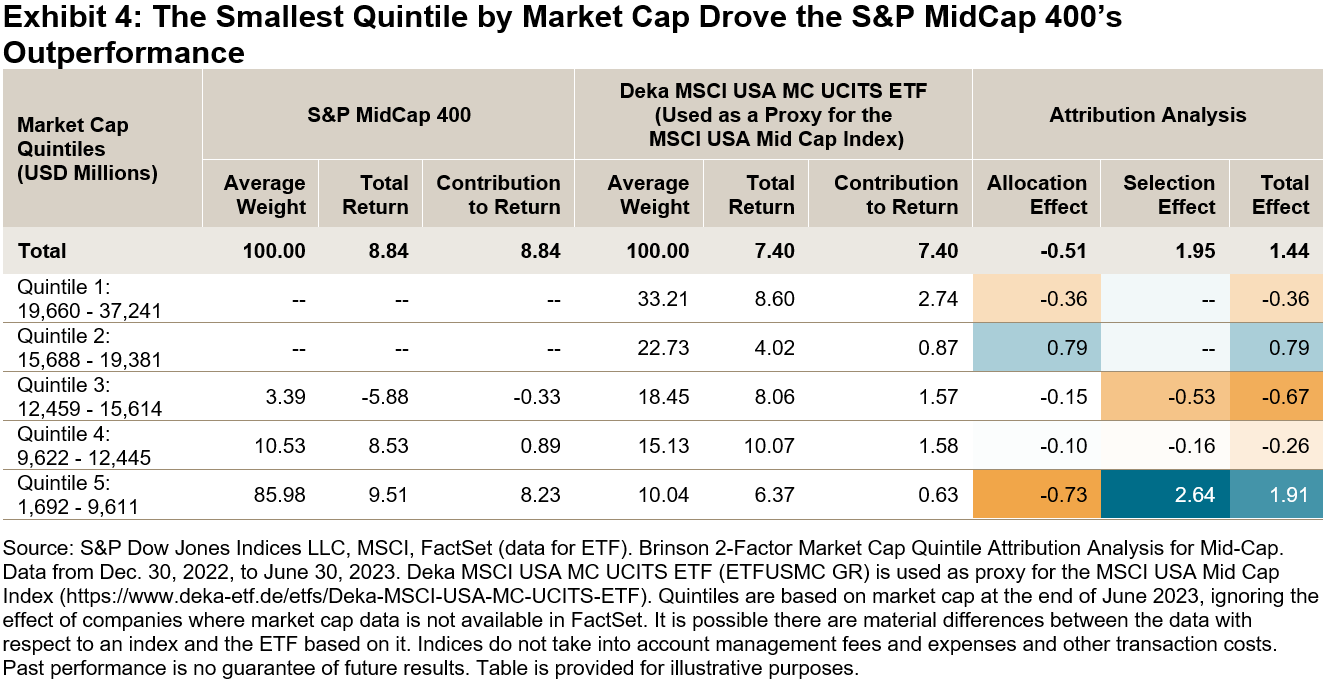
Overall, the choice of companies within S&P 400 sectors mattered more than the sector and size exposures in isolation. When splitting our two universes into quintiles, Exhibit 4 shows that more than 50% of the MSCI USA Mid Cap Index belonged to the largest two size quintiles at the end of H1 2023. The total allocation effect in H1 2023 was negative. In contrast, the S&P MidCap 400 had more exposure to the smallest quintiles, with the selection effect in the Quintile 5 driving its outperformance in the first half 2023.

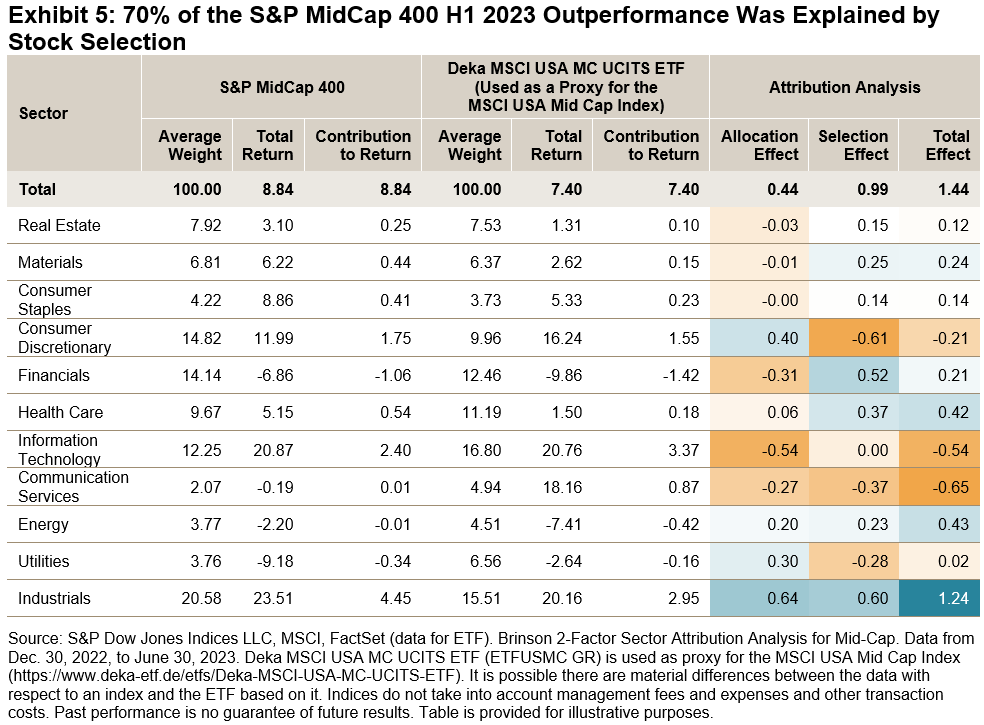
The choice of stocks explained 70% of the S&P 400’s relative outperformance. Exhibit 5 shows the Two-Factor Brinson Attribution of the S&P 400 against the MSCI USA Mid-Cap Index by GICS® Sector and analyzes how much of the S&P 400’s H1 2023 relative return can be explained by differences in sector exposures (allocation effect) versus the choice of constituents in each sector (the selection effect). When looking at sectors, a lower exposure to Information Technology detracted from performance, an overweight to Industrials was one component to outperformance in H1 2023, which rose 22% in H1 as shown in Exhibit 1. However, in several instances the allocation effect of sectors was neutral or negative (e.g., Financials), but a strong selection effect (choice of stocks) within sectors in those instances meant that the total effect was positive.

While both index series are designed to measure the performance of large, mid and small size segments and various combinations of the U.S. equity market, differences in defining the size split and index construction (such as the S&P Composite 1500’s earning screen) have historically resulted in contrasting size exposure, index characteristics and performance.

The posts on this blog are opinions, not advice. Please read our Disclaimers.

Balancing High Yield and Growing Dividends in a Sector-Neutral Framework with the S&P Sector-Neutral High Yield Dividend Aristocrats

Contributor Image
George Valantasis

Associate Director, Factors and Dividends

S&P Dow Jones Indices

In September 2022, S&P DJI was pleased to add the S&P Sector-Neutral High Yield Dividend Aristocrats® to the S&P Dividend Aristocrats Index Series. While most dividend indices have notable sector under- and overweights versus their underlying benchmark, this index is the first in the series to be sector neutral. As such, this index emphasizes dividend growth and high yield while keeping the same sector weights as its benchmark, the S&P Composite 1500®. In this blog, we will review the methodology of this index and explain how it may serve as a more balanced dividend growth strategy that is more closely aligned with its benchmark.

Exhibit 1 summarizes the methodology construction of the S&P Sector-Neutral High Yield Dividend Aristocrats. A hallmark of the S&P Dividend Aristocrats Indices is the dividend growth requirement, which typically requires constituents to raise their total dividend per share every year for a minimum number of years. To facilitate sector-neutrality in this index, the minimum was set at seven years of stable or growing dividends. This threshold ensures that enough constituents from each sector qualify, while incorporating many of the desired characteristics of a dividend growth strategy.

Companies that meet the dividend growth requirement must also have an indicated annual dividend (IAD) yield that is greater than the sector median yield. Constituents are weighted by float market cap (FMC) within the GICS® sectors. To incorporate sector-neutrality, the index adjusts the sector weights to mirror the sector weights of the S&P Composite 1500.

As Exhibit 2 shows, the index’s absolute performance versus the benchmark has been almost identical since its first value date (Jan. 31, 2005). Importantly, however, the S&P Sector-Neutral High Yield Dividend Aristocrats has exhibited lower volatility relative to the benchmark, leading to superior risk-adjusted returns. Additionally, the maximum drawdown over the period was approximately 5% lower.

As Exhibit 3 shows, the index’s dividend yield has been larger than the S&P Composite 1500 every year since 2005. Furthermore, the average dividend yield for the S&P Sector-Neutral High Yield Dividend Aristocrats was 3.02% versus 1.86% for the benchmark over the same period. The significant uptick in dividend yield is a positive result of the index only selecting constituents whose IAD yield is greater than the sector median IAD yield.

As Exhibit 4 shows, the index has historically provided downside protection relative to the S&P Composite 1500, exhibiting an 86.5% downside capture ratio. This metric supports the notion that the S&P Dividend Aristocrats methodology provides stability since the ability to consistently maintain or grow dividends every year through different economic environments can be an indication of financial strength and discipline.

Exhibit 5 highlights the considerable similarity in sector weights due to the sector-neutral approach implemented in the methodology. Small deviations in sector weights can be expected due to constituent performance within the sectors between reweightings.

Historically, the S&P Sector-Neutral High Yield Dividend Aristocrats has had comparable returns and sector weights relative to its benchmark, while also providing enhanced dividend yields and downside protection. For investors seeking a balanced dividend strategy focused both on dividend growth and yield, the S&P Sector Neutral High Yield Dividend Aristocrats is a compelling option to consider.

The posts on this blog are opinions, not advice. Please read our Disclaimers.

Analyzing Active in Australia: Lessons from the SPIVA Australia Mid-Year 2023 Scorecard

Contributor Image
Anu Ganti

U.S. Head of Index Investment Strategy

S&P Dow Jones Indices

Since 2013, our SPIVA® Australia Scorecards have shown that the majority of actively managed Australian equity funds have typically underperformed the S&P/ASX 200. According to the recently published SPIVA Australia Mid-Year 2023 Scorecard, 55% of Australian Equity General fund managers lagged the S&P/ASX 200 in the first half of 2023. 

Results for some fund categories were bleaker, with 74% of International Equity General fund managers underperforming the S&P Developed Ex-Australia LargeMidCap in the first half of 2023. We can use style bias, which plays a major role in explaining active manager outperformance, to disentangle this mixed set of results. For example, in our SPIVA report, we found that domestic equity managers may have benefited from exposure to overseas markets, which have outperformed Australian large caps so far this year.

However, style bias can be a double-edged sword, as Australian international equity managers might have faced headwinds from the outperformance of the U.S. relative to other international markets. In Australian dollar terms, the S&P 500® outperformed the S&P Developed Ex-U.S. LargeMidCap1 by 5% over the six-month period ending in June. This is a moderate degree of relative strength by historical standards, as we observe in Exhibit 1: 2013, 2014, 2016 and 2021 were years of significant U.S. outperformance in which, perhaps not coincidentally, we also reported the highest international active fund underperformance rates of any SPIVA report, suggesting a possible aggregate underweight to U.S. equities relative to the benchmark.2

Meanwhile, Australian Bonds funds performed relatively better than their large-cap equity counterparts, with a majority outperformance of 55%. Again, perhaps venturing outside of Australia to gain credit exposures played a favorable role. Exhibit 2 illustrates that active Australian Bonds funds have tended to outperform when globally domiciled or issued Australian dollar-denominated corporate bonds of similar credit quality have performed well relative to their locally issued peers. As of mid-year 2023, the S&P Australia Investment Grade Corporate Bond Index outperformed the benchmark S&P/ASX Australian Fixed Interest 0+ Index by 1%.

Style biases come in many forms and can help explain the likelihood of active outperformance across both equities and fixed income markets. Understanding these biases and distinguishing them from true security selection skill may provide valuable insights for Australian asset owners when making manager selection decisions.

The author would like to thank Grace Stoddart for her contributions to this post.


1 S&P Developed Ex-U.S. LargeMidCap had a 6% weight in Australia as of August 31, 2023.

2 S&P Developed Ex-Australia LargeMidCap had a 68% weight in the U.S. as of August 31, 2023.

The posts on this blog are opinions, not advice. Please read our Disclaimers.

Innovating for Insurance: Charting a "Smarter" Path to the S&P 500

How can an index adjust to prevailing market conditions by design? Meet the S&P 500 IQ Index, a dynamic risk control index that uses intraday technology to rapidly respond to changing markets, increasing S&P 500 exposure when markets are stable and leaning into cash during times of volatility.

The posts on this blog are opinions, not advice. Please read our Disclaimers.

S&P U.S. Indices Mid-Year 2023: Analyzing Relative Returns to CRSP

Contributor Image
Cristopher Anguiano

Senior Analyst, U.S. Equity Indices

S&P Dow Jones Indices

Following a challenging 2022, H1 2023 hosted a recovery among U.S. equities: the S&P 500® (up 16.9%) posted its fourth-best first half since 1996, and there were gains across the market cap spectrum. But on a relative basis, and in contrast to longer horizons, the S&P Core U.S. Equity Indices lagged their CRSP counterparts in H1 2023 (see Exhibit 1).

The informed reader knows that 2023 has been a strong year for mega caps and Information Technology companies. Indeed, the S&P 500 Information Technology (42.8%) and S&P 500 Top 50 (27.6%) posted their best first-half performance since 1996 (see Exhibit 2). Given that S&P DJI’s indices benefited from having less exposure to Information Technology in 2022, one might expect this helped to explain relative performance in H1 2023.

Exhibit 3 demonstrates that the S&P 500’s relative performance in H1 2023 was hindered by its lower weight in Information Technology. The Brinson attribution results show that less exposure to the Information Technology sector contributed negatively to the S&P 500 (-0.6%). Combined with the negative selection effect in Information Technology (-0.6%)—the S&P 500 and the CRSP US Mega Cap Index (as represented by the Vanguard Mega Cap Index Fund as a proxy) have different constituents owing to differences in index construction—likely around 50% of the S&P 500’s underperformance was attributed to Information Technology.

The consequences of Information Technology weight were even more apparent across style indices: Exhibit 4 shows that S&P Style Indices with more (less) exposure to Information Technology out- (under-) performed their CRSP counterparts in H1 2023. For example, the S&P 500 Value and S&P 900 Value posted their best relative H1 returns over the last 10 years, beating their CRSP counterparts by 9.9% and 9.3%, respectively. Conversely, the S&P 500 Growth and S&P 900 Growth posted their worst relative H1 returns over the same period, lagging their CRSP counterparts by 15.9% and 12.6%, respectively. Various CRSP index-based ETFs are used as proxies for the CRSP indices below.

The first half of 2023 once again highlighted the importance of index construction when assessing index characteristics, given different exposures can help to explain performance differences between indices with similar sounding objectives.

The posts on this blog are opinions, not advice. Please read our Disclaimers.