Get Indexology® Blog updates via email.

In This List

D-FENCE! Investigating Commodity Performance under a Defensive Fed

S&P 500 Low Volatility Index August 2023 Rebalance

Why Multi-Factor Indices in South Africa?

Balancing Defense with Growth: The S&P Quality Indices

4 Ways to Compare Asian and U.S. Dividend Markets

D-FENCE! Investigating Commodity Performance under a Defensive Fed

Contributor Image
Brian Luke

Senior Director, Head of Commodities, Real & Digital Assets

S&P Dow Jones Indices

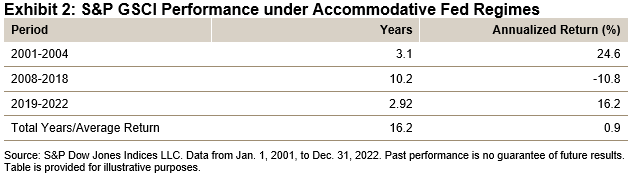
I love this time of year. August vacations are over, the kids are back in school and football season kicks off in the U.S. The Fed took its August “vacation” at the Jackson Hole Symposium, where Jerome Powell’s remarks singularly focused on price stability. Inflation has come down but “remains too high” and the Fed warned it’s “prepared to raise rates further.” As markets prepare for continued restrictive monetary policy, we went back to school to investigate the performance of commodities under a restrictive Fed. Since 1970, the S&P GSCI has achieved average annualized returns of 10.5% compared to just under 1% during periods when the Fed maintained a restrictive policy stance.

As part of its dual mandate, the Fed sets a target inflation rate of 2%. While that measure remains arbitrary, the Fed seeks to achieve this through accommodative or restrictive monetary policy. Using the primary tool of the Fed, we compare the performance of the S&P GSCI when the Fed funds effective rate remains above target inflation for at least 12 months. The S&P GSCI is the leading commodity benchmark, with back-tested history extending for over 50 years. Taking this iconic benchmark, we evaluate index performance throughout this time. There have each been three periods where sustained monetary policy was either restrictive or accommodative, covering 50 of the 53 years since 1970.[1]

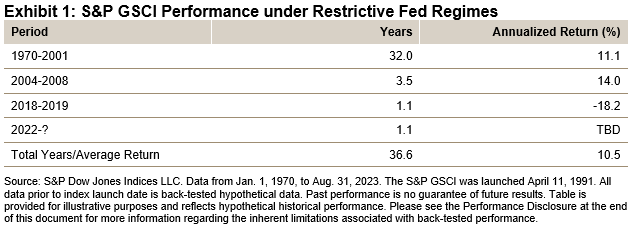
In over two-thirds of the sample, average annualized returns were over 10.5%. This covers the inflationary bouts of the 1970’s, the commodity super cycle of the 2000’s and one particularly short and abysmal year in 2018/2019. Investors of commodity ETFs missed these opportunities, with the advent of the commodity ETF’s taking place during extremely loose monetary policy regimes. Inflation is now the focus of the Fed and commodity performance has picked up.

Charting the current Fed funds effective rate reminds me of Mr. Powell’s view of the Grand Tetons. These towering peaks pierce the Wyoming sky, with a jagged silhouette stretching for 40 miles. The highest peak tops 13,775 feet, while the lowest elevation is well over a mile high. Those peaks rest on top the 3,000 mile long Rocky Mountains with elevations over one and up to three miles high. Like the Tetons, inflation has jutted up and fell from its recent peak but remains elevated. This would explain Mr. Powell’s emphasis on inflation, stating “restrictive monetary policy will likely play an increasingly important role.”

Looking at the history of the S&P GSCI, when the Fed gets defensive, commodities have tended to be a good offense. In this current period of restrictive monetary policy, commodities have produced solid but erratic returns. The S&P GSCI achieved a 22% return in 2022, outpacing all asset classes. Year-to-date, the S&P GSCI has a total return over 5%. Should the Fed remain restrictive, historical commodity returns have proven to be a solid defensive strategy.

[1] The three years include the current period and times the effective rate did not stay above or below for at least twelve consecutive months.

The posts on this blog are opinions, not advice. Please read our Disclaimers.

S&P 500 Low Volatility Index August 2023 Rebalance

Contributor Image
George Valantasis

Associate Director, Factors and Dividends

S&P Dow Jones Indices

The S&P 500® performed well from the last rebalance for the S&P 500 Low Volatility Index on May 19, 2023, through the most recent rebalance on Aug. 18, 2023. As Exhibit 1 shows, the S&P 500 was up 4.7% during this period versus a decline of 1.5% for the S&P 500 Low Volatility Index. This divergence tends to happen especially during periods of strong performance and low volatility for the S&P 500. Interestingly, the annualized daily standard deviation over this period for the S&P 500 was a relatively low 10.7%.

As Exhibit 2 shows, trailing one-year volatility decreased for all 11 GICS® sectors as of July 31, 2023, versus April 28, 2023. Measured in absolute terms, volatility decreased the most for the Consumer Discretionary and Energy sectors, which fell 6.8% and 5.4%, respectively. As of July 31, 2023, Energy, Communication Services, Consumer Discretionary, Information Technology and Real Estate were the top five most volatile sectors in the S&P 500, with daily realized volatilities of approximately 29%, 27%, 26%, 26% and 23%, respectively.

Amid the overall decrease in volatility, the S&P 500 Low Volatility Index’s latest rebalance brought some changes to sector weights. The latest rebalance shifted an additional 1.5% weight to the Consumer Staples sector, which further solidified its position as the largest sector by weight. Utilities had the largest decline in weight, at approximately 2.9%, dropping it to the third-largest sector by weight. The Consumer Staples, Utilities, Health Care, Financials and Industrials sectors continued to have a combined weight of greater than 90%.

Energy and Materials continued having no weight in the S&P 500 Low Volatility Index. The latest rebalance was effective after the market close on Aug. 18, 2023.

The posts on this blog are opinions, not advice. Please read our Disclaimers.

Why Multi-Factor Indices in South Africa?

Contributor Image
Elizabeth Bebb

Director, Factor & Dividend Indices

S&P Dow Jones Indices

Burton Malkiel, author of the book A Random Walk Down Wall Street, asserted, “The facts suggest that successful market timing is extraordinarily difficult to achieve.”1

Multi-factor indices may be a way of ensuring you are “in the right place at the right time,” participating throughout market cycles without compromising timing or returns.

The S&P DJI Multi-Factor Indices are built on a bottom-up methodology. This means the factor scores are combined to select “all-rounders” that score highly across multiple factors. The S&P South Africa Composite Quality, Value & Momentum (QVM) Multi-factor Index utilizes the Quality, Value and Momentum factors. The illustration below shows the metrics used in the scoring for each individual factor.

To be eligible for inclusion in the S&P South Africa Composite QVM Multi-factor Index, the constituents must be members of the S&P South Africa Composite and pass a trading liquidity screen. Multi-factor scores are calculated for each company based on the average for each factor. The top 40 constituents with the highest factor score are included in the index. All constituents are market capitalization times factor score weighted, to a maximum weight of 10%.

The methodology enables various benefits to be built into the index. Stocks are selected within the context of the total combined portfolio and overall exposures to the desired factors may be higher. Additionally, back-tested results show stronger risk-adjusted returns than the index of indices approach.

Multi-factor indices have historically tended to perform more strongly over the longer term on a risk-adjusted basis. This improved dynamic is demonstrated by returns being closer to the top left in Exhibit 2. The S&P South Africa Composite QVM Multi-factor Index is nearer this point than other indices.

We show the S&P South Africa Composite QVM Multi-factor Index returns on a yearly basis with the individual factor returns overlaid in Exhibit 3. The S&P South Africa Composite QVM Multi-factor Index line demonstrates how the individual factor returns are working together over various years to deliver the risk-adjusted return.

The correlations across excess returns between factors are low, which allows for the potential benefits from combining individual factors within the S&P South Africa Composite QVM Multi-factor Index approach.

Exhibit 5 shows the risk-adjusted returns over time for each of the factors. The S&P South Africa QVM Multi-factor Index provides good returns over the long-term with lower tracking error against the S&P South Africa Composite. It also participates well in rising markets but avoids some of the downside in falling markets, reflecting the benefits of the multi-factor approach.

The S&P South Africa Composite QVM Multi-factor Index provides an interesting opportunity to consider for multi-factor indexing in the South African market.

1 Malkiel, Burton. A Random Walk Down Wall Street. W. W. Norton & Company, Inc. 1973.

The posts on this blog are opinions, not advice. Please read our Disclaimers.

Balancing Defense with Growth: The S&P Quality Indices

Contributor Image
Wenli Bill Hao

Director, Factors and Dividends Indices, Product Management and Development

S&P Dow Jones Indices

Thus far this year, about two-thirds of the S&P 500®’s rally has been driven by growth stocks and the so-called “Magnificent Seven” tech stocks. While the quality factor is traditionally viewed as defensive, it has kept pace with the market while many other factor strategies have underperformed (see Exhibit 1). Part of the reason for this is the focus on companies with solid fundamentals, which has been able to capture growth names that are financially strong.

Methodology Overview

High quality is commonly associated with a company’s strong profitability, high earnings quality and robust financial strength. Hence, the S&P Quality Indices utilize three prominent metrics to capture a company’s quality characteristics (see exhibit 2): return-on-equity (ROE), balance sheet accruals ratio (BSA) and financial leverage ratio (FLR).

The selection for the S&P Quality Indices corresponds to the top 20% of eligible stocks within their respective universe, ranked by their overall quality scores. Index constituents are weighted by the product of their market capitalization and quality scores, subject to constraints.1

Performance Comparison

Historically, the S&P Quality Indices outperformed their corresponding benchmarks in the short and the long term with respect to total return and risk-adjusted return (see Exhibit 3). Year-to-date, the S&P MidCap 400® Quality Index and S&P SmallCap 600® Quality Index outperformed their benchmarks by 8.55% and 6.46%, respectively.

Additionally, these indices have tended to exhibit defensive qualities, as evidenced by lower volatility, lower beta and smaller drawdowns.

YTD Quality Index Performance Attribution

Thus far in 2023, the financial leverage ratio (FLR) component has significantly outperformed the S&P 500 (see Exhibit 4), suggesting that markets may have rewarded lower leveraged companies on the back of high interest rates.

High Upside Participation and Defensive Characteristics

The historical capture ratios in Exhibit 5 show that the S&P Quality Indices tend to participate one for one in up markets2 while delivering significant outperformance during down markets. The defensive nature of these indices makes sense since the quality factor tends to track companies with durable business models and sustainable competitive advantages.

For the S&P 500 Quality Index, these capture ratios may be partially explained by the selection of mega-cap growth stocks, which tend to have strong financials and underlying business fundamentals. The recent constituents include five (Apple, Microsoft, Nvidia, Alphabet and Meta) of the Magnificent Seven. Exhibit 6 shows the top 15 contributors to the S&P 500 Quality Index’s performance YTD.

Factor Exposure

Exhibit 7 shows the factor exposure difference between quality indices and their benchmarks in terms of Axioma Risk Model Factor Z-scores. The S&P Quality Indices demonstrated a strong quality tilt versus their respective benchmarks. Specifically, the quality indices had higher exposure to profitability and lower exposure to leverage ratio factors. Additionally, the indices had similar valuation and growth exposures to their benchmarks.

Sector Composition

Exhibit 8 shows the historic sector exposure difference between the quality indices and their benchmarks. Historically, the quality indices were overweight in Industrials and Technology, while underweighting Communication Services, Energy, Financials, Real Estate and Utilities.

1 For further information about the factor definition, factor score calculation and index design, please see the S&P Quality Indices Methodology.

2 The market is defined as the monthly performance of the underlying benchmarks from Dec. 31, 1994, to July 31, 2023.

The posts on this blog are opinions, not advice. Please read our Disclaimers.

4 Ways to Compare Asian and U.S. Dividend Markets

Contributor Image
Henry Greene

Investment Strategist

KraneShares

Dividends are becoming increasingly important as investors grapple with higher U.S. Treasury yields that do not appear to be going down anytime soon. However, not all dividend markets are created equal. Below are four charts that compare dividend index performance in Asia to the U.S.

The S&P Pan Asia Dividend Aristocrats Index brings S&P Dow Jones Indices’ notable “Dividend Aristocrats®” index methodology to Asia. The index selects companies in both emerging and developed Asian economies that have increased their dividends every year for at least the past seven years. Please click here for the full index methodology and here for more dividend-related research from KraneShares.

1. Momentum

The S&P Pan Asia Dividend Aristocrats Index has outperformed the S&P 500® Dividend Aristocrats Index, which tracks dividend growers in the U.S., so far this year, gaining 8.09% versus 3.97% for its U.S. counterpart, as of June 20, 2023.

2. Yield

S&P Pan Asia Dividend Aristocrats Index constituents also currently offer a higher dividend yield, on average, than their U.S. counterparts.

3. Valuation

S&P Pan Asia Dividend Aristocrats Index constituents are currently trading at nearly one half of the price-to-earnings multiple of their U.S. counterparts, on average.

4. Correlation

S&P Pan Asia Dividend Aristocrats constituents have also exhibited relatively low correlations to the broad U.S. equity market and the S&P 500 Dividend Aristocrats Index constituents, which may present additional portfolio benefits over the long term.

Definitions:

S&P 500 Dividend Aristocrats Index: The S&P 500 Dividend Aristocrats Index measures the performance of S&P 500 companies that have increased their dividends every year for the last 25 consecutive years. The index treats each constituent as a distinct investment opportunity without regard to its size by equally weighting each company. The index was launched on May 2, 2005. See full methodology here.

S&P Pan Asia Dividend Aristocrats Index: The S&P Pan Asia Dividend Aristocrats Index measures the performance of constituents within the S&P Pan Asia Broad Market Index (BMI) that have followed a policy of consistently increasing dividends every year for at least seven years. The index was launched on April 14, 2009.

S&P 500: The S&P 500 is widely regarded as the best single gauge of large-cap U.S. equities. There is over USD 9.9 trillion indexed or benchmarked to the index, with indexed assets comprising approximately USD 3.4 trillion of this total. The index includes 500 leading companies and covers approximately 80% of available market capitalization. The index was launched on March 4, 1957.

S&P Pan Asia Broad Market Index (BMI): The S&P Pan Asia BMI is a sub-index of the S&P Global BMI and a comprehensive benchmark including securities from developed and emerging Asia. The index was launched on Dec. 31, 1997.

Dividend Yield: The percentage of a company’s share price that said company pays out in dividends each year.

Price-to-Earnings Ratio (P/E): A measure of whether a company is over or under-valued. P/E is calculated as a company’s price per share divided by its earnings per share.

Earnings Per Share (EPS): The total revenue of a company divided by the number of shares outstanding.

Correlation: Correlation is a statistic that measures the degree to which two securities move in relation to one another. Correlations are shown here as the correlation coefficient, which is a value that must fall between -1 (inverse correlation) to 1 (absolute correlation).


The S&P 500®, S&P 500 Dividend Aristocrats Index, S&P Pan Asia Dividend Aristocrats Index and S&P Pan Asia Broad Market Index are products of S&P Dow Jones Indices LLC or its affiliates (“SPDJI”).  S&P®, S&P 500®, Dividend Aristocrats® are trademarks of S&P Global, Inc. or its affiliates (“S&P”); Dow Jones® is a registered trademark of Dow Jones Trademark Holdings LLC (“Dow Jones”).  Kraneshares ETFs based on SPDJI’s indices are not sponsored, endorsed, sold or promoted by SPDJI, Dow Jones, S&P, their respective affiliates or licensors and none of such parties make any representation regarding the advisability of investing in such product(s) nor do they have any liability for any errors, omissions or interruptions of the Indices.


The posts on this blog are opinions, not advice. Please read our Disclaimers.