Get Indexology® Blog updates via email.

In This List

4 Ways to Compare Asian and U.S. Dividend Markets

Dividends and Option Premiums: A Dual Income Story

Hot Temperatures and a Hot Start to the Second Half of 2023 for Commodities

Mean Reversion

Energy Transition Progression in H1 2023

4 Ways to Compare Asian and U.S. Dividend Markets

Contributor Image
Henry Greene

Investment Strategist

KraneShares

Dividends are becoming increasingly important as investors grapple with higher U.S. Treasury yields that do not appear to be going down anytime soon. However, not all dividend markets are created equal. Below are four charts that compare dividend index performance in Asia to the U.S.

The S&P Pan Asia Dividend Aristocrats Index brings S&P Dow Jones Indices’ notable “Dividend Aristocrats®” index methodology to Asia. The index selects companies in both emerging and developed Asian economies that have increased their dividends every year for at least the past seven years. Please click here for the full index methodology and here for more dividend-related research from KraneShares.
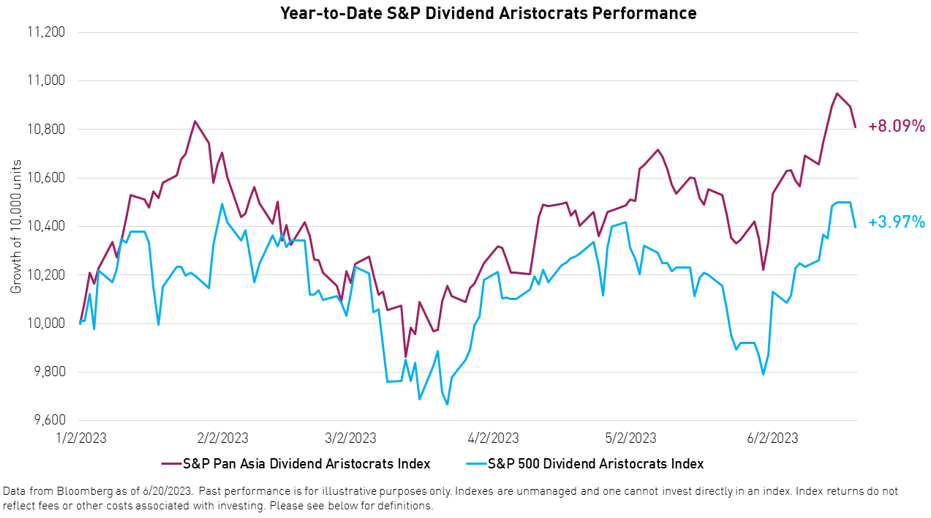
1. Momentum

The S&P Pan Asia Dividend Aristocrats Index has outperformed the S&P 500® Dividend Aristocrats Index, which tracks dividend growers in the U.S., so far this year, gaining 8.09% versus 3.97% for its U.S. counterpart, as of June 20, 2023.
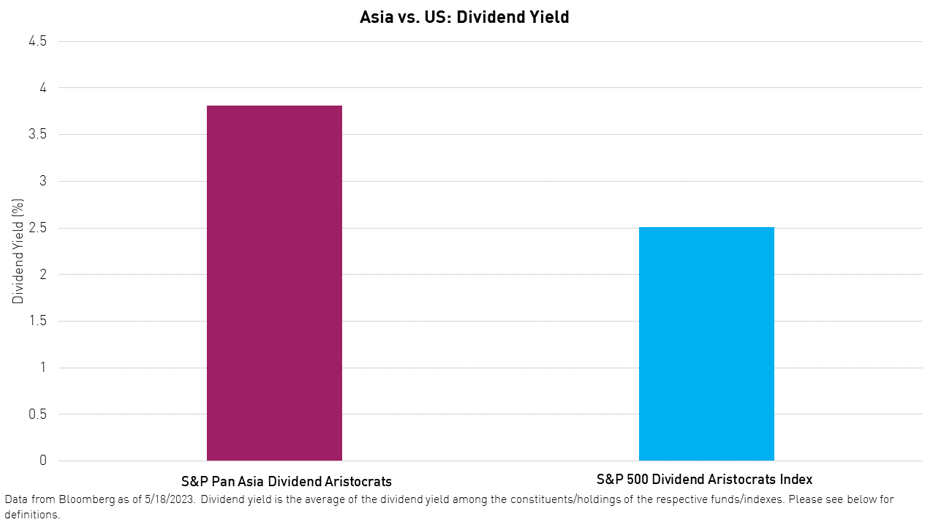
2. Yield

S&P Pan Asia Dividend Aristocrats Index constituents also currently offer a higher dividend yield, on average, than their U.S. counterparts.
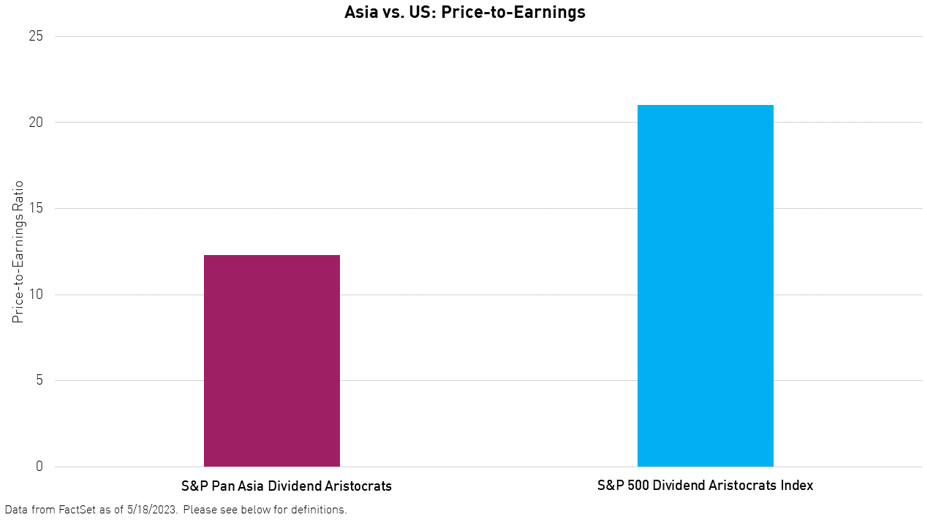
3. Valuation

S&P Pan Asia Dividend Aristocrats Index constituents are currently trading at nearly one half of the price-to-earnings multiple of their U.S. counterparts, on average.
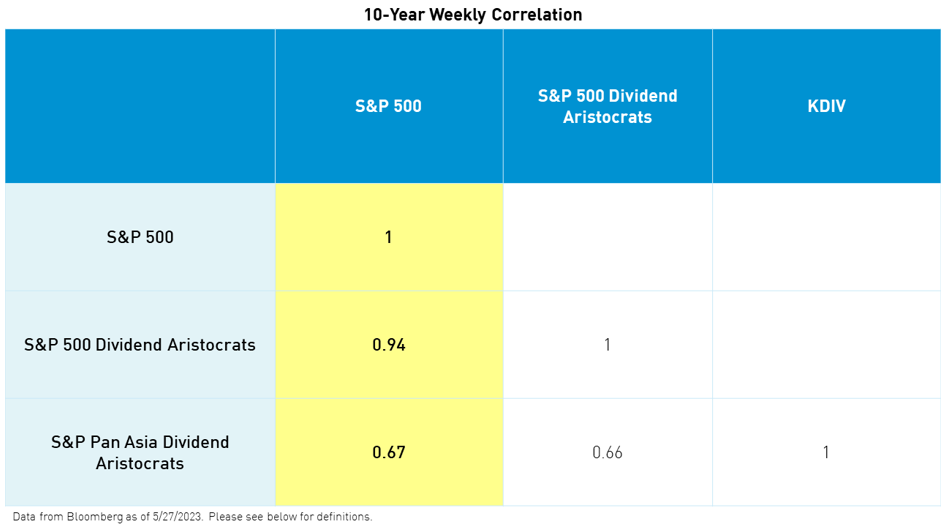
4. Correlation

S&P Pan Asia Dividend Aristocrats constituents have also exhibited relatively low correlations to the broad U.S. equity market and the S&P 500 Dividend Aristocrats Index constituents, which may present additional portfolio benefits over the long term.

Definitions:

S&P 500 Dividend Aristocrats Index: The S&P 500 Dividend Aristocrats Index measures the performance of S&P 500 companies that have increased their dividends every year for the last 25 consecutive years. The index treats each constituent as a distinct investment opportunity without regard to its size by equally weighting each company. The index was launched on May 2, 2005. See full methodology here.

S&P Pan Asia Dividend Aristocrats Index: The S&P Pan Asia Dividend Aristocrats Index measures the performance of constituents within the S&P Pan Asia Broad Market Index (BMI) that have followed a policy of consistently increasing dividends every year for at least seven years. The index was launched on April 14, 2009.

S&P 500: The S&P 500 is widely regarded as the best single gauge of large-cap U.S. equities. There is over USD 9.9 trillion indexed or benchmarked to the index, with indexed assets comprising approximately USD 3.4 trillion of this total. The index includes 500 leading companies and covers approximately 80% of available market capitalization. The index was launched on March 4, 1957.

S&P Pan Asia Broad Market Index (BMI): The S&P Pan Asia BMI is a sub-index of the S&P Global BMI and a comprehensive benchmark including securities from developed and emerging Asia. The index was launched on Dec. 31, 1997.

Dividend Yield: The percentage of a company’s share price that said company pays out in dividends each year.

Price-to-Earnings Ratio (P/E): A measure of whether a company is over or under-valued. P/E is calculated as a company’s price per share divided by its earnings per share.

Earnings Per Share (EPS): The total revenue of a company divided by the number of shares outstanding.

Correlation: Correlation is a statistic that measures the degree to which two securities move in relation to one another. Correlations are shown here as the correlation coefficient, which is a value that must fall between -1 (inverse correlation) to 1 (absolute correlation).


The S&P 500®, S&P 500 Dividend Aristocrats Index, S&P Pan Asia Dividend Aristocrats Index and S&P Pan Asia Broad Market Index are products of S&P Dow Jones Indices LLC or its affiliates (“SPDJI”).  S&P®, S&P 500®, Dividend Aristocrats® are trademarks of S&P Global, Inc. or its affiliates (“S&P”); Dow Jones® is a registered trademark of Dow Jones Trademark Holdings LLC (“Dow Jones”).  Kraneshares ETFs based on SPDJI’s indices are not sponsored, endorsed, sold or promoted by SPDJI, Dow Jones, S&P, their respective affiliates or licensors and none of such parties make any representation regarding the advisability of investing in such product(s) nor do they have any liability for any errors, omissions or interruptions of the Indices.


The posts on this blog are opinions, not advice. Please read our Disclaimers.

Dividends and Option Premiums: A Dual Income Story

Contributor Image
Maxime Fouilleron

Analyst, Multi-Asset Indices

S&P Dow Jones Indices

Income generation may be sought out by a variety of market participants, including those nearing retirement and those seeking a source of passive income. An income-focused strategy requires a different approach to those focused on generating growth. Traditional sources of income include dividend-paying stocks and coupon-paying bonds. The economic landscape of the past 18 months has been shaped by persistent inflation, rising interest rates and general market uncertainty, all of which have negatively affected the performance of these traditional strategies.

To help diversify risk and add incremental income, market participants might look for non-traditional sources of income generation such as a covered call strategy. The Dow Jones U.S. Dividend 100 3% Premium Covered Call Index and the Dow Jones U.S. Dividend 100 7% Premium Covered Call Index are designed to measure the performance of a long position in high-dividend-yielding stocks and a short position in a standard S&P 500® monthly call option.

The underlying equity index used for the Dow Jones U.S. Dividend 100 Covered Call Indices is the Dow Jones U.S. Dividend 100 Index, which measures the performance of high-dividend-yielding U.S. stocks. Since 2006, the Dow Jones U.S. Dividend 100 Index has posted an average dividend yield of 3.88% (see Exhibit 1), comfortably outperforming the S&P 500 Dividend Aristocrats® (2.58%) and the S&P 500 (1.95%).

A covered call strategy involves selling a call option on a long equity position. If the asset’s market price exceeds the option’s strike, a rational option buyer would exercise the contract and obligate the option writer to sell the asset or settle in cash. The main potential benefits of this strategy are the cash flow generated from writing the calls—option premiums—and the limited downside protection that the premiums can provide. Similarly to dividends, the cash flow received from option premiums can mitigate the effects of down markets. The main drawback of a covered call is the limited upside potential of the equity position. Covered call strategies are particularly relevant during volatile market conditions. Option premiums tend to increase as volatility rises, offering the potential for greater income generation and added downside protection.

What makes the Dow Jones U.S. Dividend 100 3% Premium Covered Call Index and the Dow Jones U.S. Dividend 100 7% Premium Covered Call Index unique is that they combine a traditional dividend-paying income strategy and a non-traditional covered call approach. Both indices reflect the same dividend yield as the underlying Dow Jones U.S. Dividend 100 Index, which has averaged 3.88% since 2006. In addition, each index targets a specific premium yield of 3% and 7%, respectively.

Historically, these indices have adjusted their coverage ratios and successfully achieved their target yields (see Exhibits 3 and 4). The coverage ratio is defined as the notional value of the short call position as a fraction of the long equity notional amount. For example, a coverage ratio of 100% means that calls were written against the entire value of the long equity position, while a coverage ratio of 25% signifies that the value of the calls represents one-fourth of the equity position. The dynamic nature of the coverage ratio provides the index with some downside protection (from the covered short position) as well as exposure to equity upside (from the uncovered long equity position).

For market participants searching for two sources of income, adding a covered call overlay may provide incremental income beyond what could be accessed from a purely dividend-paying equity index. The option for target yields of 3% or 7% provides the ability to choose the ideal upside potential.

The posts on this blog are opinions, not advice. Please read our Disclaimers.

Hot Temperatures and a Hot Start to the Second Half of 2023 for Commodities

Contributor Image
Jim Wiederhold

Former Director, Commodities and Real Assets

S&P Dow Jones Indices

The S&P GSCI, the broad commodities benchmark, started the second half of the year in a blistering heat wave and rose 11% on the back of petroleum commodities, which all increased by more than 14% in July. The remaining four sectors within the S&P GSCI also rose during the month, as fears of a recession abated with inflation falling and the Fed possibly getting close to ending their rate hiking cycle. Strong inflows into commodity ETFs and the covering of short positions across individual commodities helped to create a potential bottom in a few key commodities futures markets.

The energy sector completely reversed its underperformance from the first half of the year, bringing all commodities into positive territory for 2023. OPEC+ production cuts and the absence of negative economic data helped to lift the fossil-fuel-based commodities in July. Demand for petroleum has remained strong during the energy transition, as the world continues to rely on old ways to fuel the economy, as can be seen by strong import demand across nations, particularly in Asia. The S&P GSCI Gasoil and the S&P GSCI Heating Oil were the standouts for the month, rising 23.8% and 22.9%, respectively.

The S&P GSCI Industrial Metals rose 6.5% with all five of the top-traded metals rising in July. For the past few months, Commodity Trading Advisors (CTAs) had large short positions in the space, but short covering in July led to a strong bounce off the lows for several key metals, which have posted some of the worst YTD performance rates in the commodities markets.

Another source of positive news came from the precious metals sector. The S&P GSCI Gold was up 8.1% YTD, as market participants positioned for future U.S. dollar weakness with expectations for the Fed to end their rate hiking cycle soon. Central banks across the globe have increased their gold reserves recently at a pace not seen in years, which typically prefaces a rise in gold prices. The S&P GSCI Silver joined the party by rising 9.0% in July and moving into positive territory for the year. This typically happens as silver tends to track gold moves higher, but with a lag.

The S&P GSCI Agriculture grew by a modest 3.0%, while the S&P GSCI Wheat and the S&P GSCI Corn rose the most as concerns over the latest crop yields were prominent. A recent S&P Global post highlighted the potential for China to have reached peak food demand. China is the biggest consumer of grains globally, but the World Bank recently forecasted that after decades of strong growth, their population will fall by 80 million people over the next 25 years. Could this lead to less demand, or will new areas of demand, such as in more environmentally friendly biofuels, spur new global consumption to supplant the drop in the food needs of China over time?

The posts on this blog are opinions, not advice. Please read our Disclaimers.

Mean Reversion

Contributor Image
Craig Lazzara

Former Managing Director, Index Investment Strategy

S&P Dow Jones Indices

Over more than 20 years of live history, the S&P 500® Equal Weight Index has outperformed the S&P 500 by a substantial margin. Between Dec. 31, 1990, and June 30, 2023, Equal Weight’s compound annual growth rate was 11.82%, well ahead of the cap-weighted S&P 500 at 10.55%. This performance edge is a product of robust underlying characteristics, most importantly a tilt toward smaller-capitalization stocks. Equal Weight’s historical returns have outpaced those of virtually every active large-cap U.S. equity portfolio in our SPIVA® database.

But the candid observer must recognize that Equal Weight’s performance advantage does not accrue smoothly. Exhibit 1 plots the ratio of performance between Equal Weight and the cap-weighted S&P 500. When the line in Exhibit 1 is rising, Equal Weight is outperforming; a falling line indicates cap weight outperformance.

As the exhibit suggests, there can be long periods of both under- and outperformance. For example, Equal Weight lagged for more than five years between August 1994 and February 2000, and then began a six-year run of superior returns.

We need not look so far back in time to find examples of market rotation between Equal Weight and cap weight. In calendar 2022, Equal Weight outperformed the S&P 500 by 6.7%; in the first six months of 2023, Equal Weight lagged by 9.9%. Exhibit 2 shows the difference between Equal Weight and cap weight over a trailing six-month horizon.

The median difference, measured over all six-month intervals, was 0.59%. Exhibit 2 makes it clear that when the series is well above that level, it tends to decline; when well below that level, it tends to increase. As of June 30, 2023, the trailing six-month difference was -9.86%, which ranks at the 2nd percentile of all observations. If the historical distribution of returns is a fair representation of the future distribution, this means that the Equal Weight – cap weight spread is far more likely to rise than to fall. Remember Stein’s Law: “If something cannot go on forever, it will stop.”

But when? I would tell you if I knew, but like so many issues in investment management, agnosticism is the most prudent response. Nonetheless, the data do tell us something important about the speed with which market trends can reverse.

The worst six-month interval for the relative performance of Equal Weight ended with the technology bubble in February 2000, as Equal Weight lagged the S&P 500 by 10.79%. The best six-month interval for the relative performance of Equal Weight ended in February 2001, when Equal Weight outperformed by 20.04%. The gap between the worst and the best readings in our 32-year history was only 12 months. An advisor who reduced his Equal Weight holdings in 2000 because of then-disappointing performance would probably have found it even more disappointing to miss the subsequent reversal.

Successful asset management sometimes requires holding positions when one’s natural instinct is to sell. Fortitude is most required when its potential benefit is great.


The posts on this blog are opinions, not advice. Please read our Disclaimers.

Energy Transition Progression in H1 2023

Contributor Image
Jason Ye

Director, Factors and Thematics Indices

S&P Dow Jones Indices

As we kick off the second half of 2023, we wanted to review some of the key developments from the first half of the year in the clean energy space and review the results of the S&P Global Clean Energy Index Series rebalance from April.

Key Developments

Government Spending in Clean Energy Space Continues in 2023

In May 2023, two new programs were announced by the U.S. government to support clean and affordable energy, as part of the Inflation Reduction Act. These two programs, with a combined amount of almost USD 11 billion in grants and loan opportunities, will bring clean energy to rural energy and utility providers.1

Global Investment in Clean Energy Keeps Rising

Based on the International Energy Agency’s latest World Energy Investment 2023 report, global investment in clean energy continues to rise and is projected to reach USD 1.7 trillion in 2023. The difference between the investment in clean energy and fossil fuels has continued to increase, meaning we continue to see more capital invested in the clean energy space than ever before.2

Renewable-Generated Electric Power Surpassed Coal-Fired for First Time in the U.S.

Data for 2022 announced by the U.S. Energy Information Administration shows that renewable sources, including solar, wind, hydro, biomass and geothermal energy, generated 21% of the electric power in the U.S., surpassing the 20% from coal for the first time in history. The largest source of U.S. electricity generation comes from natural gas which accounts for 39%. Among the renewables, wind and solar continue to be the two major drivers of growth.3

The G7 Agreed on Joint Targets for the Expansion of Renewable Energies for the First Time

The G7 (Canada, France, Germany, Italy, Japan, the U.K. and the U.S.) ministers met in Sapporo, Japan in April to discuss climate, energy and environmental issues. At the meeting, the G7 countries agreed to collectively increase the offshore wind capacity of 150GW and increase solar photovoltaics to more than 1TW by 2030.4

April Rebalance

Launched in 2007, the S&P Global Clean Energy Index has been the benchmark to measure clean energy-related companies’ performance over the past 16 years. In April 2021, we also launched the S&P Global Clean Energy Select Index, which is designed to measure the 30 largest companies in global clean energy businesses that are listed on developed market exchanges.

Both the S&P Global Clean Energy Index and the S&P Global Clean Energy Select Index went through a semi-annual rebalance on April 21, 2023. In the index methodology, we assign companies to four buckets of exposure scores from 0 to 1 with an increment of 0.25 to measure their purity of exposure toward the clean energy business. Exhibit 1 shows the change of exposure before and after the April rebalance. We can see that for the S&P Global Clean Energy Index post-rebalance, we have three more companies with an exposure score of 0.75 and one company with an exposure score of 0.5 being added to the index. The weighted average exposure score of the index improved slightly from 0.92 to 0.93. The S&P Global Clean Energy Select Index, on the other hand, selects 30 companies with an exposure score of 1 listed in the developed market exchanges.

S&P Global Clean Energy Index Performance in H1 2023

After outperforming the S&P Global BMI in 2022, both the S&P Global Clean Energy Index and the S&P Global Clean Energy Select Index underperformed during the first half of 2023.

The S&P Global Clean Energy Select Index was down 2.74% and the S&P Global Clean Energy Index was down 7% in USD total return terms. There was significant dispersion seen among constituents; some of the performance draggers include Sunpower (-45.65%), Enphase Energy (-36.79%) and Sunrun (-25.65%), while Cia Energetica (up 34.32%), Chubu Electric Power (up 31.31%) and First Solar (up 26.9%) contributed positively to the performance.

The energy transition is a long-term megatrend, and S&P Global Clean Energy Index series continues to gauge the performance in the clean energy space.

1 https://www.usda.gov/media/press-releases/2023/05/16/biden-harris-administration-makes-historic-11-billion-investment

2 https://www.iea.org/reports/world-energy-investment-2023/overview-and-key-findings

3 https://www.eia.gov/todayinenergy/detail.php?id=55960

4 https://www.whitehouse.gov/briefing-room/statements-releases/2023/05/20/g7-hiroshima-leaders-communique/

The posts on this blog are opinions, not advice. Please read our Disclaimers.