Get Indexology® Blog updates via email.

In This List

Hot Temperatures and a Hot Start to the Second Half of 2023 for Commodities

Mean Reversion

Energy Transition Progression in H1 2023

Comparing Defensive Factors in the Recent Market Environment

Introducing the S&P SmallCap 600 QVML Top 90% Multi-Factor Index

Hot Temperatures and a Hot Start to the Second Half of 2023 for Commodities

Contributor Image
Jim Wiederhold

Former Director, Commodities and Real Assets

S&P Dow Jones Indices

The S&P GSCI, the broad commodities benchmark, started the second half of the year in a blistering heat wave and rose 11% on the back of petroleum commodities, which all increased by more than 14% in July. The remaining four sectors within the S&P GSCI also rose during the month, as fears of a recession abated with inflation falling and the Fed possibly getting close to ending their rate hiking cycle. Strong inflows into commodity ETFs and the covering of short positions across individual commodities helped to create a potential bottom in a few key commodities futures markets.

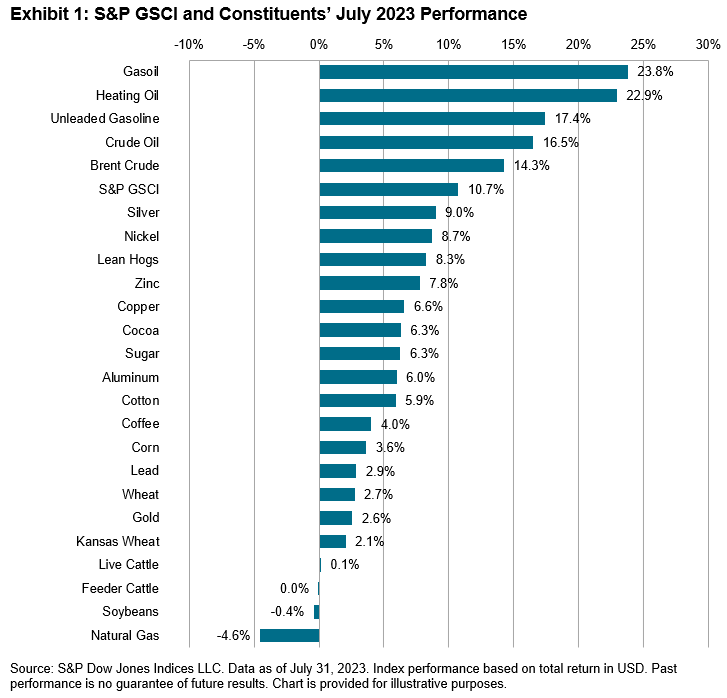
The energy sector completely reversed its underperformance from the first half of the year, bringing all commodities into positive territory for 2023. OPEC+ production cuts and the absence of negative economic data helped to lift the fossil-fuel-based commodities in July. Demand for petroleum has remained strong during the energy transition, as the world continues to rely on old ways to fuel the economy, as can be seen by strong import demand across nations, particularly in Asia. The S&P GSCI Gasoil and the S&P GSCI Heating Oil were the standouts for the month, rising 23.8% and 22.9%, respectively.

The S&P GSCI Industrial Metals rose 6.5% with all five of the top-traded metals rising in July. For the past few months, Commodity Trading Advisors (CTAs) had large short positions in the space, but short covering in July led to a strong bounce off the lows for several key metals, which have posted some of the worst YTD performance rates in the commodities markets.

Another source of positive news came from the precious metals sector. The S&P GSCI Gold was up 8.1% YTD, as market participants positioned for future U.S. dollar weakness with expectations for the Fed to end their rate hiking cycle soon. Central banks across the globe have increased their gold reserves recently at a pace not seen in years, which typically prefaces a rise in gold prices. The S&P GSCI Silver joined the party by rising 9.0% in July and moving into positive territory for the year. This typically happens as silver tends to track gold moves higher, but with a lag.

The S&P GSCI Agriculture grew by a modest 3.0%, while the S&P GSCI Wheat and the S&P GSCI Corn rose the most as concerns over the latest crop yields were prominent. A recent S&P Global post highlighted the potential for China to have reached peak food demand. China is the biggest consumer of grains globally, but the World Bank recently forecasted that after decades of strong growth, their population will fall by 80 million people over the next 25 years. Could this lead to less demand, or will new areas of demand, such as in more environmentally friendly biofuels, spur new global consumption to supplant the drop in the food needs of China over time?

The posts on this blog are opinions, not advice. Please read our Disclaimers.

Mean Reversion

Contributor Image
Craig Lazzara

Former Managing Director, Index Investment Strategy

S&P Dow Jones Indices

Over more than 20 years of live history, the S&P 500® Equal Weight Index has outperformed the S&P 500 by a substantial margin. Between Dec. 31, 1990, and June 30, 2023, Equal Weight’s compound annual growth rate was 11.82%, well ahead of the cap-weighted S&P 500 at 10.55%. This performance edge is a product of robust underlying characteristics, most importantly a tilt toward smaller-capitalization stocks. Equal Weight’s historical returns have outpaced those of virtually every active large-cap U.S. equity portfolio in our SPIVA® database.

But the candid observer must recognize that Equal Weight’s performance advantage does not accrue smoothly. Exhibit 1 plots the ratio of performance between Equal Weight and the cap-weighted S&P 500. When the line in Exhibit 1 is rising, Equal Weight is outperforming; a falling line indicates cap weight outperformance.

As the exhibit suggests, there can be long periods of both under- and outperformance. For example, Equal Weight lagged for more than five years between August 1994 and February 2000, and then began a six-year run of superior returns.

We need not look so far back in time to find examples of market rotation between Equal Weight and cap weight. In calendar 2022, Equal Weight outperformed the S&P 500 by 6.7%; in the first six months of 2023, Equal Weight lagged by 9.9%. Exhibit 2 shows the difference between Equal Weight and cap weight over a trailing six-month horizon.

The median difference, measured over all six-month intervals, was 0.59%. Exhibit 2 makes it clear that when the series is well above that level, it tends to decline; when well below that level, it tends to increase. As of June 30, 2023, the trailing six-month difference was -9.86%, which ranks at the 2nd percentile of all observations. If the historical distribution of returns is a fair representation of the future distribution, this means that the Equal Weight – cap weight spread is far more likely to rise than to fall. Remember Stein’s Law: “If something cannot go on forever, it will stop.”

But when? I would tell you if I knew, but like so many issues in investment management, agnosticism is the most prudent response. Nonetheless, the data do tell us something important about the speed with which market trends can reverse.

The worst six-month interval for the relative performance of Equal Weight ended with the technology bubble in February 2000, as Equal Weight lagged the S&P 500 by 10.79%. The best six-month interval for the relative performance of Equal Weight ended in February 2001, when Equal Weight outperformed by 20.04%. The gap between the worst and the best readings in our 32-year history was only 12 months. An advisor who reduced his Equal Weight holdings in 2000 because of then-disappointing performance would probably have found it even more disappointing to miss the subsequent reversal.

Successful asset management sometimes requires holding positions when one’s natural instinct is to sell. Fortitude is most required when its potential benefit is great.


The posts on this blog are opinions, not advice. Please read our Disclaimers.

Energy Transition Progression in H1 2023

Contributor Image
Jason Ye

Director, Factors and Thematics Indices

S&P Dow Jones Indices

As we kick off the second half of 2023, we wanted to review some of the key developments from the first half of the year in the clean energy space and review the results of the S&P Global Clean Energy Index Series rebalance from April.

Key Developments

Government Spending in Clean Energy Space Continues in 2023

In May 2023, two new programs were announced by the U.S. government to support clean and affordable energy, as part of the Inflation Reduction Act. These two programs, with a combined amount of almost USD 11 billion in grants and loan opportunities, will bring clean energy to rural energy and utility providers.1

Global Investment in Clean Energy Keeps Rising

Based on the International Energy Agency’s latest World Energy Investment 2023 report, global investment in clean energy continues to rise and is projected to reach USD 1.7 trillion in 2023. The difference between the investment in clean energy and fossil fuels has continued to increase, meaning we continue to see more capital invested in the clean energy space than ever before.2

Renewable-Generated Electric Power Surpassed Coal-Fired for First Time in the U.S.

Data for 2022 announced by the U.S. Energy Information Administration shows that renewable sources, including solar, wind, hydro, biomass and geothermal energy, generated 21% of the electric power in the U.S., surpassing the 20% from coal for the first time in history. The largest source of U.S. electricity generation comes from natural gas which accounts for 39%. Among the renewables, wind and solar continue to be the two major drivers of growth.3

The G7 Agreed on Joint Targets for the Expansion of Renewable Energies for the First Time

The G7 (Canada, France, Germany, Italy, Japan, the U.K. and the U.S.) ministers met in Sapporo, Japan in April to discuss climate, energy and environmental issues. At the meeting, the G7 countries agreed to collectively increase the offshore wind capacity of 150GW and increase solar photovoltaics to more than 1TW by 2030.4

April Rebalance

Launched in 2007, the S&P Global Clean Energy Index has been the benchmark to measure clean energy-related companies’ performance over the past 16 years. In April 2021, we also launched the S&P Global Clean Energy Select Index, which is designed to measure the 30 largest companies in global clean energy businesses that are listed on developed market exchanges.

Both the S&P Global Clean Energy Index and the S&P Global Clean Energy Select Index went through a semi-annual rebalance on April 21, 2023. In the index methodology, we assign companies to four buckets of exposure scores from 0 to 1 with an increment of 0.25 to measure their purity of exposure toward the clean energy business. Exhibit 1 shows the change of exposure before and after the April rebalance. We can see that for the S&P Global Clean Energy Index post-rebalance, we have three more companies with an exposure score of 0.75 and one company with an exposure score of 0.5 being added to the index. The weighted average exposure score of the index improved slightly from 0.92 to 0.93. The S&P Global Clean Energy Select Index, on the other hand, selects 30 companies with an exposure score of 1 listed in the developed market exchanges.

S&P Global Clean Energy Index Performance in H1 2023

After outperforming the S&P Global BMI in 2022, both the S&P Global Clean Energy Index and the S&P Global Clean Energy Select Index underperformed during the first half of 2023.

The S&P Global Clean Energy Select Index was down 2.74% and the S&P Global Clean Energy Index was down 7% in USD total return terms. There was significant dispersion seen among constituents; some of the performance draggers include Sunpower (-45.65%), Enphase Energy (-36.79%) and Sunrun (-25.65%), while Cia Energetica (up 34.32%), Chubu Electric Power (up 31.31%) and First Solar (up 26.9%) contributed positively to the performance.

The energy transition is a long-term megatrend, and S&P Global Clean Energy Index series continues to gauge the performance in the clean energy space.

1 https://www.usda.gov/media/press-releases/2023/05/16/biden-harris-administration-makes-historic-11-billion-investment

2 https://www.iea.org/reports/world-energy-investment-2023/overview-and-key-findings

3 https://www.eia.gov/todayinenergy/detail.php?id=55960

4 https://www.whitehouse.gov/briefing-room/statements-releases/2023/05/20/g7-hiroshima-leaders-communique/

The posts on this blog are opinions, not advice. Please read our Disclaimers.

Comparing Defensive Factors in the Recent Market Environment

Contributor Image
Andrew Neatt

Private Investment Advice

TD Wealth

On Sept. 17, 2020, S&P DJI’s Indexology blog shared a post I wrote titled “Comparing Defensive Factors During the Last 3 Bear Markets.” This blog is a continuation of that study, examining the results of the same factors during the 18-month period around the 2022 market correction that led the S&P 500® officially into bear market territory.

As explained in the September 2020 post, Low Volatility and Quality have been commonly referred to as defensive factors. One reason is they have historically exhibited less volatility, as measured by standard deviation, on a consistent basis. Another reason is that over the long term, the maximum drawdown of each of these indices has not matched the extent of the maximum drawdown experienced by the S&P 500. A third reason is that, on average, the S&P 500 Quality Index and the S&P 500 Low Volatility Index have outperformed the S&P 500 during the worst equity market regimes.

In the 2020 post, the bear markets of 2002, 2009 and 2020 were compared by examining the performance of the S&P 500, S&P 500 Low Volatility Index and the S&P 500 Quality Index over an 18-month period that included similar time frames pre and post equity market low. Specifically, the 2002 analysis included 88 days of recovery after the low of 2002, the 2009 analysis included 116 days of recovery after the low of 2009, and the 2020 analysis included 102 days of recovery after the most recent low. This update examines an 18-month period from June 30, 2021, to Dec. 31, 2022, including 80 days of recovery after the 2022 closing low of the S&P 500, registered on October 12.

As a refresher here are the three bear market comparisons from the 2020 report.

The three periods examined above showed the consistently reduced volatility associated with the S&P 500 Quality Index and the S&P 500 Low Volatility Index compared to its benchmark, the S&P 500, during those three bear markets. When it comes to returns, the S&P 500 Low Volatility Index and the S&P 500 Quality Index both outperformed in 2002 and 2009. However, in 2020, while the S&P 500 Quality Index outperformed the S&P 500 again, the S&P 500 Low Volatility Index underperformed.

How did the S&P 500 Quality Index and the S&P 500 Low Volatility Index fare during the most recent challenging equity market environment?

Over the 18-month period from June 30, 2021, to Dec. 31, 2022, the defensive nature of the two indices held up relatively well versus the S&P 500. Both generated superior relative returns over the measurement period, but only the S&P 500 Low Volatility Index experienced lower volatility versus the S&P 500, while the S&P 500 Quality Index was generally in line with the S&P 500.

Whether we are still in the midst of a prolonged bear market or in the early stages of a new bull market is not part of the discussion of this analysis. However, what is interesting to note from this update is that defensive factors continue to show some relative strength during poor equity environments.

The information contained herein has been provided by Andrew Neatt, Senior Portfolio Manager and Senior Investment Advisor of TD Wealth Private Investment Advice is for information purposes only. The information has been drawn from sources believed to be reliable. Graphs and charts are used for illustrative purposes only and do not reflect future values or future performance of any investment. The information does not provide financial, legal, tax or investment advice. Particular investment, tax, or trading strategies should be evaluated relative to each individual’s objectives and risk tolerance.

Index returns are shown for comparative purposes only. Indexes are unmanaged and their returns do not include any sales charges or fees as such costs would lower performance. It is not possible to invest directly in an index.

TD Wealth Private Investment Advice is a division of TD Waterhouse Canada Inc., a subsidiary of The Toronto-Dominion Bank.


The posts on this blog are opinions, not advice. Please read our Disclaimers.

Introducing the S&P SmallCap 600 QVML Top 90% Multi-Factor Index

Contributor Image
Wenli Bill Hao

Director, Factors and Dividends Indices, Product Management and Development

S&P Dow Jones Indices

For market participants seeking to measure small-cap, multi-factor equity premia with greater diversification and historically lower tracking error (TE), S&P DJI has recently launched the S&P SmallCap 600® Quality, Value, Momentum and Low Volatility (QVML) Top 90% Multi-Factor Index.

In this blog, we will examine the index construction methodology, historic performance, sector composition and factor exposure.

Methodology Overview

The S&P SmallCap 600 QVML Top 90% Multi-Factor Index uses a systematic bottom-up approach to select the top 90% stocks, ranked by their multi-factor scores, from the S&P SmallCap 600® universe. Moreover, the constituents are weighted by floated-adjusted market cap (FMC) and rebalanced quarterly. Here, the multi-factor score is defined as the average of the underlying quality, value, momentum and low volatility Z-scores.1 In essence, the index excludes the bottom 10% lowest ranked constituents based on their multi-factor scores.

Empirical back-tested analysis shows that, in the S&P SmallCap 600 universe, the lowest-ranked decile exhibited the lowest performance over the period tested. Hence, T90%, which removes the lowest-ranked decile, would have outperformed the S&P SmallCap 600. Here, stocks have been ranked by their multi-factor score and grouped into deciles (D1 = the highest ranked, D10 = the lowest ranked), as shown in Exhibit 1.

The S&P SmallCap 600 QVML Top 90% Multi-Factor Index was designed to have high diversification and low TE to its benchmark. The slopes of the lines in Exhibit 2 represent the information ratios (IR; defined as the ratio of annualized excess return divided by annualized TE) for a series of indices, each differentiated by the number of deciles removed. For example, T90% removes only the lowest-ranked decile (ranked by multi-factor score), T80% removes the two lowest-ranked deciles (i.e., the 20% lowest-ranked stocks) and so on.

As shown in Exhibit 2, T90% had the highest IR. As more deciles were removed from the back-tested results, their IRs became lower, which means the excess risk (TE) was not proportionally compensated by the excess return.

Performance Comparison

Historically, the S&P SmallCap 600 QVML Top 90% Multi-Factor Index outperformed its benchmark for all periods studied, in both the long and short term, and in terms of both total returns and risk-adjusted returns (see Exhibit 3). The empirical results show that multi-factor premia do exist over the long-term horizon.

Tracking Error and Information Ratio

Given the index design, the S&P SmallCap 600 QVML Top 90% Multi-Factor Index had a low TE over time, based on daily total return calculation (see Exhibit 4). Through targeted multi-factor exposure, the strategy generated excess return and had a positive IR for all periods studied, in both the short and long term.

Sector Composition

Exhibit 5 shows the historic sector exposures of the S&P SmallCap 600 QVML Top 90% Multi-Factor Index and the S&P 600. The small sector exposure differences (less than 1%) for all sectors show that the strategy has retained the core characteristics of its benchmark historically.

Factor Exposure

Exhibit 6 illustrates the factor exposure difference of the S&P SmallCap 600 QVML Top 90% Multi-Factor Index versus the S&P 600, as measured through the lens of the Axioma Risk Model Factor Z-scores. The strategy had higher exposures to quality (higher profitability and lower leverage ratio), value (higher earnings yield and the book-to-price ratio) and momentum, while it had lower volatility (lower beta and volatility). The findings are in line with the index design, which selects the top 90% stocks in terms of their multi-factor scores.

1 Please refer to the S&P QVML Multi-Factor Indices Methodology for more details.

The posts on this blog are opinions, not advice. Please read our Disclaimers.