Get Indexology® Blog updates via email.

In This List

Energy Transition Progression in H1 2023

Comparing Defensive Factors in the Recent Market Environment

Introducing the S&P SmallCap 600 QVML Top 90% Multi-Factor Index

iBoxx Sovereign Debt Indexing with ESG Scores and Green Bonds

Global Islamic Indices Gained over 7.5% in Q2 2023, Outperforming Conventional Benchmarks YTD

Energy Transition Progression in H1 2023

Contributor Image
Jason Ye

Director, Factors and Thematics Indices

S&P Dow Jones Indices

As we kick off the second half of 2023, we wanted to review some of the key developments from the first half of the year in the clean energy space and review the results of the S&P Global Clean Energy Index Series rebalance from April.

Key Developments

Government Spending in Clean Energy Space Continues in 2023

In May 2023, two new programs were announced by the U.S. government to support clean and affordable energy, as part of the Inflation Reduction Act. These two programs, with a combined amount of almost USD 11 billion in grants and loan opportunities, will bring clean energy to rural energy and utility providers.1

Global Investment in Clean Energy Keeps Rising

Based on the International Energy Agency’s latest World Energy Investment 2023 report, global investment in clean energy continues to rise and is projected to reach USD 1.7 trillion in 2023. The difference between the investment in clean energy and fossil fuels has continued to increase, meaning we continue to see more capital invested in the clean energy space than ever before.2

Renewable-Generated Electric Power Surpassed Coal-Fired for First Time in the U.S.

Data for 2022 announced by the U.S. Energy Information Administration shows that renewable sources, including solar, wind, hydro, biomass and geothermal energy, generated 21% of the electric power in the U.S., surpassing the 20% from coal for the first time in history. The largest source of U.S. electricity generation comes from natural gas which accounts for 39%. Among the renewables, wind and solar continue to be the two major drivers of growth.3

The G7 Agreed on Joint Targets for the Expansion of Renewable Energies for the First Time

The G7 (Canada, France, Germany, Italy, Japan, the U.K. and the U.S.) ministers met in Sapporo, Japan in April to discuss climate, energy and environmental issues. At the meeting, the G7 countries agreed to collectively increase the offshore wind capacity of 150GW and increase solar photovoltaics to more than 1TW by 2030.4

April Rebalance

Launched in 2007, the S&P Global Clean Energy Index has been the benchmark to measure clean energy-related companies’ performance over the past 16 years. In April 2021, we also launched the S&P Global Clean Energy Select Index, which is designed to measure the 30 largest companies in global clean energy businesses that are listed on developed market exchanges.

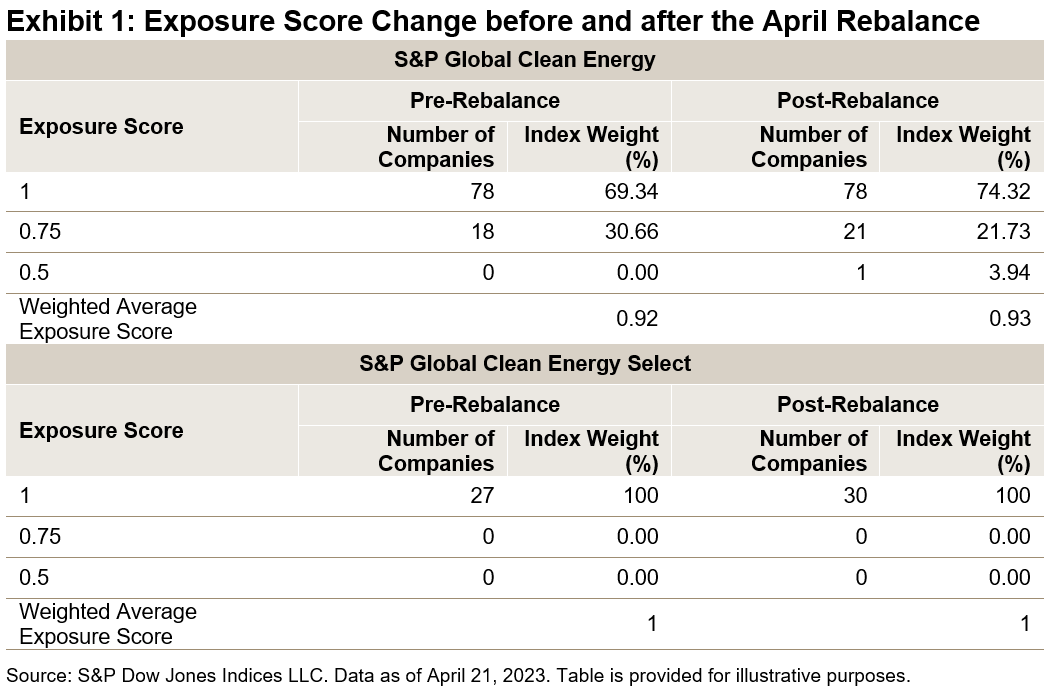
Both the S&P Global Clean Energy Index and the S&P Global Clean Energy Select Index went through a semi-annual rebalance on April 21, 2023. In the index methodology, we assign companies to four buckets of exposure scores from 0 to 1 with an increment of 0.25 to measure their purity of exposure toward the clean energy business. Exhibit 1 shows the change of exposure before and after the April rebalance. We can see that for the S&P Global Clean Energy Index post-rebalance, we have three more companies with an exposure score of 0.75 and one company with an exposure score of 0.5 being added to the index. The weighted average exposure score of the index improved slightly from 0.92 to 0.93. The S&P Global Clean Energy Select Index, on the other hand, selects 30 companies with an exposure score of 1 listed in the developed market exchanges.

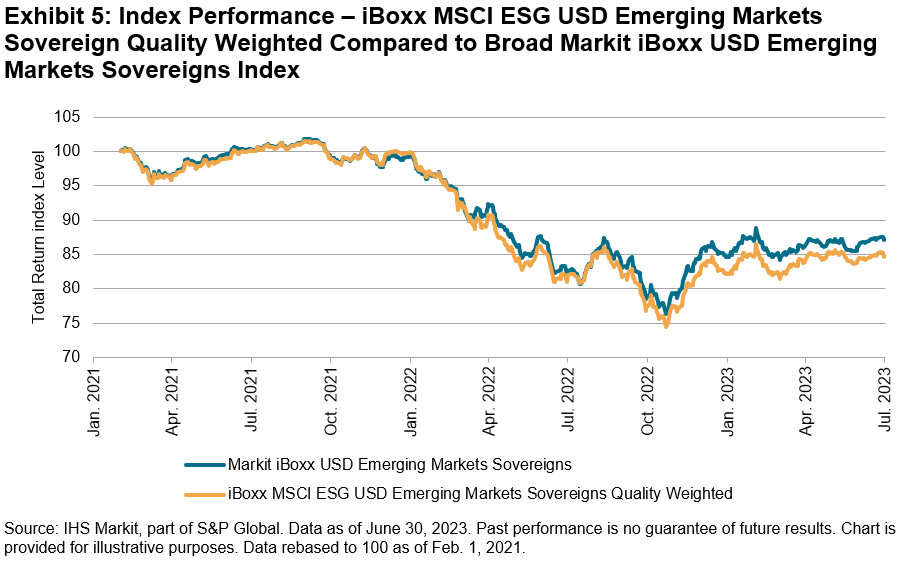
S&P Global Clean Energy Index Performance in H1 2023

After outperforming the S&P Global BMI in 2022, both the S&P Global Clean Energy Index and the S&P Global Clean Energy Select Index underperformed during the first half of 2023.

The S&P Global Clean Energy Select Index was down 2.74% and the S&P Global Clean Energy Index was down 7% in USD total return terms. There was significant dispersion seen among constituents; some of the performance draggers include Sunpower (-45.65%), Enphase Energy (-36.79%) and Sunrun (-25.65%), while Cia Energetica (up 34.32%), Chubu Electric Power (up 31.31%) and First Solar (up 26.9%) contributed positively to the performance.

The energy transition is a long-term megatrend, and S&P Global Clean Energy Index series continues to gauge the performance in the clean energy space.

1 https://www.usda.gov/media/press-releases/2023/05/16/biden-harris-administration-makes-historic-11-billion-investment

2 https://www.iea.org/reports/world-energy-investment-2023/overview-and-key-findings

3 https://www.eia.gov/todayinenergy/detail.php?id=55960

4 https://www.whitehouse.gov/briefing-room/statements-releases/2023/05/20/g7-hiroshima-leaders-communique/

The posts on this blog are opinions, not advice. Please read our Disclaimers.

Comparing Defensive Factors in the Recent Market Environment

Contributor Image
Andrew Neatt

Private Investment Advice

TD Wealth

On Sept. 17, 2020, S&P DJI’s Indexology blog shared a post I wrote titled “Comparing Defensive Factors During the Last 3 Bear Markets.” This blog is a continuation of that study, examining the results of the same factors during the 18-month period around the 2022 market correction that led the S&P 500® officially into bear market territory.

As explained in the September 2020 post, Low Volatility and Quality have been commonly referred to as defensive factors. One reason is they have historically exhibited less volatility, as measured by standard deviation, on a consistent basis. Another reason is that over the long term, the maximum drawdown of each of these indices has not matched the extent of the maximum drawdown experienced by the S&P 500. A third reason is that, on average, the S&P 500 Quality Index and the S&P 500 Low Volatility Index have outperformed the S&P 500 during the worst equity market regimes.

In the 2020 post, the bear markets of 2002, 2009 and 2020 were compared by examining the performance of the S&P 500, S&P 500 Low Volatility Index and the S&P 500 Quality Index over an 18-month period that included similar time frames pre and post equity market low. Specifically, the 2002 analysis included 88 days of recovery after the low of 2002, the 2009 analysis included 116 days of recovery after the low of 2009, and the 2020 analysis included 102 days of recovery after the most recent low. This update examines an 18-month period from June 30, 2021, to Dec. 31, 2022, including 80 days of recovery after the 2022 closing low of the S&P 500, registered on October 12.

As a refresher here are the three bear market comparisons from the 2020 report.

The three periods examined above showed the consistently reduced volatility associated with the S&P 500 Quality Index and the S&P 500 Low Volatility Index compared to its benchmark, the S&P 500, during those three bear markets. When it comes to returns, the S&P 500 Low Volatility Index and the S&P 500 Quality Index both outperformed in 2002 and 2009. However, in 2020, while the S&P 500 Quality Index outperformed the S&P 500 again, the S&P 500 Low Volatility Index underperformed.

How did the S&P 500 Quality Index and the S&P 500 Low Volatility Index fare during the most recent challenging equity market environment?

Over the 18-month period from June 30, 2021, to Dec. 31, 2022, the defensive nature of the two indices held up relatively well versus the S&P 500. Both generated superior relative returns over the measurement period, but only the S&P 500 Low Volatility Index experienced lower volatility versus the S&P 500, while the S&P 500 Quality Index was generally in line with the S&P 500.

Whether we are still in the midst of a prolonged bear market or in the early stages of a new bull market is not part of the discussion of this analysis. However, what is interesting to note from this update is that defensive factors continue to show some relative strength during poor equity environments.

The information contained herein has been provided by Andrew Neatt, Senior Portfolio Manager and Senior Investment Advisor of TD Wealth Private Investment Advice is for information purposes only. The information has been drawn from sources believed to be reliable. Graphs and charts are used for illustrative purposes only and do not reflect future values or future performance of any investment. The information does not provide financial, legal, tax or investment advice. Particular investment, tax, or trading strategies should be evaluated relative to each individual’s objectives and risk tolerance.

Index returns are shown for comparative purposes only. Indexes are unmanaged and their returns do not include any sales charges or fees as such costs would lower performance. It is not possible to invest directly in an index.

TD Wealth Private Investment Advice is a division of TD Waterhouse Canada Inc., a subsidiary of The Toronto-Dominion Bank.


The posts on this blog are opinions, not advice. Please read our Disclaimers.

Introducing the S&P SmallCap 600 QVML Top 90% Multi-Factor Index

Contributor Image
Wenli Bill Hao

Director, Factors and Dividends Indices, Product Management and Development

S&P Dow Jones Indices

For market participants seeking to measure small-cap, multi-factor equity premia with greater diversification and historically lower tracking error (TE), S&P DJI has recently launched the S&P SmallCap 600® Quality, Value, Momentum and Low Volatility (QVML) Top 90% Multi-Factor Index.

In this blog, we will examine the index construction methodology, historic performance, sector composition and factor exposure.

Methodology Overview

The S&P SmallCap 600 QVML Top 90% Multi-Factor Index uses a systematic bottom-up approach to select the top 90% stocks, ranked by their multi-factor scores, from the S&P SmallCap 600® universe. Moreover, the constituents are weighted by floated-adjusted market cap (FMC) and rebalanced quarterly. Here, the multi-factor score is defined as the average of the underlying quality, value, momentum and low volatility Z-scores.1 In essence, the index excludes the bottom 10% lowest ranked constituents based on their multi-factor scores.

Empirical back-tested analysis shows that, in the S&P SmallCap 600 universe, the lowest-ranked decile exhibited the lowest performance over the period tested. Hence, T90%, which removes the lowest-ranked decile, would have outperformed the S&P SmallCap 600. Here, stocks have been ranked by their multi-factor score and grouped into deciles (D1 = the highest ranked, D10 = the lowest ranked), as shown in Exhibit 1.

The S&P SmallCap 600 QVML Top 90% Multi-Factor Index was designed to have high diversification and low TE to its benchmark. The slopes of the lines in Exhibit 2 represent the information ratios (IR; defined as the ratio of annualized excess return divided by annualized TE) for a series of indices, each differentiated by the number of deciles removed. For example, T90% removes only the lowest-ranked decile (ranked by multi-factor score), T80% removes the two lowest-ranked deciles (i.e., the 20% lowest-ranked stocks) and so on.

As shown in Exhibit 2, T90% had the highest IR. As more deciles were removed from the back-tested results, their IRs became lower, which means the excess risk (TE) was not proportionally compensated by the excess return.

Performance Comparison

Historically, the S&P SmallCap 600 QVML Top 90% Multi-Factor Index outperformed its benchmark for all periods studied, in both the long and short term, and in terms of both total returns and risk-adjusted returns (see Exhibit 3). The empirical results show that multi-factor premia do exist over the long-term horizon.

Tracking Error and Information Ratio

Given the index design, the S&P SmallCap 600 QVML Top 90% Multi-Factor Index had a low TE over time, based on daily total return calculation (see Exhibit 4). Through targeted multi-factor exposure, the strategy generated excess return and had a positive IR for all periods studied, in both the short and long term.

Sector Composition

Exhibit 5 shows the historic sector exposures of the S&P SmallCap 600 QVML Top 90% Multi-Factor Index and the S&P 600. The small sector exposure differences (less than 1%) for all sectors show that the strategy has retained the core characteristics of its benchmark historically.

Factor Exposure

Exhibit 6 illustrates the factor exposure difference of the S&P SmallCap 600 QVML Top 90% Multi-Factor Index versus the S&P 600, as measured through the lens of the Axioma Risk Model Factor Z-scores. The strategy had higher exposures to quality (higher profitability and lower leverage ratio), value (higher earnings yield and the book-to-price ratio) and momentum, while it had lower volatility (lower beta and volatility). The findings are in line with the index design, which selects the top 90% stocks in terms of their multi-factor scores.

1 Please refer to the S&P QVML Multi-Factor Indices Methodology for more details.

The posts on this blog are opinions, not advice. Please read our Disclaimers.

iBoxx Sovereign Debt Indexing with ESG Scores and Green Bonds

Contributor Image
Paulina Lichwa-Garcia

Associate Director, Fixed Income Indices

S&P Dow Jones Indices

The iBoxx Sovereign Debt Indices span developed and emerging markets, including the iBoxx Global Government Index (GGI), iBoxx Eurozone, iBoxx USD Emerging Markets Sovereigns and iBoxx Global Emerging Market Index (GMEX) series.

Interest in government debt has increased since last year, following the “run-to-quality” amid the 2022 markets’ rout and the shift to a higher interest rate environment, which made sovereign yields attractive again.

At the same time, with sustainability considerations becoming mainstream, especially in Europe, the demand for sovereign ESG solutions has also picked up. Given the importance and the size of the sovereign debt market, sustainability benchmarks still have a lot of room to grow.

The iBoxx Indices shown in Exhibit 1 show three examples of different index solutions to approach government debt with a sustainability overlay. Exhibit 1 summarizes their key statistics and compares them to broad benchmarks.

Developed Markets: Eurozone Exposure

Firstly, the iBoxx EUR Sovereigns ESG Tilted Index reflects exposure to the eurozone government debt market by overweighing countries with a positive ESG score1 and excluding nations in the very high risk category. In addition, only countries that are considered “free” or “partially free” by Freedom House2 are included. The final composition gives higher weights to countries with favorable Sustainalytics country-risk scores.

On the other hand, the iBoxx EUR Eurozone Sovereigns Green Bonds Capped Index uses a different approach altogether. While still providing exposure to the eurozone debt market, the sustainability overlay focuses on impact, rather than risk, with constituents limited to green bonds only. After being formed by supranationals, the green bond market then became dominated by corporate issuers, and we are now seeing a steady increase in sovereign green bonds. As per their definition, green bonds must be issued with the Use of Proceeds (UoP) earmarked for environmentally friendly projects. The iBoxx solution leverages the Climate Bond Initiative’s (CBI)3 green bonds database, which uses a proprietary taxonomy aligned with the Paris decarbonization trajectory. Bonds included in the benchmark cover investment grade sovereign issuers with a minimum amount outstanding of EUR 1 billion, with additional Freedom House and ESG risk category screenings. Exhibits 2 and 3 show how these indices compare to the wider iBoxx Eurozone benchmark.

With a narrower issuer universe, the green bond strategy shows higher deviation in the country compositions compared to the iBoxx EUR Sovereigns ESG Tilted, narrowing issuers to eight countries. The index also exhibits higher yield with a higher duration exposure (see Exhibit 1).

Emerging Markets: Additional Measures

In addition to the above eurozone benchmarks, our sustainable indexing approach to emerging markets debt, the iBoxx MSCI ESG USD EM Sovereigns Quality Weighted Index, takes further fundamental metrics into consideration, in addition to a positive ESG score. These key criteria include GDP per capita, GDP growth trajectory, inflation, national debt and reserve levels, global competitiveness and the history of default. Given an increased number of parameters taken into consideration in the index construction, the index statistics and performance differ more notably from its broad benchmark, the Markit iBoxx USD Emerging Markets Sovereigns Index. The index weights shuffle substantially (see Exhibit 4) with the ESG version taking on slightly more duration (see Exhibit 1).

Conclusions

For index-based investing, the sustainability overlay in sovereign debt is likely to continue expanding and evolving. As the solutions continue to grow, they can borrow from the development of the corporate benchmarks, like ESG scores, impact investing or climate considerations metrics. However, it is important to recognize that the government debt category demands a distinct approach, with consideration of different criteria and construction methods. Amid the ongoing transitions in the sustainability landscape this year, the government debt ESG category will remain an interesting point of discussion for months to come.


1 Sustainalytics Country Risk Score.

2 Freedom House Scores.

3 Climate Bond Initiative.

The posts on this blog are opinions, not advice. Please read our Disclaimers.

Global Islamic Indices Gained over 7.5% in Q2 2023, Outperforming Conventional Benchmarks YTD

Contributor Image
John Welling

Senior Director, Head of Global Equity Indices

S&P Dow Jones Indices

Global equities ended the second quarter of the year with a gain of 6.0%, as measured by the S&P Global BMI, accumulating gains of 13.4% YTD. Shariah-compliant benchmark returns, including the S&P Global BMI Shariah and Dow Jones Islamic Market (DJIM) World Index, outperformed their conventional counterparts by about 1.5% during the quarter, building on momentum from the first quarter of the year.

Regional broad-based Shariah and conventional equity benchmarks had a positive quarter across the board. The Shariah-complaint developed markets benchmark stood out for its performance against the conventional benchmark YTD, while the Shariah-compliant emerging markets index stood out as an exception to the performance trend and continued to lag the conventional benchmark (see Exhibit 1).

Drivers of Shariah Index Performance YTD in 2023

Shariah benchmarks continued to outperform their conventional counterparts YTD, in contrast to 2022 returns. Sector composition can provide some explanation for the results during this period. A higher exposure to Information Technology stocks within Islamic indices and no exposure to conventional financial services including banks, were the main drivers of this outperformance. The Information Technology sector was up nearly 39% and represented nearly one-third of the index weight, driving the highest return contribution among all sectors (see Exhibit 2).

Meanwhile Communication Services and Consumer Discretionary also had outsized returns among sectors, which contributed significantly to the index’s outperformance despite lower representation in comparison to the largest sectors.

Energy and Utilities were the only sectors that decreased YTD. The impact from these was limited by their small weights.

MENA Equities Turn Around in Q2 2023

Following negative performance during Q1, MENA equities gained nearly 6% during Q2, as measured by the regional S&P Pan Arab Composite. GCC country performance largely followed suit, with positive returns for Saudi Arabia (8.0%), UAE (6.3%) and Kuwait (0.1%), while Bahrain surged (13.8%). Meanwhile, Qatar (-1.3%) and Oman (-0.3%) posted losses.

For more information on how Shariah-compliant benchmarks performed in Q2 2023, read our latest Shariah Scorecard https://www.spglobal.com/spdji/en/documents/performance-reports/scorecard-sp-shariah-djim.pdf

This article was first published in IFN Volume 20 Issue 28 dated July 12, 2023.

The posts on this blog are opinions, not advice. Please read our Disclaimers.