Get Indexology® Blog updates via email.

In This List

iBoxx Sovereign Debt Indexing with ESG Scores and Green Bonds

Global Islamic Indices Gained over 7.5% in Q2 2023, Outperforming Conventional Benchmarks YTD

Follow the ESG Leaders

S&P/ASX All Technology Index Boosted by Tech Turnaround

Towering Tech

iBoxx Sovereign Debt Indexing with ESG Scores and Green Bonds

Contributor Image
Paulina Lichwa-Garcia

Associate Director, Fixed Income Indices

S&P Dow Jones Indices

The iBoxx Sovereign Debt Indices span developed and emerging markets, including the iBoxx Global Government Index (GGI), iBoxx Eurozone, iBoxx USD Emerging Markets Sovereigns and iBoxx Global Emerging Market Index (GMEX) series.

Interest in government debt has increased since last year, following the “run-to-quality” amid the 2022 markets’ rout and the shift to a higher interest rate environment, which made sovereign yields attractive again.

At the same time, with sustainability considerations becoming mainstream, especially in Europe, the demand for sovereign ESG solutions has also picked up. Given the importance and the size of the sovereign debt market, sustainability benchmarks still have a lot of room to grow.

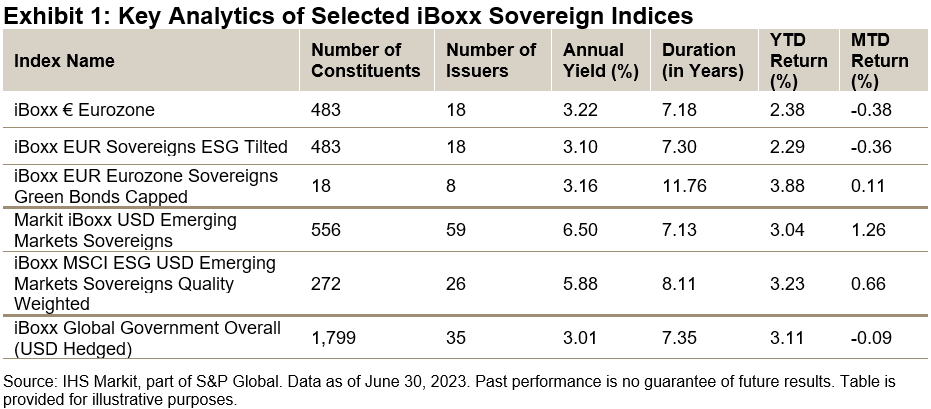
The iBoxx Indices shown in Exhibit 1 show three examples of different index solutions to approach government debt with a sustainability overlay. Exhibit 1 summarizes their key statistics and compares them to broad benchmarks.

Developed Markets: Eurozone Exposure

Firstly, the iBoxx EUR Sovereigns ESG Tilted Index reflects exposure to the eurozone government debt market by overweighing countries with a positive ESG score1 and excluding nations in the very high risk category. In addition, only countries that are considered “free” or “partially free” by Freedom House2 are included. The final composition gives higher weights to countries with favorable Sustainalytics country-risk scores.

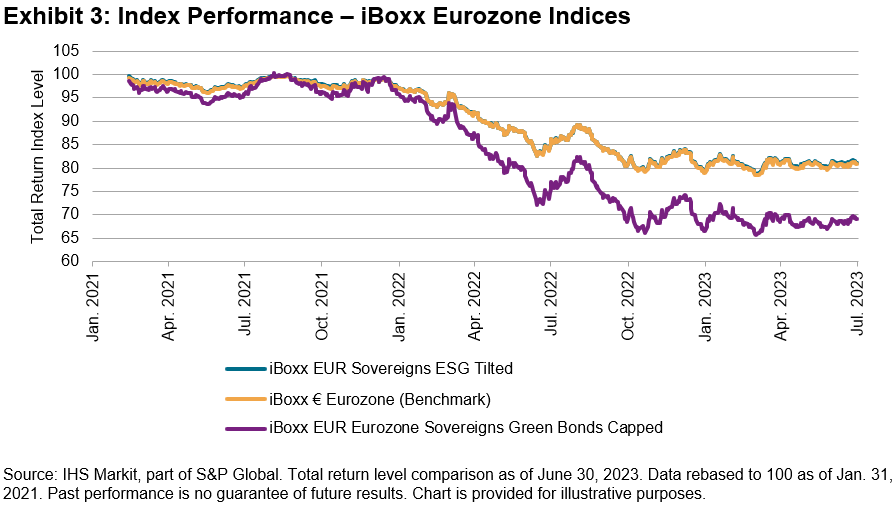
On the other hand, the iBoxx EUR Eurozone Sovereigns Green Bonds Capped Index uses a different approach altogether. While still providing exposure to the eurozone debt market, the sustainability overlay focuses on impact, rather than risk, with constituents limited to green bonds only. After being formed by supranationals, the green bond market then became dominated by corporate issuers, and we are now seeing a steady increase in sovereign green bonds. As per their definition, green bonds must be issued with the Use of Proceeds (UoP) earmarked for environmentally friendly projects. The iBoxx solution leverages the Climate Bond Initiative’s (CBI)3 green bonds database, which uses a proprietary taxonomy aligned with the Paris decarbonization trajectory. Bonds included in the benchmark cover investment grade sovereign issuers with a minimum amount outstanding of EUR 1 billion, with additional Freedom House and ESG risk category screenings. Exhibits 2 and 3 show how these indices compare to the wider iBoxx Eurozone benchmark.

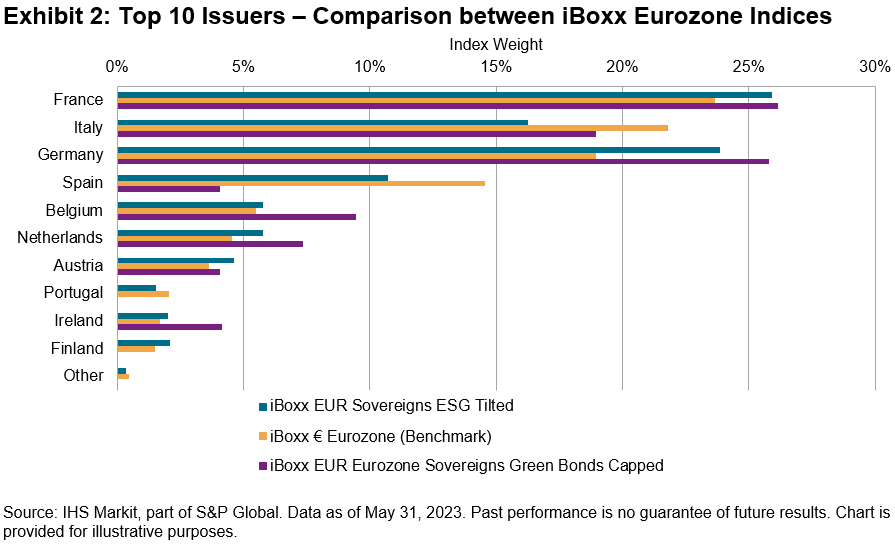
With a narrower issuer universe, the green bond strategy shows higher deviation in the country compositions compared to the iBoxx EUR Sovereigns ESG Tilted, narrowing issuers to eight countries. The index also exhibits higher yield with a higher duration exposure (see Exhibit 1).

Emerging Markets: Additional Measures

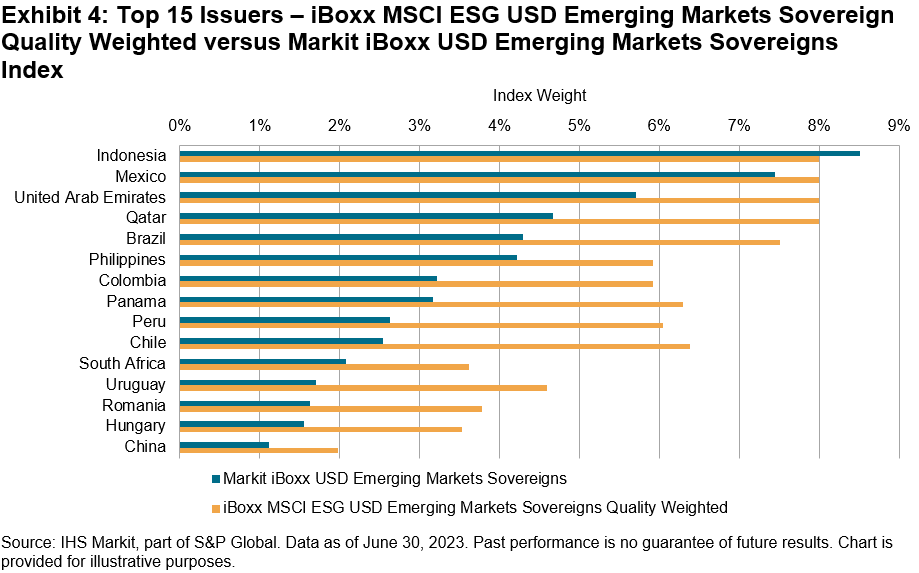
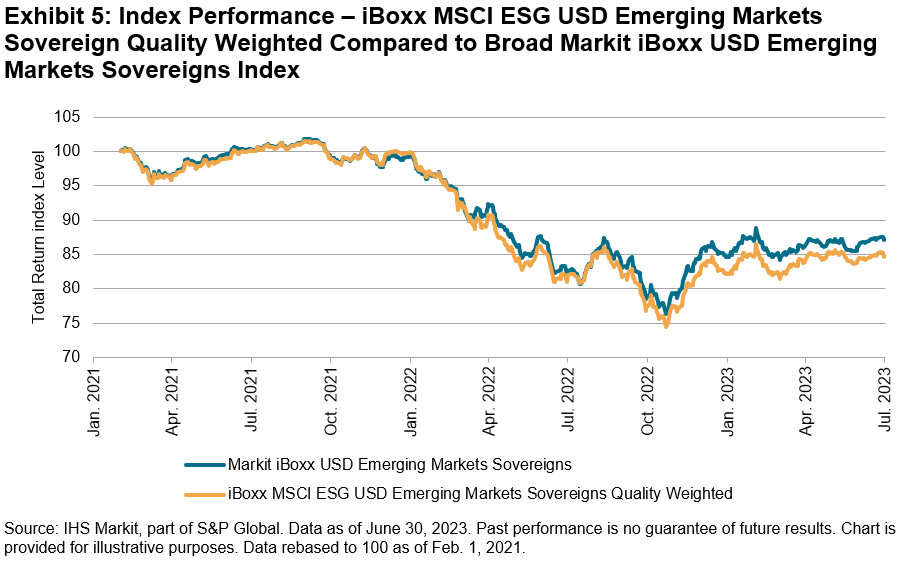
In addition to the above eurozone benchmarks, our sustainable indexing approach to emerging markets debt, the iBoxx MSCI ESG USD EM Sovereigns Quality Weighted Index, takes further fundamental metrics into consideration, in addition to a positive ESG score. These key criteria include GDP per capita, GDP growth trajectory, inflation, national debt and reserve levels, global competitiveness and the history of default. Given an increased number of parameters taken into consideration in the index construction, the index statistics and performance differ more notably from its broad benchmark, the Markit iBoxx USD Emerging Markets Sovereigns Index. The index weights shuffle substantially (see Exhibit 4) with the ESG version taking on slightly more duration (see Exhibit 1).

Conclusions

For index-based investing, the sustainability overlay in sovereign debt is likely to continue expanding and evolving. As the solutions continue to grow, they can borrow from the development of the corporate benchmarks, like ESG scores, impact investing or climate considerations metrics. However, it is important to recognize that the government debt category demands a distinct approach, with consideration of different criteria and construction methods. Amid the ongoing transitions in the sustainability landscape this year, the government debt ESG category will remain an interesting point of discussion for months to come.


1 Sustainalytics Country Risk Score.

2 Freedom House Scores.

3 Climate Bond Initiative.

The posts on this blog are opinions, not advice. Please read our Disclaimers.

Global Islamic Indices Gained over 7.5% in Q2 2023, Outperforming Conventional Benchmarks YTD

Contributor Image
John Welling

Senior Director, Head of Global Equity Indices

S&P Dow Jones Indices

Global equities ended the second quarter of the year with a gain of 6.0%, as measured by the S&P Global BMI, accumulating gains of 13.4% YTD. Shariah-compliant benchmark returns, including the S&P Global BMI Shariah and Dow Jones Islamic Market (DJIM) World Index, outperformed their conventional counterparts by about 1.5% during the quarter, building on momentum from the first quarter of the year.

Regional broad-based Shariah and conventional equity benchmarks had a positive quarter across the board. The Shariah-complaint developed markets benchmark stood out for its performance against the conventional benchmark YTD, while the Shariah-compliant emerging markets index stood out as an exception to the performance trend and continued to lag the conventional benchmark (see Exhibit 1).

Drivers of Shariah Index Performance YTD in 2023

Shariah benchmarks continued to outperform their conventional counterparts YTD, in contrast to 2022 returns. Sector composition can provide some explanation for the results during this period. A higher exposure to Information Technology stocks within Islamic indices and no exposure to conventional financial services including banks, were the main drivers of this outperformance. The Information Technology sector was up nearly 39% and represented nearly one-third of the index weight, driving the highest return contribution among all sectors (see Exhibit 2).

Meanwhile Communication Services and Consumer Discretionary also had outsized returns among sectors, which contributed significantly to the index’s outperformance despite lower representation in comparison to the largest sectors.

Energy and Utilities were the only sectors that decreased YTD. The impact from these was limited by their small weights.

MENA Equities Turn Around in Q2 2023

Following negative performance during Q1, MENA equities gained nearly 6% during Q2, as measured by the regional S&P Pan Arab Composite. GCC country performance largely followed suit, with positive returns for Saudi Arabia (8.0%), UAE (6.3%) and Kuwait (0.1%), while Bahrain surged (13.8%). Meanwhile, Qatar (-1.3%) and Oman (-0.3%) posted losses.

For more information on how Shariah-compliant benchmarks performed in Q2 2023, read our latest Shariah Scorecard https://www.spglobal.com/spdji/en/documents/performance-reports/scorecard-sp-shariah-djim.pdf

This article was first published in IFN Volume 20 Issue 28 dated July 12, 2023.

The posts on this blog are opinions, not advice. Please read our Disclaimers.

Follow the ESG Leaders

Contributor Image
Maya Beyhan

Senior Director, ESG Specialist, Index Investment Strategy

S&P Dow Jones Indices

The S&P 500® ESG Leaders Index is constructed using securities from the S&P 500 ESG Index that meet stricter sustainability criteria, while maintaining similar overall industry group weights as the S&P 500.1 The S&P 500 ESG Leaders Index takes its underlying index up a notch by applying additional exclusionary screenings based on business activities such as shale energy, nuclear power, alcoholic beverages and gambling.

Previously, we performed a real-world performance test for the S&P 500 ESG Index’s improved sustainability profile, after nearly four years since the index’s launch. From its launch date until the end of June 2023, the S&P 500 ESG Index outperformed its benchmark, the S&P 500, by a cumulative 13.3% (impressive in the context of a benchmark that is notoriously hard to beat). We found out that underweighting the lowest ESG-scoring constituents contributed the most to the S&P 500 ESG Index’s outperformance.

Now, taking a closer look at the S&P 500 ESG Leaders Index with its live performance data approaching 18 months since its launch, it also outperformed the S&P 500, by a cumulative 2.7%. But given the S&P 500 ESG Leaders Index is designed to meet stricter sustainability criteria than the underlying S&P 500 ESG Index, how important were higher or lower ESG-scoring constituents in generating this excess return? Were there similar patterns as the S&P 500 ESG Index’s outperformance?

To measure this, we adopted a similar approach as we did for the S&P 500 ESG Index and created hypothetical ESG “quintile portfolios,” reconstituted annually by ranking the S&P 500’s constituents by their ESG score and assigning each to one of five portfolios, from highest to lowest ESG score. The hypothetical cap-weighted performance of these portfolios was then calculated and used to create a Brinson-like2 “ESG attribution,” teasing out the importance of ESG exposures in the returns of the S&P 500 ESG Leaders Index.

Exhibit 1 summarizes the results of this analysis, including the average weights of the S&P 500 ESG Leaders Index and the S&P 500 in each ESG quintile (from high to low scoring), the corresponding portfolio and index returns, as well as a summary of the corresponding allocation and selection effects over the full period.3

The allocation, selection and total effects from over- and underweighting across and within the ESG quintiles was positive in every quintile. Underweighting the lowest ESG-scoring constituents, on average, contributed 0.21% to the S&P 500 ESG Leaders Index’s outperformance. But the highest ESG-scoring constituents also contributed a significant proportion of the S&P 500 ESG Leaders Index’s relative performance. The High ESG Quintile 1 and Q2 outperformed the S&P 500 by 1.9% and 3.1%, respectively, and the S&P 500 ESG Leaders Index overweighted these quintiles by an average of 9.1% and 4.9%, respectively, leading to a total contribution of 0.34% from allocation effects to these top quintiles.

Drilling down, Exhibit 2 compares the performance of the lowest and highest ESG quintiles to the S&P 500 since the launch of the S&P 500 ESG Leaders Index and two further sub-periods. The second highest ESG-scoring quintile (Q2) outperformed consistently in 2022 and YTD in 2023. The Low ESG Quintile (Q5) underperformed by 7.8% in 2022 but outperformed by 8.1% YTD. Underweighting this quintile contributed positively to relative index performance in 2022.

Exhibits 1 and 2 together show that, in short: the S&P 500 ESG Leaders Index methodology of seeking the best-scoring constituents, as well as avoiding the worst-scoring constituents, worked in its favor overall.

Market participants sometimes consider ESG as being about avoiding the “worst.” The S&P 500 ESG Leaders Index’s outperformance since launch suggests that there may be value in following the leaders, too.

Performance drivers surely do change over time. Investors can utilize ESG-based attribution analysis such as these to gain insight and perspective as markets and conditions evolve. Similar attributions for our range of flagship indices are now available—updated as of the most recent quarter-end—in S&P DJI’s Sustainability Index Dashboard.

Register here to receive quarterly insights and performance attributions for our range of flagship sustainability and climate indices.


1 How & Why the S&P 500 ESG Leaders Index Work

2 Similar to our previous analysis with Carbon Quintiles, the quintile portfolios are each assigned an equal number of benchmark constituents, and the impact of weighting to stocks with higher or lower ESG scores is measured analogously to the way sector or country effects are measured by a traditional Brinson attribution.

3 Analysis carried out using the Portfolio Analytics tool on S&P Capital IQ Pro.

The posts on this blog are opinions, not advice. Please read our Disclaimers.

S&P/ASX All Technology Index Boosted by Tech Turnaround

Contributor Image
Sean Freer

Director, Global Equity Indices

S&P Dow Jones Indices

Following a poor 2022, the Information Technology sector has proven itself to be the outstanding performer in Australian equities in 2023. Despite rising interest rates, higher bond yields and weakening consumer confidence, market participants have still seen value in the Tech sector thus far in 2023. Tech’s turnaround has benefited the S&P/ASX All Technology Index, which has significantly outperformed the S&P/ASX 200 over the past 6 and 12 months.

Launched in February 2020, the S&P/ASX All Technology Index provides representation to innovative technology-oriented companies across a broad range of sectors and industries. Currently comprising 37 companies, the index provides access to not just the Information Technology sector, but also to companies in specific sub-industries within the Health Care, Consumer Discretionary,1 Communication Services, Industrials and Financials sectors. Those sub-industries are Interactive Media & Services, Health Care Technology, Consumer Electronics, Data Processing & Outsourced Services and Transaction & Payment Processing Services.

Performance Drivers

Sector performance within the S&P/ASX 200 has been relatively clustered in 2023. The most notable outlier is the Information Technology sector, which surged ahead in Q2. Information Technology companies, along with those in Communication Services and Health Care sectors, are among the key contributors to outperformance for the S&P/ASX All Technology Index in 2023.

New Additions

Two new companies were added to the S&P/ASX All Technology Index at the latest rebalance in June: Cogstate and FINEOS Corporation. Cogstate is classified in the Health Care Technology sub-industry and is involved in combining cognitive science expertise with digital innovations through clinical trials, healthcare and research. FINEOS Corporation is a software company providing modern customer-centric core software to the employee benefits and life, accident and health industry.

1 Note, there are currently no companies from the Consumer Electronics sub-industry of the Discretionary Sector eligible for index inclusion.

The posts on this blog are opinions, not advice. Please read our Disclaimers.

Towering Tech

Contributor Image
Anu Ganti

U.S. Head of Index Investment Strategy

S&P Dow Jones Indices

The performance of large-cap Technology stocks so far this year has been exceptional, with the S&P 500® Information Technology sector outperforming the S&P 500 by 26% over the six-month period ending June 30, 2023—the 97th percentile of all observations in our database. Tech’s outperformance, driven by mega-cap strength, has been especially notable because of its narrow breadth.

In this environment, concentration concerns naturally come to mind. The Herfindahl-Hirschman Index (HHI) is a widely used concentration measure; it’s defined as the sum of the squared weights of an index’s constituents. Other things equal, a higher HHI indicates an increased level of concentration, but even for completely unconcentrated equal-weight portfolios, the HHI level is inversely related to the number of names. In order to use the HHI to make comparisons within the Tech sector over time, we use an adjusted HHI, defined as the sector’s HHI divided by the HHI of an equal-weighted portfolio with the same number of stocks. A higher adjusted HHI means that a sector is becoming more concentrated, independent of the number of stocks it contains.

Tech’s current adjusted HHI level of 9.6 is in the 99th percentile of observations, as we observe in Exhibit 1, indicating an extreme level of concentration for the sector compared to the long-term average of 4.9. As Exhibit 1 shows, when concentration has been relatively high in the past, it has subsequently tended to decline.

Another way to visualize the movement of concentration over time is to sort our data points into deciles based on Tech’s change in adjusted HHI over the past five years and measure the sector’s average percentage change in adjusted HHI during the subsequent five years. We see a clear negative relationship in Exhibit 2—an indication of mean reversion in action. Currently, Tech’s change in adjusted HHI of 118% over the five-year period ending in June 2023 is unusually high compared to the change of 5% during the prior five-year period ending in June 2018, indicating the rarity of the recent market regime.

The tendency of Tech concentration to reverse has important implications for the performance of equal-weight sector strategies. Exhibit 3 illustrates the relationship between the Tech sector’s adjusted HHI with the relative performance of the S&P 500 Equal Weight Information Technology Index compared with its cap-weighted counterpart. Typically, after peaks in concentration (such as during 1990, 1999 and 2002), equal-weighted Tech has outperformed.

While apprehensions about concentration naturally bring back memories of the 1990s tech bubble alongside potential headwinds for active managers, we should note that today’s Tech sector is very different from that of the 1990s. More importantly, the role of an index is to reflect the market, and history can help us understand the dynamics of the various index weighting options available to track specific market segments.

The author would like to thank Austin Stoll for his contributions.

The posts on this blog are opinions, not advice. Please read our Disclaimers.