Get Indexology® Blog updates via email.

In This List

S&P/ASX All Technology Index Boosted by Tech Turnaround

Towering Tech

S&P GSCI Mid-Year Recap and Lithium Added to S&P GSCI Electric Vehicle Metals Index

Sustainability within the Modern Commodity Allocation – The S&P GSCI Light Energy Climate Aware Is Launched

S&P 500 Low Volatility Index May 2023 Rebalance

S&P/ASX All Technology Index Boosted by Tech Turnaround

Contributor Image
Sean Freer

Director, Global Equity Indices

S&P Dow Jones Indices

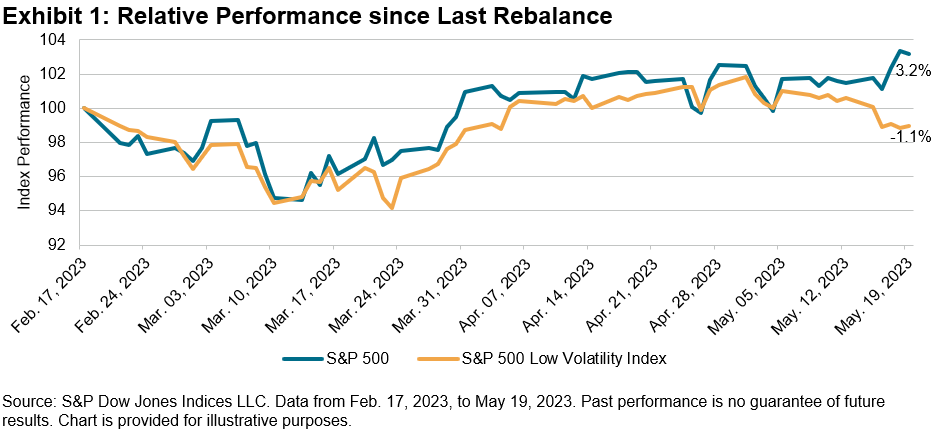
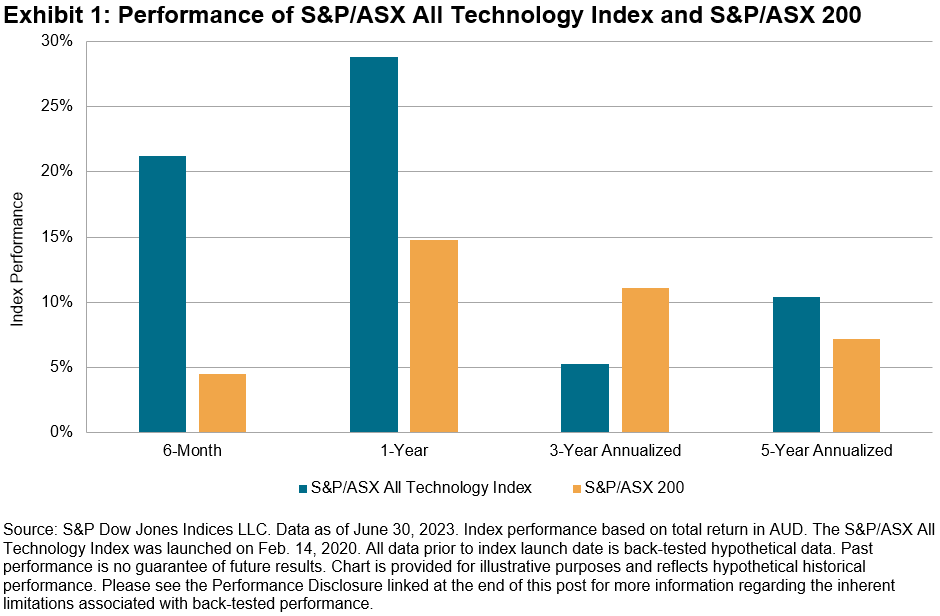
Following a poor 2022, the Information Technology sector has proven itself to be the outstanding performer in Australian equities in 2023. Despite rising interest rates, higher bond yields and weakening consumer confidence, market participants have still seen value in the Tech sector thus far in 2023. Tech’s turnaround has benefited the S&P/ASX All Technology Index, which has significantly outperformed the S&P/ASX 200 over the past 6 and 12 months.

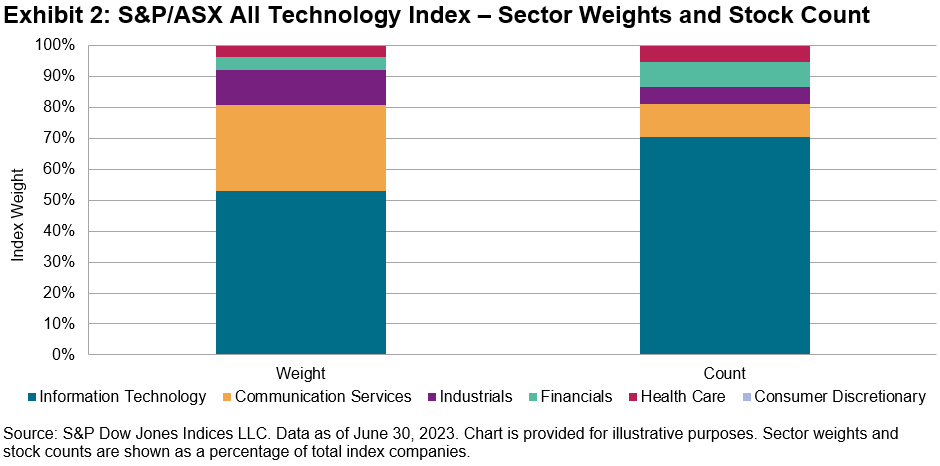
Launched in February 2020, the S&P/ASX All Technology Index provides representation to innovative technology-oriented companies across a broad range of sectors and industries. Currently comprising 37 companies, the index provides access to not just the Information Technology sector, but also to companies in specific sub-industries within the Health Care, Consumer Discretionary,1 Communication Services, Industrials and Financials sectors. Those sub-industries are Interactive Media & Services, Health Care Technology, Consumer Electronics, Data Processing & Outsourced Services and Transaction & Payment Processing Services.

Performance Drivers

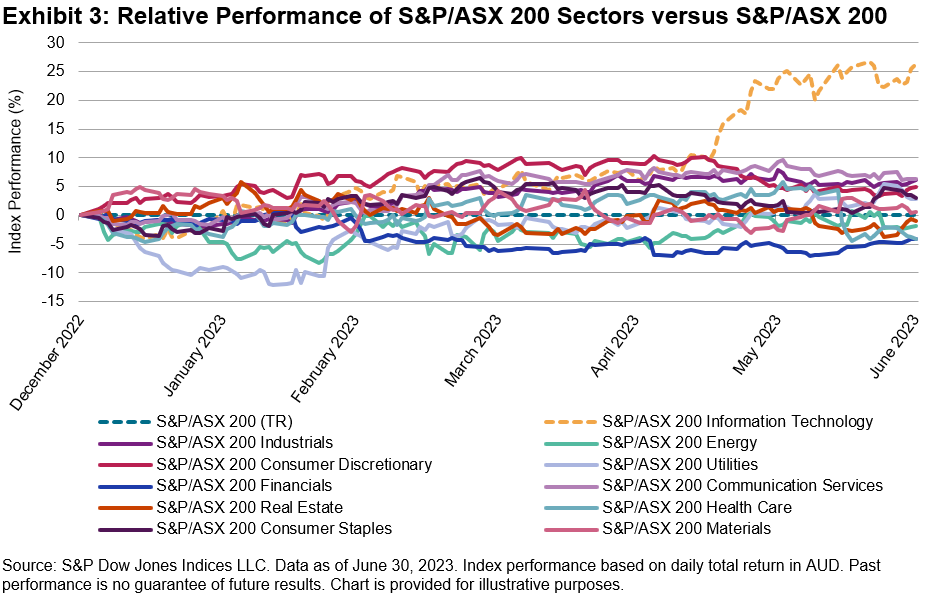
Sector performance within the S&P/ASX 200 has been relatively clustered in 2023. The most notable outlier is the Information Technology sector, which surged ahead in Q2. Information Technology companies, along with those in Communication Services and Health Care sectors, are among the key contributors to outperformance for the S&P/ASX All Technology Index in 2023.

New Additions

Two new companies were added to the S&P/ASX All Technology Index at the latest rebalance in June: Cogstate and FINEOS Corporation. Cogstate is classified in the Health Care Technology sub-industry and is involved in combining cognitive science expertise with digital innovations through clinical trials, healthcare and research. FINEOS Corporation is a software company providing modern customer-centric core software to the employee benefits and life, accident and health industry.

1 Note, there are currently no companies from the Consumer Electronics sub-industry of the Discretionary Sector eligible for index inclusion.

The posts on this blog are opinions, not advice. Please read our Disclaimers.

Towering Tech

Contributor Image
Anu Ganti

U.S. Head of Index Investment Strategy

S&P Dow Jones Indices

The performance of large-cap Technology stocks so far this year has been exceptional, with the S&P 500® Information Technology sector outperforming the S&P 500 by 26% over the six-month period ending June 30, 2023—the 97th percentile of all observations in our database. Tech’s outperformance, driven by mega-cap strength, has been especially notable because of its narrow breadth.

In this environment, concentration concerns naturally come to mind. The Herfindahl-Hirschman Index (HHI) is a widely used concentration measure; it’s defined as the sum of the squared weights of an index’s constituents. Other things equal, a higher HHI indicates an increased level of concentration, but even for completely unconcentrated equal-weight portfolios, the HHI level is inversely related to the number of names. In order to use the HHI to make comparisons within the Tech sector over time, we use an adjusted HHI, defined as the sector’s HHI divided by the HHI of an equal-weighted portfolio with the same number of stocks. A higher adjusted HHI means that a sector is becoming more concentrated, independent of the number of stocks it contains.

Tech’s current adjusted HHI level of 9.6 is in the 99th percentile of observations, as we observe in Exhibit 1, indicating an extreme level of concentration for the sector compared to the long-term average of 4.9. As Exhibit 1 shows, when concentration has been relatively high in the past, it has subsequently tended to decline.

Another way to visualize the movement of concentration over time is to sort our data points into deciles based on Tech’s change in adjusted HHI over the past five years and measure the sector’s average percentage change in adjusted HHI during the subsequent five years. We see a clear negative relationship in Exhibit 2—an indication of mean reversion in action. Currently, Tech’s change in adjusted HHI of 118% over the five-year period ending in June 2023 is unusually high compared to the change of 5% during the prior five-year period ending in June 2018, indicating the rarity of the recent market regime.

The tendency of Tech concentration to reverse has important implications for the performance of equal-weight sector strategies. Exhibit 3 illustrates the relationship between the Tech sector’s adjusted HHI with the relative performance of the S&P 500 Equal Weight Information Technology Index compared with its cap-weighted counterpart. Typically, after peaks in concentration (such as during 1990, 1999 and 2002), equal-weighted Tech has outperformed.

While apprehensions about concentration naturally bring back memories of the 1990s tech bubble alongside potential headwinds for active managers, we should note that today’s Tech sector is very different from that of the 1990s. More importantly, the role of an index is to reflect the market, and history can help us understand the dynamics of the various index weighting options available to track specific market segments.

The author would like to thank Austin Stoll for his contributions.

The posts on this blog are opinions, not advice. Please read our Disclaimers.

S&P GSCI Mid-Year Recap and Lithium Added to S&P GSCI Electric Vehicle Metals Index

Contributor Image
Brian Luke

Senior Director, Head of Commodities, Real & Digital Assets

S&P Dow Jones Indices

Surging futures activity on CME Group’s lithium contract allowed for entry into the S&P GSCI Electric Vehicle (EV) Metals Index. This milestone reflects the changing nature of indices to maintain a representative share of the global commodities market. The largest and most recognizable benchmark for commodities, the S&P GSCI, reviews contract eligibility for existing and potentially new contracts. This review allows for the index to add new commodities, like lithium, to commodity giants like wheat, cattle and crude oil. Spoiler alert: lithium has a long way to go in terms of production and trade volumes to qualify for the flagship S&P GSCI. But this raises the question of how indices evolve and what other commodities could enter new and existing indices. In this blog, we attempt to answer that for lithium as well as for the broader commodities market.

The S&P GSCI EV Metals Index seeks to reflect the performance of the tradeable metals used in the production of an electric vehicle. The expertise of S&P Global Commodity Insights is utilized to determine the index constituents and production weights to ensure the index broadly reflects the relative metal usage in a representative EV. To meet liquidity requirements for the financial products that track the index, minimum volume thresholds ensure investability.

Oil futures made their debut on the NY Mercantile Exchange over 40 years ago. A production-weighted index with liquidity filters, the S&P GSCI added light sweet crude oil in 1987, when it took on about one-third of the broad commodities benchmark. With the addition of Brent crude oil to the West Texas Intermediate, the oil component started to dominate the commodities market, peaking at 56% in 2008, which coincided with the fracking boom that transformed the economy and led the U.S. out of the Great Financial Crisis. Energy continues to dominate the global markets and oil remains king. However, peak oil, as measured by the total production and value of commodities traded globally, appears to be waning.

Like early millennials who were born in the 1980s, oil futures are now 40 years old and face a new generation entering adulthood. This new generation of futures contracts are iron ore, cobalt and lithium, which, combined with industrial metals, have come to create a new “sector” of commodities and power the energy transition economy. While these contracts make up the S&P GSCI EV Metals Index, they currently do not qualify for the S&P GSCI. Iron ore is the longest-tenured contract and meets liquidity requirements, but other rules currently prevent it from entering. Exchange location, liquidity and volumes on a particular venue come into play. For example, copper traded on the LME is an S&P GSCI constituent, while copper traded on the COMEX is not.

Quarterly Recap of the Market

Lean hogs and natural gas rebounded in June but remained among the worst-performing commodities in the S&P GSCI YTD. The Dallas Fed Energy Survey showed businesses were no longer expanding for the first time since 2020. On the other side of the pond, Ukraine’s energy minister believes Russia could shut off Russian gas to Europe by the end of 2024, when Ukraine’s supply contract with Gazprom expires. Last year, estimated global nickel mine production increased by about 20%, with the increased production attributed to Indonesia. Forecasts by the International Nickel Study Group maintained that supply growth is forecasted to continue in 2023, though monthly performance appears to have stabilized during June trading. Half-year leaders in commodities were cocoa, sugar and cattle, which have all dealt with weather-related supply shocks: El Niño conditions in West Africa, 2022’s drought conditions leading to supply shortages across sugar-producing regions in Asia and the thinning of North American cattle herds. Cattle futures are currently at an all-time high. Considering downstream impacts, the outlook calls for swapping out beef for pork on your summer barbecues and laying off the venti mocha swirls.

The posts on this blog are opinions, not advice. Please read our Disclaimers.

Sustainability within the Modern Commodity Allocation – The S&P GSCI Light Energy Climate Aware Is Launched

Contributor Image
Jim Wiederhold

Former Director, Commodities and Real Assets

S&P Dow Jones Indices

After extensive market outreach, S&P Dow Jones Indices launched the S&P GSCI Light Energy Climate Aware to satisfy a need for a benchmark tied to sustainability and the energy transition, but with a lighter energy weighting than the new S&P GSCI Climate Aware. As can be seen in Exhibit 1, the S&P GSCI Light Energy Climate Aware applies the S&P Global Sustainable1 Commodity Environmental Dataset to the popular S&P GSCI Light Energy in order to provide a commodities benchmark with a 25% lower environmental impact per dollar invested, which provides market participants a commodities overlay within a sustainable strategy. The index has lower weights to fossil fuel commodities while boosting the weights of less environmentally intense commodities tied to the energy transition.

Compared with petroleum, the production of commodities such as copper, nickel, zinc and gold is much less disruptive to the environment, and these commodities will also be key to the world’s new electric economy during the energy transition. Earlier this year, we published a blog highlighting the importance of copper in particular as possibly the most important natural resource needed to help us move away from our current carbon intensive energy systems.

Copper is one of the least carbon intensive commodities to produce among the industrial metals, but it is also one of the major natural resources comprising electric vehicles and renewable energy applications such as wind turbines. Exhibit 2 shows the current environmental footprint of the production of each of the 24 commodities within the S&P GSCI. Within our global food supply, cattle production is highly environmentally intensive and was one of the commodities within our new index that saw the biggest percentage drops in weight compared to the benchmark index.

Sustainability is a key theme within the investing community, but prior to S&P DJI’s launch of our climate aware commodity indices, there were only index offerings that represented sustainable considerations within an equity or fixed income portion of a strategy. Now with the S&P GSCI Light Energy Climate Aware, market participants can apply those considerations to their commodity strategies, taking advantage of the inflation hedging and diversification characteristics historically provided by this asset class.

S&P DJI continues to be the leader when it comes to bringing innovative, sustainability-focused index offerings to the market. The S&P GSCI Light Energy Climate Aware is another example of how we look to drive transparency and incorporate sustainability criteria into our benchmark indices.

The posts on this blog are opinions, not advice. Please read our Disclaimers.

S&P 500 Low Volatility Index May 2023 Rebalance

Contributor Image
George Valantasis

Associate Director, Factors and Dividends

S&P Dow Jones Indices

Since the last rebalance for the S&P 500® Low Volatility Index on Feb. 17, 2023, the S&P 500 finished up 3.2% despite briefly dropping in mid-March during the collapse of Silicon Valley Bank. Exhibit 1 shows that during this period, the S&P 500 Low Volatility Index underperformed the S&P 500 by 4.3%. This divergence is mainly due to the significant performance contributions from the mega-cap tech stocks as a result of their strong performance and large weights in the S&P 500.

Exhibit 2 shows that the overall trailing one-year volatility decreased slightly since the end of January. Measured in absolute terms, volatility decreased the most for the Information Technology and Consumer Discretionary sectors, falling 2.4% and 2.2%, respectively. Out of the 11 GICS® sectors, 9 had their trailing one-year volatility reduced during the period, with the exceptions being the Real Estate and Utilities sectors, which increased just 0.3% and 0.4%, respectively. As of April 28, 2023, Energy, Consumer Discretionary, Communication Services, Information Technology and Real Estate were the top five most volatile sectors in the S&P 500.

As a result of the overall decrease in volatility, the low volatility index’s latest rebalance brought some changes to the sector weights.

The latest rebalance for the S&P 500 Low Volatility Index shifted an additional 4% weight to the Consumer Staples sector. Similarly, Communication Services and Real Estate each gained ground and added 1% weight to their sectors. Despite minor changes in volatility at the sector level for Utilities and Financials, these two sectors lost the most weight in the index at 3% and 1%, respectively.

Communication Services, Information Technology and Real Estate were the most underweighted sectors in the latest rebalance of the low volatility index (effective after the market close on May 19, 2023).


The posts on this blog are opinions, not advice. Please read our Disclaimers.