Get Indexology® Blog updates via email.

In This List

S&P GSCI Mid-Year Recap and Lithium Added to S&P GSCI Electric Vehicle Metals Index

Sustainability within the Modern Commodity Allocation – The S&P GSCI Light Energy Climate Aware Is Launched

S&P 500 Low Volatility Index May 2023 Rebalance

The S&P GARP Index Series Expands to Include S&P MidCap 400 and S&P SmallCap 600 Versions

How Does the S&P 500 ESG Index Work?

S&P GSCI Mid-Year Recap and Lithium Added to S&P GSCI Electric Vehicle Metals Index

Contributor Image
Brian Luke

Senior Director, Head of Commodities, Real & Digital Assets

S&P Dow Jones Indices

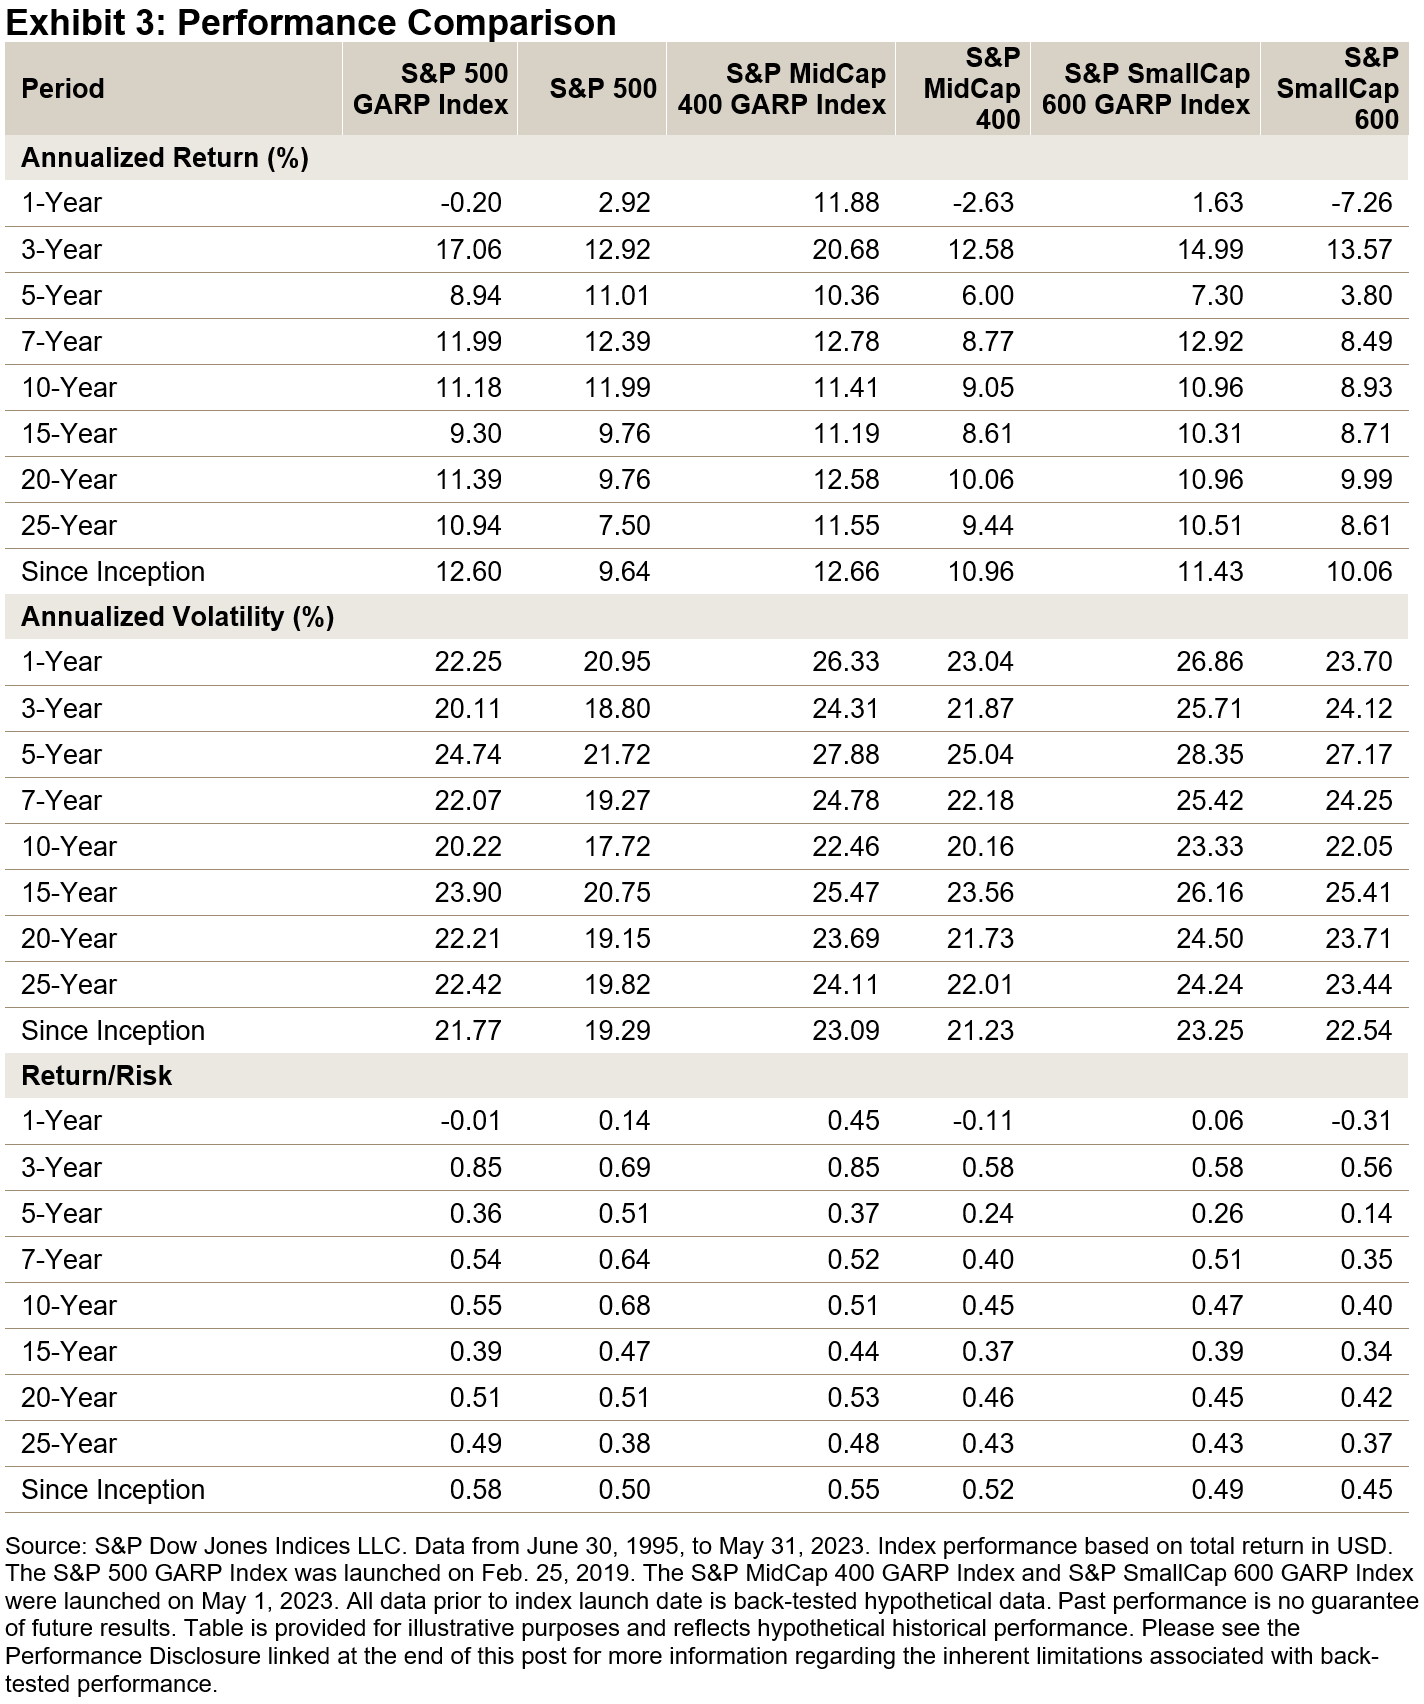
Surging futures activity on CME Group’s lithium contract allowed for entry into the S&P GSCI Electric Vehicle (EV) Metals Index. This milestone reflects the changing nature of indices to maintain a representative share of the global commodities market. The largest and most recognizable benchmark for commodities, the S&P GSCI, reviews contract eligibility for existing and potentially new contracts. This review allows for the index to add new commodities, like lithium, to commodity giants like wheat, cattle and crude oil. Spoiler alert: lithium has a long way to go in terms of production and trade volumes to qualify for the flagship S&P GSCI. But this raises the question of how indices evolve and what other commodities could enter new and existing indices. In this blog, we attempt to answer that for lithium as well as for the broader commodities market.

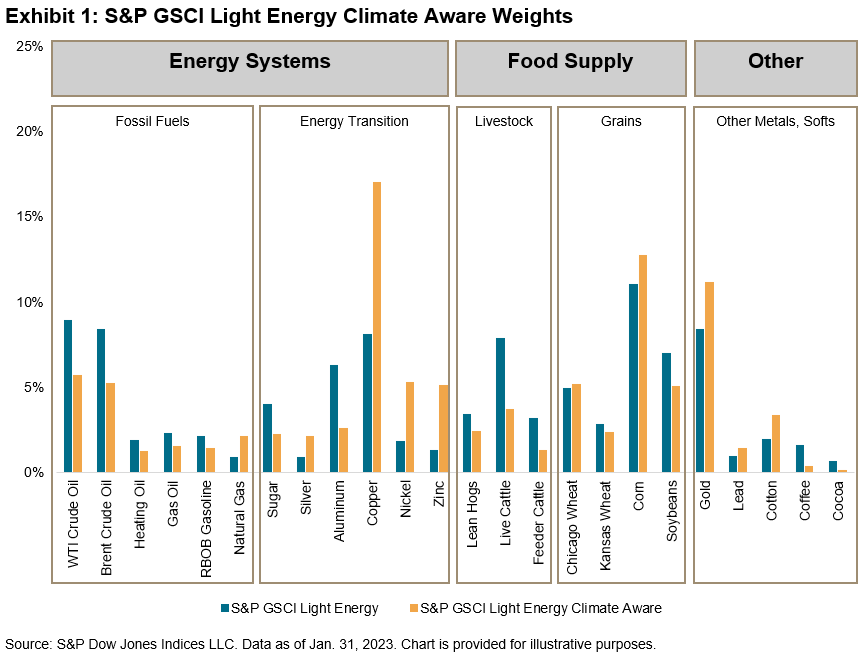
The S&P GSCI EV Metals Index seeks to reflect the performance of the tradeable metals used in the production of an electric vehicle. The expertise of S&P Global Commodity Insights is utilized to determine the index constituents and production weights to ensure the index broadly reflects the relative metal usage in a representative EV. To meet liquidity requirements for the financial products that track the index, minimum volume thresholds ensure investability.

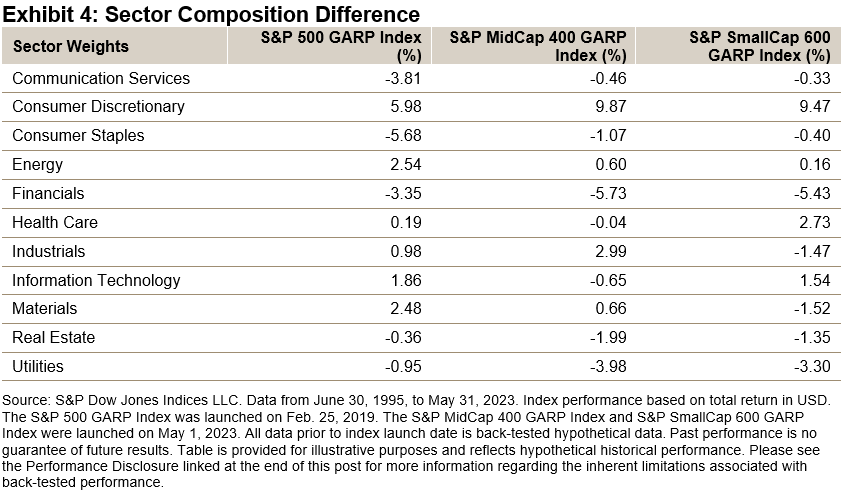
Oil futures made their debut on the NY Mercantile Exchange over 40 years ago. A production-weighted index with liquidity filters, the S&P GSCI added light sweet crude oil in 1987, when it took on about one-third of the broad commodities benchmark. With the addition of Brent crude oil to the West Texas Intermediate, the oil component started to dominate the commodities market, peaking at 56% in 2008, which coincided with the fracking boom that transformed the economy and led the U.S. out of the Great Financial Crisis. Energy continues to dominate the global markets and oil remains king. However, peak oil, as measured by the total production and value of commodities traded globally, appears to be waning.

Like early millennials who were born in the 1980s, oil futures are now 40 years old and face a new generation entering adulthood. This new generation of futures contracts are iron ore, cobalt and lithium, which, combined with industrial metals, have come to create a new “sector” of commodities and power the energy transition economy. While these contracts make up the S&P GSCI EV Metals Index, they currently do not qualify for the S&P GSCI. Iron ore is the longest-tenured contract and meets liquidity requirements, but other rules currently prevent it from entering. Exchange location, liquidity and volumes on a particular venue come into play. For example, copper traded on the LME is an S&P GSCI constituent, while copper traded on the COMEX is not.

Quarterly Recap of the Market

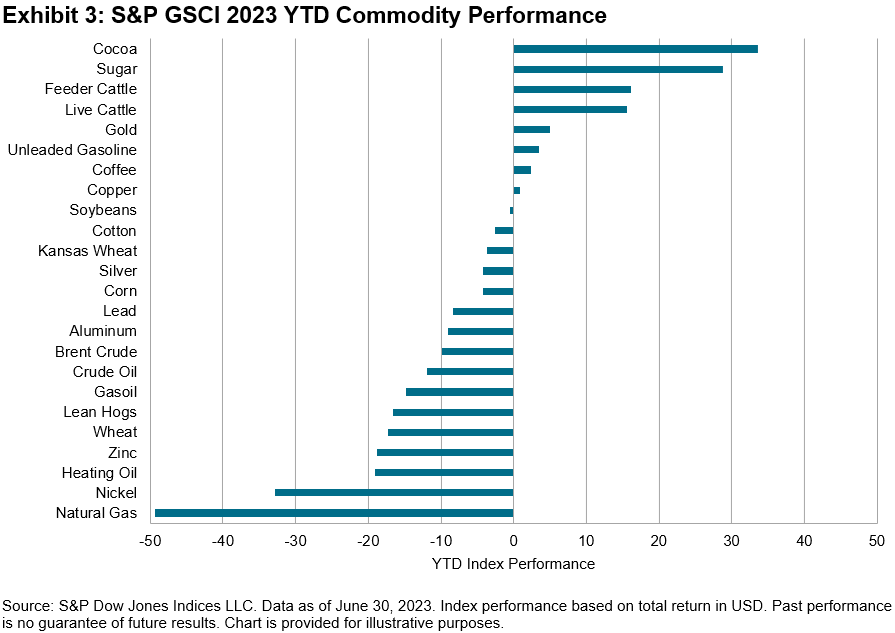
Lean hogs and natural gas rebounded in June but remained among the worst-performing commodities in the S&P GSCI YTD. The Dallas Fed Energy Survey showed businesses were no longer expanding for the first time since 2020. On the other side of the pond, Ukraine’s energy minister believes Russia could shut off Russian gas to Europe by the end of 2024, when Ukraine’s supply contract with Gazprom expires. Last year, estimated global nickel mine production increased by about 20%, with the increased production attributed to Indonesia. Forecasts by the International Nickel Study Group maintained that supply growth is forecasted to continue in 2023, though monthly performance appears to have stabilized during June trading. Half-year leaders in commodities were cocoa, sugar and cattle, which have all dealt with weather-related supply shocks: El Niño conditions in West Africa, 2022’s drought conditions leading to supply shortages across sugar-producing regions in Asia and the thinning of North American cattle herds. Cattle futures are currently at an all-time high. Considering downstream impacts, the outlook calls for swapping out beef for pork on your summer barbecues and laying off the venti mocha swirls.

The posts on this blog are opinions, not advice. Please read our Disclaimers.

Sustainability within the Modern Commodity Allocation – The S&P GSCI Light Energy Climate Aware Is Launched

Contributor Image
Jim Wiederhold

Former Director, Commodities and Real Assets

S&P Dow Jones Indices

After extensive market outreach, S&P Dow Jones Indices launched the S&P GSCI Light Energy Climate Aware to satisfy a need for a benchmark tied to sustainability and the energy transition, but with a lighter energy weighting than the new S&P GSCI Climate Aware. As can be seen in Exhibit 1, the S&P GSCI Light Energy Climate Aware applies the S&P Global Sustainable1 Commodity Environmental Dataset to the popular S&P GSCI Light Energy in order to provide a commodities benchmark with a 25% lower environmental impact per dollar invested, which provides market participants a commodities overlay within a sustainable strategy. The index has lower weights to fossil fuel commodities while boosting the weights of less environmentally intense commodities tied to the energy transition.

Compared with petroleum, the production of commodities such as copper, nickel, zinc and gold is much less disruptive to the environment, and these commodities will also be key to the world’s new electric economy during the energy transition. Earlier this year, we published a blog highlighting the importance of copper in particular as possibly the most important natural resource needed to help us move away from our current carbon intensive energy systems.

Copper is one of the least carbon intensive commodities to produce among the industrial metals, but it is also one of the major natural resources comprising electric vehicles and renewable energy applications such as wind turbines. Exhibit 2 shows the current environmental footprint of the production of each of the 24 commodities within the S&P GSCI. Within our global food supply, cattle production is highly environmentally intensive and was one of the commodities within our new index that saw the biggest percentage drops in weight compared to the benchmark index.

Sustainability is a key theme within the investing community, but prior to S&P DJI’s launch of our climate aware commodity indices, there were only index offerings that represented sustainable considerations within an equity or fixed income portion of a strategy. Now with the S&P GSCI Light Energy Climate Aware, market participants can apply those considerations to their commodity strategies, taking advantage of the inflation hedging and diversification characteristics historically provided by this asset class.

S&P DJI continues to be the leader when it comes to bringing innovative, sustainability-focused index offerings to the market. The S&P GSCI Light Energy Climate Aware is another example of how we look to drive transparency and incorporate sustainability criteria into our benchmark indices.

The posts on this blog are opinions, not advice. Please read our Disclaimers.

S&P 500 Low Volatility Index May 2023 Rebalance

Contributor Image
George Valantasis

Associate Director, Factors and Dividends

S&P Dow Jones Indices

Since the last rebalance for the S&P 500® Low Volatility Index on Feb. 17, 2023, the S&P 500 finished up 3.2% despite briefly dropping in mid-March during the collapse of Silicon Valley Bank. Exhibit 1 shows that during this period, the S&P 500 Low Volatility Index underperformed the S&P 500 by 4.3%. This divergence is mainly due to the significant performance contributions from the mega-cap tech stocks as a result of their strong performance and large weights in the S&P 500.

Exhibit 2 shows that the overall trailing one-year volatility decreased slightly since the end of January. Measured in absolute terms, volatility decreased the most for the Information Technology and Consumer Discretionary sectors, falling 2.4% and 2.2%, respectively. Out of the 11 GICS® sectors, 9 had their trailing one-year volatility reduced during the period, with the exceptions being the Real Estate and Utilities sectors, which increased just 0.3% and 0.4%, respectively. As of April 28, 2023, Energy, Consumer Discretionary, Communication Services, Information Technology and Real Estate were the top five most volatile sectors in the S&P 500.

As a result of the overall decrease in volatility, the low volatility index’s latest rebalance brought some changes to the sector weights.

The latest rebalance for the S&P 500 Low Volatility Index shifted an additional 4% weight to the Consumer Staples sector. Similarly, Communication Services and Real Estate each gained ground and added 1% weight to their sectors. Despite minor changes in volatility at the sector level for Utilities and Financials, these two sectors lost the most weight in the index at 3% and 1%, respectively.

Communication Services, Information Technology and Real Estate were the most underweighted sectors in the latest rebalance of the low volatility index (effective after the market close on May 19, 2023).


The posts on this blog are opinions, not advice. Please read our Disclaimers.

The S&P GARP Index Series Expands to Include S&P MidCap 400 and S&P SmallCap 600 Versions

Contributor Image
Wenli Bill Hao

Director, Factors and Dividends Indices, Product Management and Development

S&P Dow Jones Indices

The S&P 500® GARP (Growth at a Reasonable Price) Index was launched in February 2019 to strike a balance between pure growth and pure valuation. Due to its popularity among market participants, this index series has recently been expanded to include the S&P MidCap 400® GARP Index and the S&P SmallCap 600 GARP® Index.

The S&P GARP Index Series strives to select companies with consistent earnings and sales growth, as well as strong earnings power, solid financial strength and reasonable valuation. Since the launch of the S&P 500 GARP Index, global economies have weathered the COVID-19 pandemic and the ongoing Ukraine-Russia conflict. As a result, high inflation and rising interest rates have been hallmarks of this time period. From the beginning of 2020 through to the end of May 2023, it is interesting to note that all three S&P GARP indices have outperformed their corresponding benchmarks (See Exhibit 1) by a wide margin. Therefore, selecting profitable growth stocks with more reasonable valuations has been a worthwhile strategy during this period.

In this blog, we will examine the S&P GARP Indices’ construction methodology, historical performance, sector compositions and factor exposures.

Methodology Overview 

The S&P GARP Index methodology uses a two-layer sequential filtering approach to select its constituents.1 In the first step (filter 1), stocks are ranked by their growth z-scores (three-year EPS and SPS growth), with a targeted number of top-ranked stocks remaining eligible for constituent inclusion.2 In the second step (filter 2), the eligible stocks are ranked by their quality & value (QV) composite z-scores and a targeted number of top-ranked stocks are selected. The QV Score is based on the average of two quality factors (return on equity and financial leverage ratio) and one value factor (earnings-to-price ratio).

As illustrated in Exhibit 2, the resulting constituents represent growth stocks with relatively higher quality and value characteristics. The selected constituents are weighted proportional to their growth exposure, subject to the maximum individual weight of 5% and sector weight of 40%. This approach seeks to provide purer growth exposure and limit concentration risk.

Performance Comparison

Historically, over the long term, the S&P GARP Indices outperformed their corresponding benchmarks in terms of both total and risk-adjusted return. The results show that the approach of selecting profitable growth stocks with reasonable valuations has yielded meaningful results over longer periods. In addition, both the S&P MidCap 400 GARP Index and the S&P SmallCap 600 GARP Index outperformed their corresponding benchmarks for all periods studied (see Exhibit 3).

Sector Composition

Exhibit 4 shows the historic sector exposure difference between the S&P GARP Indices versus their benchmarks. The S&P GARP Indices have had a noticeable overweight in Consumer Discretionary and an underweight in Financials, Consumer Staples, Utilities and Communication Services.

Factor Exposure

Exhibit 5 shows the factor characteristics as measured through the lens of Axioma Risk Model Factor Z-scores. The strategies had higher exposure to earnings and sales growth, profitability and earnings yield, while having lower leverage (lower exposure to leverage ratio).

Conclusion 

As the simulated performance shows, applying the S&P GARP Index methodology to the mid-cap and small-cap universes has resulted in outperformance over the long term. For market participants looking to gain exposure across the market cap range, the S&P MidCap 400 GARP Index and the S&P SmallCap 600 GARP Index are a welcome addition to the S&P GARP Index Series.


1 Hao, W. and Soe, A., Indexing GARP Strategies: A Practitioner’s Guide, S&P Dow Jones Indices, 2019.

2 The indices apply 20% selection buffer according to the following process: 1. Rank the top Growth z-score stocks by QV composite z-score. Select automatically the top 80% highest ranking stocks for index inclusion. 2. Select current constituents ranked within the top 120% by QV composite z-score for index inclusion in order of QV composite z-score until the target QV count is reached. 3. If, at this point, there are not enough constituents selected to meet the QV count, select non-constituents based on QV composite z-score ranking until the target count is reached.

The posts on this blog are opinions, not advice. Please read our Disclaimers.

How Does the S&P 500 ESG Index Work?

Look under the hood of the sustainability-focused version of the S&P 500 and discover how index design influences diversification and performance.

The posts on this blog are opinions, not advice. Please read our Disclaimers.