Get Indexology® Blog updates via email.

In This List

What’s in a U.S. Equity Index?

2023 Has Already Been Trepidatious

SPIVA Canada Scorecard 2022: Country, Currency and Concentration Contexts

2023 GICS Changes: S&P Global 1200 Impact Analysis

A Dynamic Approach to Volatility Management

What’s in a U.S. Equity Index?

Contributor Image
Sherifa Issifu

Senior Analyst, U.S. Equity Indices

S&P Dow Jones Indices

2022 was the worst year for U.S. equity indices since 2008’s Global Financial Crisis, with the S&P 500® entering a bear market and declining 18% in 2022. Despite the market blues, there were some relative winners: the S&P DJI U.S. Core Indices beat their MSCI counterparts last year, driven by differences in their methodologies. Below we examine the impact of index construction on performance, factor exposure and sector weights of the two index series.

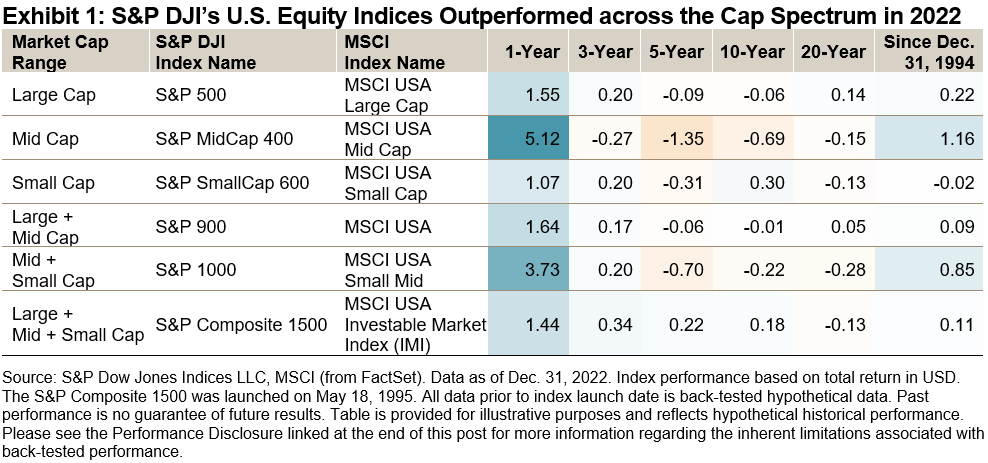
Exhibit 1 highlights that the S&P Composite 1500®’s outperformance was both consistent and widespread in 2022, with S&P DJI U.S. Core Indices outperforming MSCI ACWI USA Indexes across all market capitalization segments on average for three out of every four months in 2022. The outperformance ranged from 1% to 5%, with mid caps hosting the biggest performance differential—the S&P MidCap 400® beat the MSCI USA Mid Cap by 5%, its largest calendar year margin since 2016. Since Dec. 31, 1994, S&P DJI U.S. Core Indices beat MSCI ACWI Index in most cap-ranges.

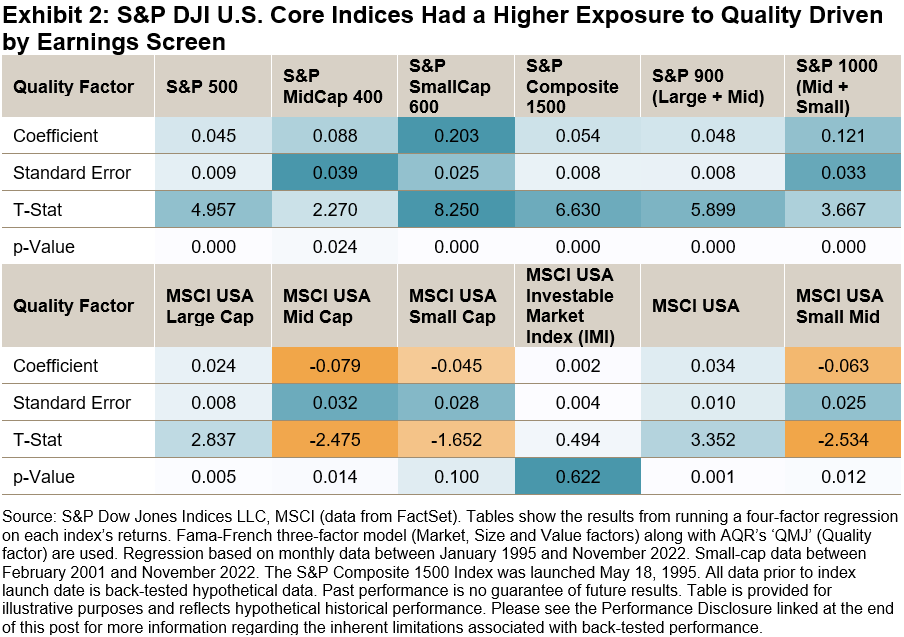
Differences in index construction have meant that S&P DJI indices have historically had a higher exposure to the quality factor than their MSCI counterparts. For example, the S&P Composite 1500 requires, among other criteria, potential new index additions to have four consecutive quarters of positive earnings to be considered for eligibility. The MSCI ACWI USA Indexes have no such requirements. This difference helps to explain why S&P DJI indices have a significant exposure to the quality factor, as shown in Exhibit 2.

Quality was a big differentiator in mid and small caps, with the widest spread between S&P DJI and MSCI quality scores in these size ranges. This difference is particularly acute in mid and small caps because firms are at an earlier stage in their lifecycle than large caps. It is typically harder for firms to reach the capitalization of “large caps” without being profitable. The S&P Composite 1500 filters out lower quality stocks which has given the S&P SmallCap 600 and S&P MidCap 400 a quality premium compared to the MSCI USA SmallCap and MSCI USA MidCap, respectively. A robust earning screen has helped S&P DJI U.S. Core Indices outperform when quality is in favor and “junk” falls out of favor.

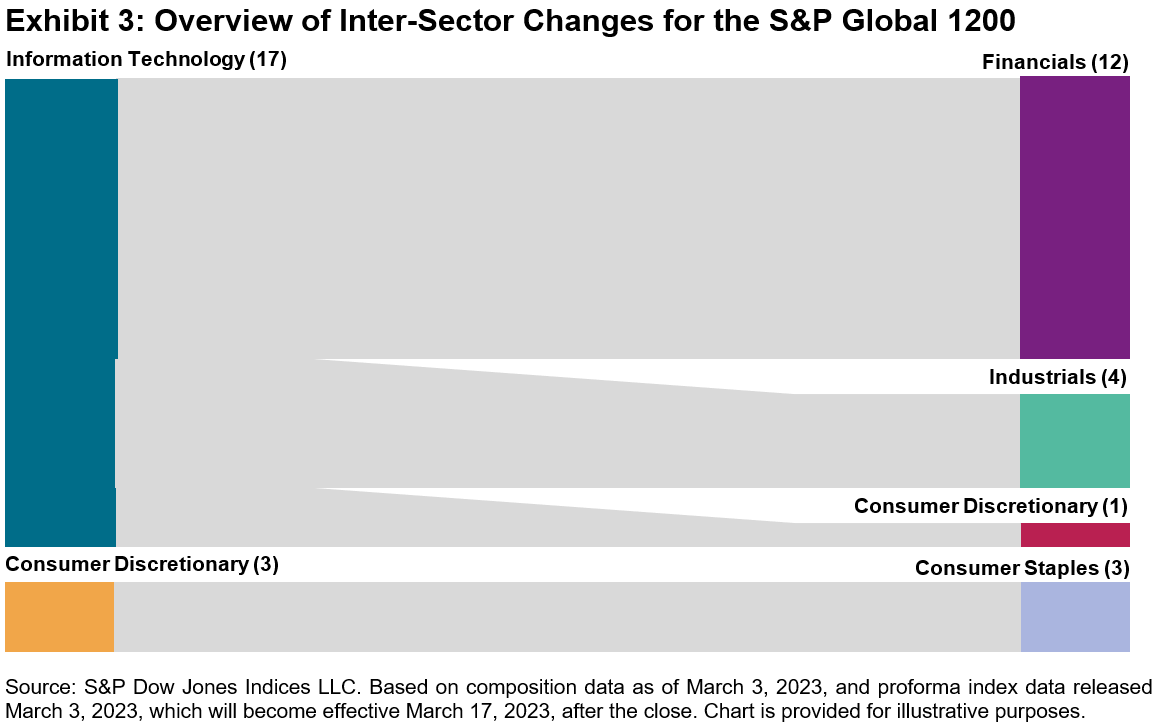
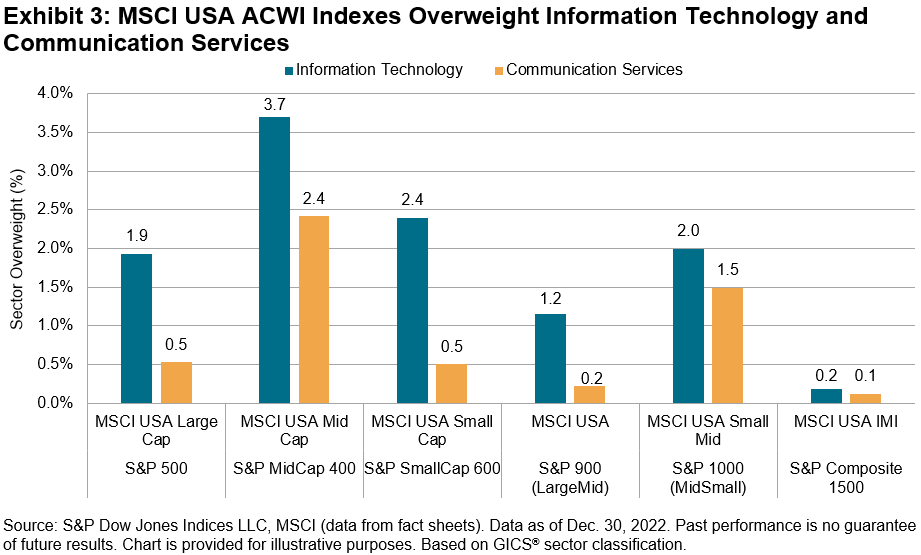
Sectors were also a major driver of performance in 2022, as the spread between best- and worst-performing sectors in the S&P 500 closed the year at 106%. The S&P 500 and S&P MidCap 400 both had a lower sector weight to Communication Services and Information Technology than their MSCI counterparts, explaining part of the recent outperformance given the material underperformance of technology-related sectors. The S&P 500 and MSCI USA Large Cap had a 26% and 28% weight to Information Technology, respectively. While I.T.’s mid-cap sector weight is about half of its large-cap weight, the spread in its weighting between benchmarks can vary more, with the MSCI USA Mid Cap having a 4% overweight versus the S&P MidCap 400, as shown in Exhibit 3.

While indices designed to measure the performance of U.S. equity market may look similar on the surface, especially in the short run, when you look more closely, differences in index construction can have a significant influence on performance, factor exposure and sector weights. It’s important to remember that it is often in the long run when quality shines through.

For more on index construction, visit https://www.indexologyblog.com/tag/index-construction/.

The posts on this blog are opinions, not advice. Please read our Disclaimers.

2023 Has Already Been Trepidatious

Contributor Image
Fei Mei Chan

Former Director, Core Product Management

S&P Dow Jones Indices

A sizzling start for Canadian equities in 2023 found itself fizzling as March began. Despite having a return of as much as 7% in late January/early February, through March 17, 2023, the S&P/TSX Composite Index was up 0.7% YTD. In line with historical trends, the S&P/TSX Composite Low Volatility Index underperformed, declining 0.1%.

Volatility rose for every sector of the S&P/TSX Composite Index except for Information Technology, which, nonetheless, remains the second most volatile sector, preceded only by Health Care.

The latest rebalance for the S&P/TSX Composite Low Volatility Index, effective after market close on March 17, 2023, wrought minor shifts. Notably, the Materials sector made a reappearance after more than a year’s absence, holding 2% of the low volatility index. Financials added to its already dominant position (up 3%), which came mostly from Real Estate. The remaining sectors all experienced minor shuffles.

The posts on this blog are opinions, not advice. Please read our Disclaimers.

SPIVA Canada Scorecard 2022: Country, Currency and Concentration Contexts

Contributor Image
Anu Ganti

U.S. Head of Index Investment Strategy

S&P Dow Jones Indices

Since 2004, our SPIVA® Canada Scorecards have shown that a majority of actively managed Canadian equity funds typically underperform the S&P/TSX Composite Index. However, according to the recently published SPIVA Canada Year-End 2022 Scorecard, the annual underperformance rate dropped to the best result we have seen since 2015: just 52% of Canadian Equity managers lagged the S&P/TSX Composite Index in 2022.  

We can gain a deeper understanding of the drivers behind these relatively better results by analyzing the market through a country, currency and concentration lens.

Exhibit 1 shows that, historically, fewer Canadian managers tended to underperform in years when U.S. equities outperformed the Canadian market; 2013 and 2015 are two prime examples, being the only two years in our database in which a majority of Canadian managers outperformed, and coinciding with significant U.S. outperformance relative to Canada.

Although the S&P 500 (CAD) underperformed the S&P/TSX 60 by 6% in 2022, the strengthening of the U.S. dollar versus the Canadian dollar last year may have provided an alternate tailwind for managers that did not hedge their foreign exposures. This is typically not the case, as U.S. equity underperformance typically coincided with U.S dollar weakness, of which 2022 was an outlier (see Exhibit 2).

Another potentially beneficial trend was weakness among large caps, most prominently of which was a sharp decline in the valuation of online retailer Shopify, the largest constituent of the S&P/TSX 60 as of Dec. 31, 2021,1 after a meteoric rise in the two years prior. Canadian managers who bypassed Shopify’s precipitous fall would have been well rewarded in relative terms, and there is evidence to suggest that many Canadian investors did exactly that in early 2022.

Concentration within large caps declined concurrently, as shown in Exhibit 3 via the Herfindahl-Hirschman Index (HHI) of the benchmark. History suggests that there is a relationship between concentration and the relative performance of equal weighting: after peaks in S&P 500 concentration, the S&P 500 Equal Weight Index tended outperform. As a result, it is not surprising that the S&P/TSX 60 Equal Weight Index outperformed the S&P/TSX 60 by 4% last year, perhaps implying greater potential success for large-cap managers whose holdings were more diversified.

A mixed set of headwinds and tailwinds may have led to a mixed set of results. While losses across asset classes in Canada and in the U.S. buffeted manager performance, a strengthening U.S. dollar along with the underperformance of mega caps could have provided a much-needed buffer, resulting in underperformance equivalent to a little more than a coin flip. While the country and currency themes outlined above are unique to Canada, the concentration context applies to active managers in the U.S. as well. Find out more about how active managers in the U.S. and across regions fared here.

1 As of Dec. 31, 2021, Shopify was the largest weight in the S&P/TSX 60, at 8%. Over the course of 2022, this stock had a total return of -73% and ended with a 2.5% weight in the S&P/TSX 60.

The posts on this blog are opinions, not advice. Please read our Disclaimers.

2023 GICS Changes: S&P Global 1200 Impact Analysis

Contributor Image
Hector Huitzil

Analyst, Global Equity Indices

S&P Dow Jones Indices

Revisions to the Global Industry Classification Standard (GICS®) structure are primed to go into effect after the close of business on Friday, March 17, 2023. While the changes are not as extensive as in previous iterations, they affect the GICS structure at all levels and this article examines the impact of the changes on the S&P Global 1200.

Exhibit 1 shows the expected updates at the sector level for each index included in the S&P Global 1200. Inter-sector changes refers to reclassification of constituents to a different sector under the new GICS structure, while changes within sector refers to firms being reclassified (i.e. sub-industry updates) within their current sector.

The S&P 500 is set to experience the greatest number of both inter-sector changes and changes within sector. More information can be found in the prior blog written by Fei Wang, 2023 GICS Changes: S&P 500 Impact Analysis.

Exhibits 2a and 2b examine modifications broken down at the sector level. Five out of the 11 GICS sectors will increase or decrease their constituent count, while four will experience intra-sector changes. Six sectors have been left untouched by the March 2023 GICS changes. The exhibit also incorporates any adds or drops stemming from index rebalancing that affect the overall sector compositions.

Inter-Sector Changes

The Information Technology (IT) sector will experience the largest decrease in constituents due to companies changing sector, while Financials will increase the most. Current IT sub-industry Data Processing & Outsourced Services will be discontinued, and current companies will either be re-classified to the new Transaction & Payment Processing Services sub-industry within the Financials sector or moved to the Industrials sector under a new Data Processing & Outsourced Services sub-industry.

The changes in the Consumer Discretionary sector are based on the nature of goods sold. Some retailers will be reclassified within the Consumer Staples sector. The discontinuation of the Internet & Direct Marketing retail, as well as the merger of the General Merchandise Stores and Department Stores into a new sub-industry called Broadline Retail, account for the majority of changes. Firms affected by these changes include Amazon, Alibaba and Prosus.

The Real Estate sector will be affected by an increased granularity of company classifications within Real Estate Investment Trusts (REITs). Retail properties, data centers, telecom towers and others will be reclassified at the sub-industry level.

Exhibit 3 analyzes the movement between sectors of the S&P Global 1200. On the left side are the current sectors of the impacted constituents, while the right side represent the destination following the GICS restructuring.

Breakdown of Changes by Country and Region

Exhibit 4 breaks down the changes by constituent index and country of domicile for the affected constituents, for both inter-sector and changes within sector.

Company-Level Changes

Visa and Mastercard represent the most significant inter-sector change, moving from Information Technology to Financials and entering as the third- and fourth-largest constituents in the sector by index market cap, respectively. Target leads the changes from the Consumer Discretionary sector, followed by Dollar General and Dollar Tree.

Exhibit 5 shows all companies affected by updates to sector definitions, along with their new assignments.


The posts on this blog are opinions, not advice. Please read our Disclaimers.

A Dynamic Approach to Volatility Management

How can indices seek to maintain a pre-defined level of implied volatility? Look inside the S&P 500 Futures Defined Volatility Indices, a dynamic, rules-based approach to volatility management helping market participants align investments with risk appetites systematically.

The posts on this blog are opinions, not advice. Please read our Disclaimers.