Get Indexology® Blog updates via email.

In This List

2023 Has Already Been Trepidatious

SPIVA Canada Scorecard 2022: Country, Currency and Concentration Contexts

2023 GICS Changes: S&P Global 1200 Impact Analysis

A Dynamic Approach to Volatility Management

GICS Changes Are upon Us

2023 Has Already Been Trepidatious

Contributor Image
Fei Mei Chan

Former Director, Core Product Management

S&P Dow Jones Indices

A sizzling start for Canadian equities in 2023 found itself fizzling as March began. Despite having a return of as much as 7% in late January/early February, through March 17, 2023, the S&P/TSX Composite Index was up 0.7% YTD. In line with historical trends, the S&P/TSX Composite Low Volatility Index underperformed, declining 0.1%.

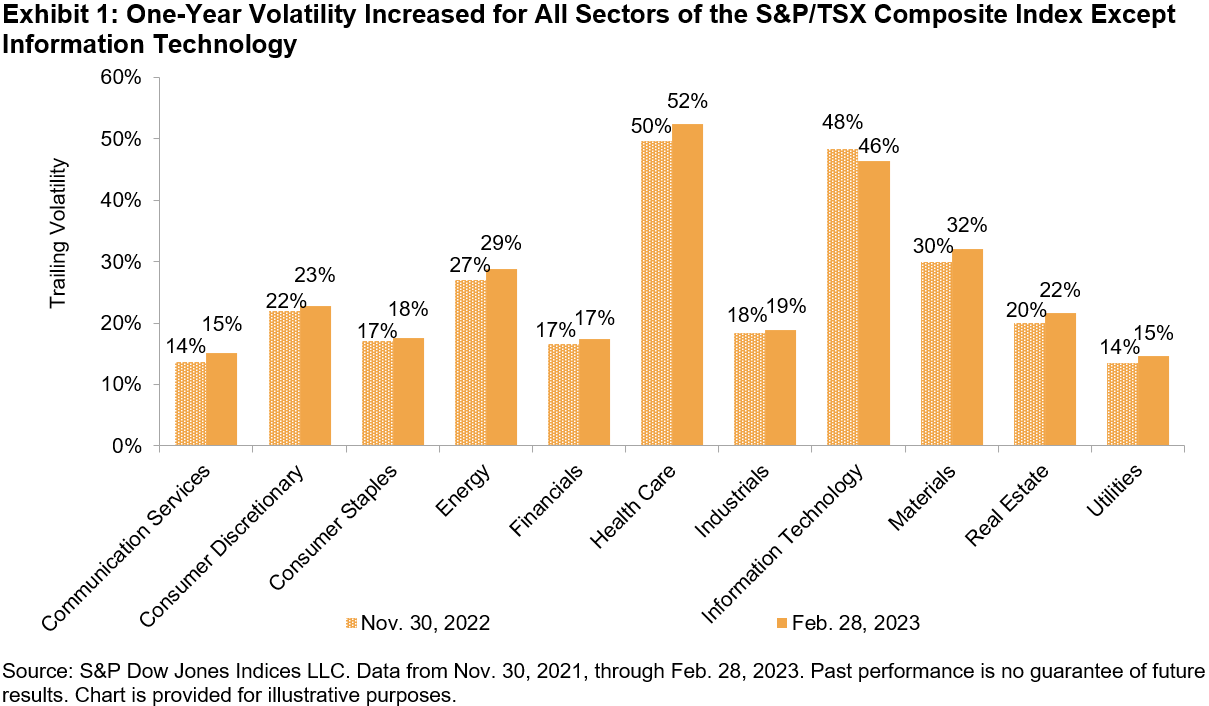
Volatility rose for every sector of the S&P/TSX Composite Index except for Information Technology, which, nonetheless, remains the second most volatile sector, preceded only by Health Care.

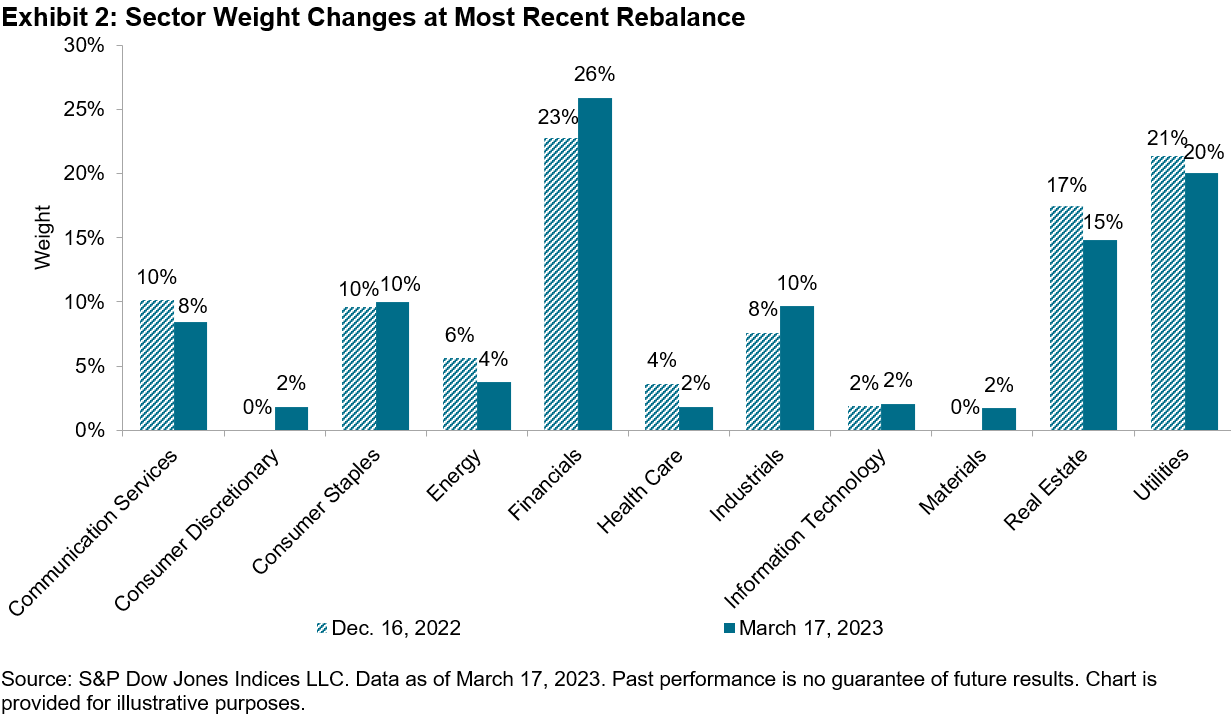
The latest rebalance for the S&P/TSX Composite Low Volatility Index, effective after market close on March 17, 2023, wrought minor shifts. Notably, the Materials sector made a reappearance after more than a year’s absence, holding 2% of the low volatility index. Financials added to its already dominant position (up 3%), which came mostly from Real Estate. The remaining sectors all experienced minor shuffles.

The posts on this blog are opinions, not advice. Please read our Disclaimers.

SPIVA Canada Scorecard 2022: Country, Currency and Concentration Contexts

Contributor Image
Anu Ganti

U.S. Head of Index Investment Strategy

S&P Dow Jones Indices

Since 2004, our SPIVA® Canada Scorecards have shown that a majority of actively managed Canadian equity funds typically underperform the S&P/TSX Composite Index. However, according to the recently published SPIVA Canada Year-End 2022 Scorecard, the annual underperformance rate dropped to the best result we have seen since 2015: just 52% of Canadian Equity managers lagged the S&P/TSX Composite Index in 2022.  

We can gain a deeper understanding of the drivers behind these relatively better results by analyzing the market through a country, currency and concentration lens.

Exhibit 1 shows that, historically, fewer Canadian managers tended to underperform in years when U.S. equities outperformed the Canadian market; 2013 and 2015 are two prime examples, being the only two years in our database in which a majority of Canadian managers outperformed, and coinciding with significant U.S. outperformance relative to Canada.

Although the S&P 500 (CAD) underperformed the S&P/TSX 60 by 6% in 2022, the strengthening of the U.S. dollar versus the Canadian dollar last year may have provided an alternate tailwind for managers that did not hedge their foreign exposures. This is typically not the case, as U.S. equity underperformance typically coincided with U.S dollar weakness, of which 2022 was an outlier (see Exhibit 2).

Another potentially beneficial trend was weakness among large caps, most prominently of which was a sharp decline in the valuation of online retailer Shopify, the largest constituent of the S&P/TSX 60 as of Dec. 31, 2021,1 after a meteoric rise in the two years prior. Canadian managers who bypassed Shopify’s precipitous fall would have been well rewarded in relative terms, and there is evidence to suggest that many Canadian investors did exactly that in early 2022.

Concentration within large caps declined concurrently, as shown in Exhibit 3 via the Herfindahl-Hirschman Index (HHI) of the benchmark. History suggests that there is a relationship between concentration and the relative performance of equal weighting: after peaks in S&P 500 concentration, the S&P 500 Equal Weight Index tended outperform. As a result, it is not surprising that the S&P/TSX 60 Equal Weight Index outperformed the S&P/TSX 60 by 4% last year, perhaps implying greater potential success for large-cap managers whose holdings were more diversified.

A mixed set of headwinds and tailwinds may have led to a mixed set of results. While losses across asset classes in Canada and in the U.S. buffeted manager performance, a strengthening U.S. dollar along with the underperformance of mega caps could have provided a much-needed buffer, resulting in underperformance equivalent to a little more than a coin flip. While the country and currency themes outlined above are unique to Canada, the concentration context applies to active managers in the U.S. as well. Find out more about how active managers in the U.S. and across regions fared here.

1 As of Dec. 31, 2021, Shopify was the largest weight in the S&P/TSX 60, at 8%. Over the course of 2022, this stock had a total return of -73% and ended with a 2.5% weight in the S&P/TSX 60.

The posts on this blog are opinions, not advice. Please read our Disclaimers.

2023 GICS Changes: S&P Global 1200 Impact Analysis

Contributor Image
Hector Huitzil

Analyst, Global Equity Indices

S&P Dow Jones Indices

Revisions to the Global Industry Classification Standard (GICS®) structure are primed to go into effect after the close of business on Friday, March 17, 2023. While the changes are not as extensive as in previous iterations, they affect the GICS structure at all levels and this article examines the impact of the changes on the S&P Global 1200.

Exhibit 1 shows the expected updates at the sector level for each index included in the S&P Global 1200. Inter-sector changes refers to reclassification of constituents to a different sector under the new GICS structure, while changes within sector refers to firms being reclassified (i.e. sub-industry updates) within their current sector.

The S&P 500 is set to experience the greatest number of both inter-sector changes and changes within sector. More information can be found in the prior blog written by Fei Wang, 2023 GICS Changes: S&P 500 Impact Analysis.

Exhibits 2a and 2b examine modifications broken down at the sector level. Five out of the 11 GICS sectors will increase or decrease their constituent count, while four will experience intra-sector changes. Six sectors have been left untouched by the March 2023 GICS changes. The exhibit also incorporates any adds or drops stemming from index rebalancing that affect the overall sector compositions.

Inter-Sector Changes

The Information Technology (IT) sector will experience the largest decrease in constituents due to companies changing sector, while Financials will increase the most. Current IT sub-industry Data Processing & Outsourced Services will be discontinued, and current companies will either be re-classified to the new Transaction & Payment Processing Services sub-industry within the Financials sector or moved to the Industrials sector under a new Data Processing & Outsourced Services sub-industry.

The changes in the Consumer Discretionary sector are based on the nature of goods sold. Some retailers will be reclassified within the Consumer Staples sector. The discontinuation of the Internet & Direct Marketing retail, as well as the merger of the General Merchandise Stores and Department Stores into a new sub-industry called Broadline Retail, account for the majority of changes. Firms affected by these changes include Amazon, Alibaba and Prosus.

The Real Estate sector will be affected by an increased granularity of company classifications within Real Estate Investment Trusts (REITs). Retail properties, data centers, telecom towers and others will be reclassified at the sub-industry level.

Exhibit 3 analyzes the movement between sectors of the S&P Global 1200. On the left side are the current sectors of the impacted constituents, while the right side represent the destination following the GICS restructuring.

Breakdown of Changes by Country and Region

Exhibit 4 breaks down the changes by constituent index and country of domicile for the affected constituents, for both inter-sector and changes within sector.

Company-Level Changes

Visa and Mastercard represent the most significant inter-sector change, moving from Information Technology to Financials and entering as the third- and fourth-largest constituents in the sector by index market cap, respectively. Target leads the changes from the Consumer Discretionary sector, followed by Dollar General and Dollar Tree.

Exhibit 5 shows all companies affected by updates to sector definitions, along with their new assignments.


The posts on this blog are opinions, not advice. Please read our Disclaimers.

A Dynamic Approach to Volatility Management

How can indices seek to maintain a pre-defined level of implied volatility? Look inside the S&P 500 Futures Defined Volatility Indices, a dynamic, rules-based approach to volatility management helping market participants align investments with risk appetites systematically.

The posts on this blog are opinions, not advice. Please read our Disclaimers.

GICS Changes Are upon Us

Contributor Image
Elizabeth Bebb

Director, Factor & Dividend Indices

S&P Dow Jones Indices

As time passes, we draw ever closer to the date of the GICS® changes scheduled to take effect after the market close on March 17, 2023. There are five changes being implemented, some of which will move companies among sectors and others that will move companies within sectors.

Recent blogs have announced these changes: GICS changes are approaching considered the adjustments occurring in 6 of the 11 sectors and the resulting weights. The biggest changes will be a reduction in the Information Technology (IT) sector weight (-3.2%), with the balance heading to Financials (2.7%) and Industrials (0.5%). It also identified the changes in industry groups, industries and sub-industries.

A second blog (2023 GICS Change: S&P 500® Impact Analysis) dug deeper into the impact on the S&P 500. It highlighted the names of the 14 companies moving across sectors, a result of reclassifying certain companies to better reflect their underlying business activities.

This third blog aims to dig deeper still; does the moving of companies across sectors lead to a difference in the geographic diversification of revenues within sectors? We know that all the companies within the S&P 500 index are domiciled in the U.S., but their revenues are global in nature (See Exhibit 1 for a breakdown).

Utilizing the new sector classifications and the geographical revenue distribution of companies (derived from FactSet), we construct the geographical sales-weighted effect of the GICS changes across sectors.

The majority of sectors are unchanged. Exhibit 2 shows the distribution of revenues by geography for those sectors that are undergoing change.

The largest change in geographic revenues occurs within the U.S. for all sectors. This is as expected, as 69% of revenues in the S&P 500 come from the U.S. We note that the re-categorization of Data Processing and Revenue Outsourcing companies away from the IT sector led to an approximately 4% proportional revenue loss from the sector’s U.S. geography.

It’s also interesting to note that although Consumer Staples only has a 0.5% increase in weight, the impact to revenue from the U.S. for the sector is much greater, at 2.4%. Relocating the highly U.S.-focused businesses of Target, Dollar Tree and Dollar General from Consumer Discretionary to Consumer Staples has driven the latter sector to see a greater weight to the U.S. Finally, we noted small changes to the China and Taiwan revenue footprints for IT. This was a result of the reduction in overall U.S. revenues and reflective of where some of the largest markets for the sector are found.

Not all sectors are created equally. Exhibit 3 shows the percentage of U.S. revenues for all eleven sectors. We highlighted in red the five sectors that are affected by the upcoming GICS changes.

From a geographic revenue standpoint, IT is the most diversified sector, with only 44% of revenues driven by the U.S. This percentage will be reduced further due to the removal of Data Processing and Outsourced Services companies, which will move to either Financials or Industrials. This same change will increase the concentration of Financials in the U.S. from 80.3% to 81.4%.

To further illustrate the geographical spread among revenues and the impact of the GICS changes, the graphs below show the distribution of the Financials and IT sectors. IT is the most diverse sector, c. 44% of revenues are derived from the U.S. with China, Japan and Taiwan heavily represented in the geographical revenue distribution. The Financials sector is highly concentrated in the U.S. with the U.K., the next largest country, only providing around 2% of revenues.

Analyzing geographic revenues provides us with a complementary way to understand the upcoming GICS changes. While some companies are changing sectors within the S&P 500, the distribution of geographic revenues is not changing dramatically. The possible diversification benefits of U.S. equities via the S&P 500 remain.

For more information, please refer to our GICS changes pages here.


The posts on this blog are opinions, not advice. Please read our Disclaimers.