Get Indexology® Blog updates via email.

In This List

International Women’s Day Embraces Equity

S&P U.S. Indices Year-End 2022: Analyzing Relative Returns to Russell

Commodities Could Not Escape the Sea of Red Seen Across Asset Classes in February

Collections of Factors

Momentum’s Mystique

International Women’s Day Embraces Equity

Contributor Image
Barbara Velado

Senior Analyst, Research & Design, Sustainability Indices

S&P Dow Jones Indices

March 8th marks International Women’s Day, an event that honors and celebrates women worldwide and that has been observed for over a century. This year’s theme is Embracing Equity, and it highlights the fundamental difference between equality and equity. While these words are often used interchangeably, the former means giving everyone equal opportunities, while the latter recognizes specific circumstances when allocating resources to achieve equal outcomes. But how close are companies to attaining true gender parity?

The Road to Gender Balance

Not only is there an ethical case for gender parity, but also an economic one: enhanced female representation in the workplace could add USD 12 trillion to global GDP.1 Studies show the added benefits of corporate gender diversity, from entry-level to senior positions, leading to productivity and innovation gains.2 Regulation proposals aimed at increasing gender balance are growing, with the EU adopting minimum targets for corporate boards.3 Despite the progress, the road to gender balance is a long one—the World Economic Forum (WEF) estimates that it will take 132 years to close the gender gap.4

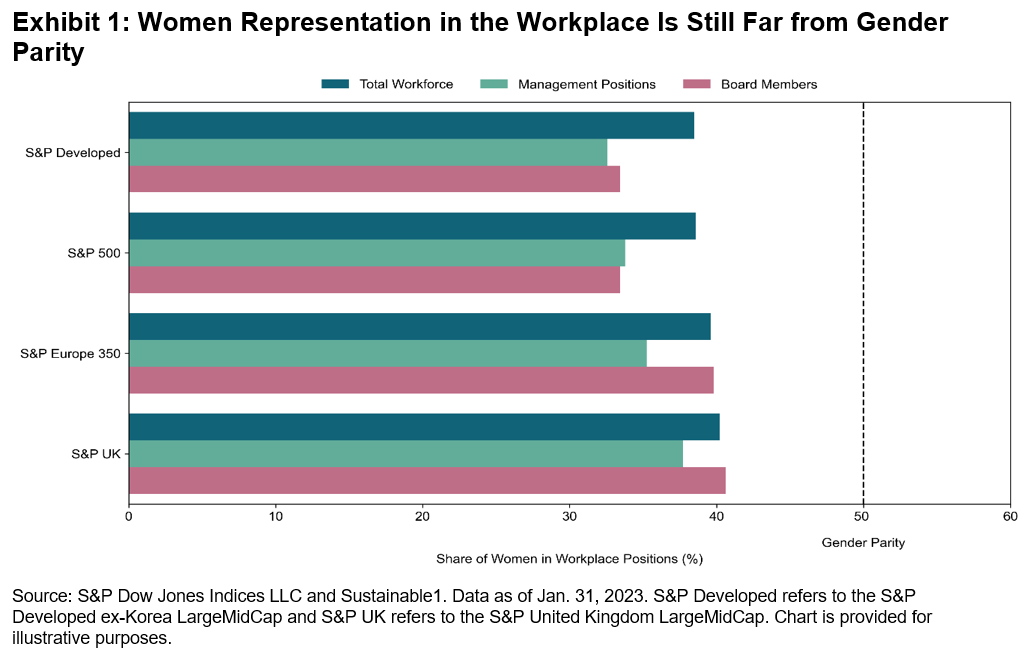
We explore the share of women in the workforce across regional indices, within management positions and at the board level, as well as the total number of women employed across all functions5 (see Exhibit 1). The U.K. is the only region where women cross the 40% threshold for board membership and across total workforce, with Europe and the U.S. closely following. Within the S&P 500®, women represent 39% of total workforce roles and close to 33% of board appointments.

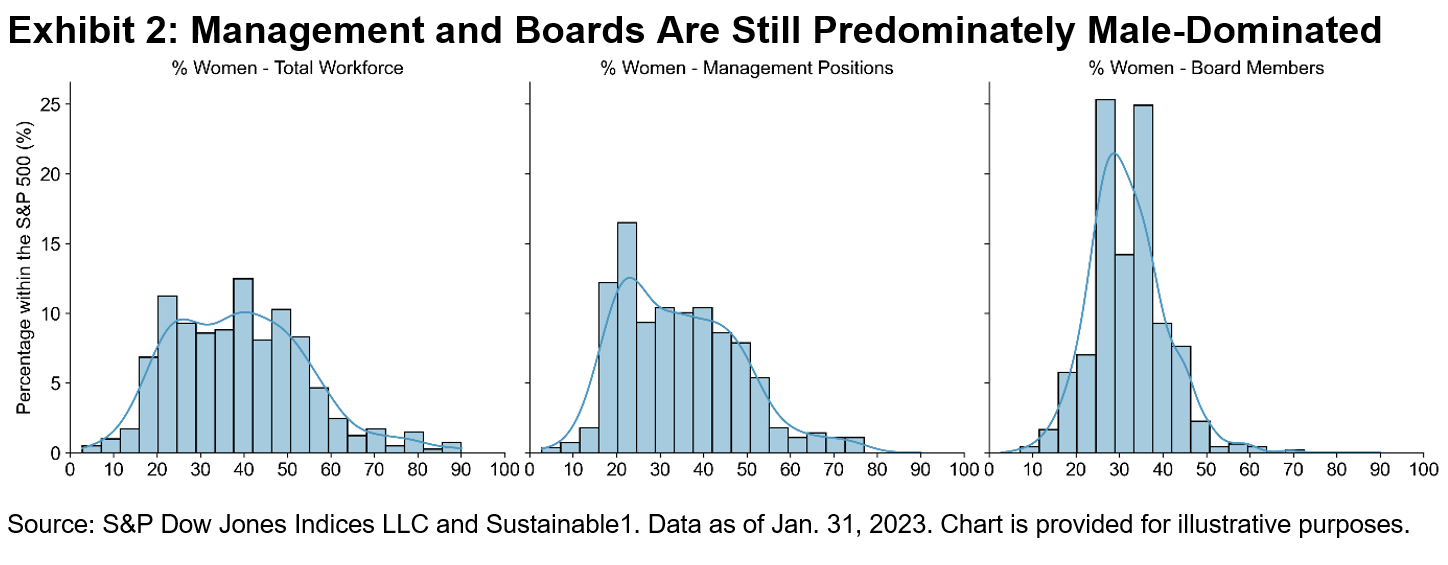
While weighted averages are helpful, they might not paint the full picture. We examine the distribution of female representation across three functions within the S&P 500. Management and board positions’ frequency distribution tends to be centered around lower percentages of women appointments (see Exhibit 2).

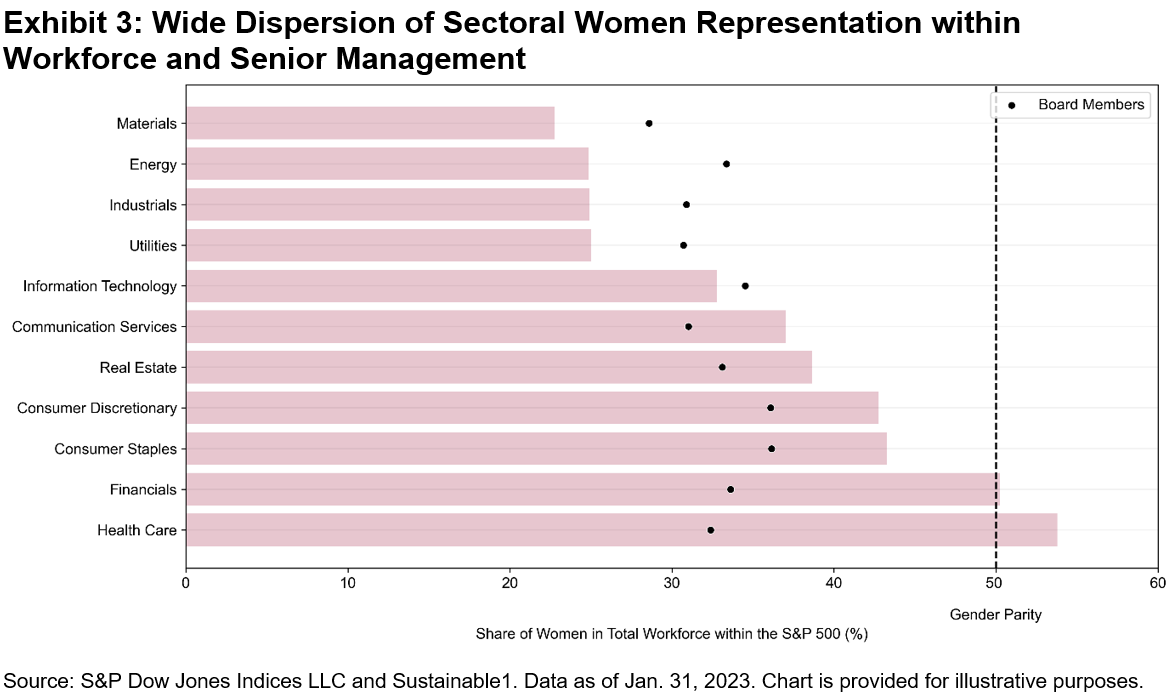
Looking at the S&P 500 from a sectoral perspective, Health Care and Financials lead the charts, with women representing at least 50% of total workforce, having reached gender parity (see Exhibit 3). Conversely, Materials and Energy are the least gender-diverse sectors. It is worth noting the sectoral dispersion between total workforce and boards’ women composition. The difference between most and least diverse sectors for board membership is 7.6%, while for total workforce is 31%.

Retaining Women Talent

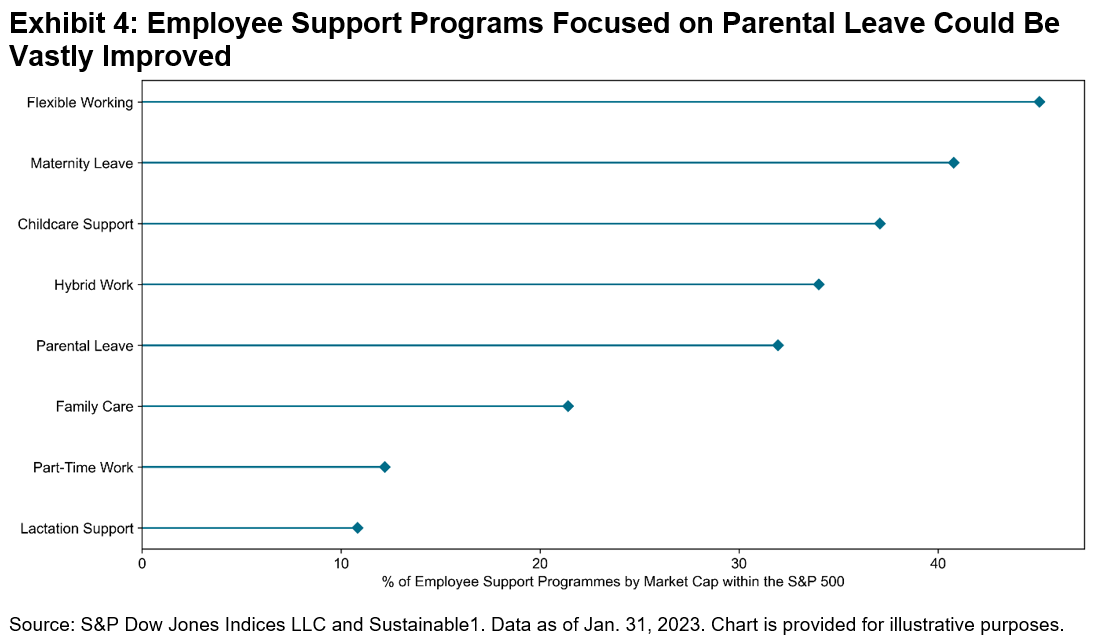
Not only are women still underrepresented across most corporate ladder levels, they are also leaving companies at an alarming rate relative to their male counterparts.6 Talent retention is increasingly important for women’s career advancement. Employee support programs, such as paid parental leave, flexible working and hybrid arrangements, can be highly beneficial. More than 45% of companies within the S&P 500 adopt flexible working and 40% have paid maternity leave (more than legally required), but only 32% offer paid non-primary parental leave (see Exhibit 4).

Going beyond equal opportunities and creating equal outcomes requires recognizing heterogeneity of women’s characteristics and circumstances, in order to remove systemic barriers that hinder long-term success. Data from the S&P Global Corporate Sustainability Assessment (CSA)7 suggests that workplace gender gaps persist across regions, sectors and managerial positions. There is more to do to bring and retain women in the workplace and empower them to attain their full potential. The benefits of doing so are vast and contribute to the UN’s Sustainable Development Goals’ agenda on Gender Equality.

1 McKinsey Global Institute gender report.

2  Harvard Business Review Research 2019.

3 European Commission announcement.

4  WEF Global Gender Gap Report 2022.

5  Management positions span junior, middle and senior management roles. Datapoints included in analysis have at least 80% coverage by weight.

6 Women in the Workplace Report 2022 within corporate America

7 More information on CSA here.

The posts on this blog are opinions, not advice. Please read our Disclaimers.

S&P U.S. Indices Year-End 2022: Analyzing Relative Returns to Russell

Contributor Image
Fei Wang

Senior Analyst, U.S. Equity Indices

S&P Dow Jones Indices

2022 was a challenging year across asset classes, including equities. Exhibit 1 shows that there were declines across the U.S. equities market cap spectrum. For example, the S&P 500® fell 18% for the whole year; the gains in the fourth quarter were not sufficient to overcome the declines during the first three quarters.

Amid the turbulent environment, S&P DJI’s U.S. equity indices fared well relative to their Russell counterparts, generally outperforming in most months over the past year. For instance, the S&P 500 outperformed the Russell Top 200 by 1.7% in 2022, its largest margin since 2011. The S&P SmallCap 600® outperformed the Russell 2000 by 4.3%, far above its average annual outperformance since 1995 (1.7%), and the S&P 900 and S&P Composite 1500® outperformed their Russell counterparts by 1.3% and 1.4%, respectively, both the third-highest margins since 1996.

Information Technology exposure was a key reason for the outperformance of S&P DJI’s indices last year. Exhibit 3 shows that the choice of Information Technology companies (selection effect) accounted for over 80% of the overall S&P SmallCap 600 outperformance against the Russell 2000. Other major S&P DJI’s indices tell a similar story: S&P DJI’s U.S. equity indices benefited from less exposure to, and better selection in, the Information Technology sector in 2022.

The outperformance from S&P U.S. Core Indices helped S&P Style Indices’ relative returns (see Exhibit 4). Most notably, the S&P MidCap 400 Growth outperformed Russell MidCap Growth by 7.8%, the largest margin since 2003. The S&P MidCap 400 Value outperformed Russell MidCap Value by 5.1%, the third-highest margin since 1996.

More broadly, Exhibit 5 shows how the frequency of outperformance by the S&P Style Indices generally increased with the frequency of outperformance by the S&P Core Indices. The frequency of outperformance is based on annual total returns of the S&P DJI indices and their Russell counterparts since 1996. The blue bars represent benchmark indices, while the other two colors represent S&P DJI’s outperformance conditional on the benchmark outperformance of respective style indices. For example, the S&P MidCap 400 outperformed the Russell MidCap index in 51.9% of years between 1996 and 2022. And in years when the S&P MidCap 400 outperformed, the S&P MidCap 400 Growth always outperformed the Russell MidCap Growth.

The past year was an extremely challenging time for the U.S. equity market, but the S&P Core and Style Indices generally outperformed their Russell counterparts. Once again, such differences in return highlight the potential impact of differences in index construction and how different index characteristics can impact relative returns.

The posts on this blog are opinions, not advice. Please read our Disclaimers.

Commodities Could Not Escape the Sea of Red Seen Across Asset Classes in February

Contributor Image
Jim Wiederhold

Former Director, Commodities and Real Assets

S&P Dow Jones Indices

The S&P GSCI, the world’s leading commodities benchmark, could not escape the volatile markets experienced in February, as the index fell 3.83% for the month. Despite recent declines, inflation remained high, which kept the U.S. Fed steadfast in its rate-hiking campaign, and expectations for a possible easing by year-end 2023 were squashed in the latest Fed commentary. A strong retracement higher of the U.S. dollar from the weakness seen in January put pressure on all major commodities, which are priced in U.S. dollars globally.

Within the petroleum complex, S&P GSCI Heating Oil took the biggest hit, down 9.33% after a flat January. Warmer-than-expected weather in the U.S. played a role in decreasing demand for the crude oil byproduct. Crude oil supply was ample, with no change in OPEC’s production announced and record volumes of crude exports to China and India from Russia’s Pacific terminals. Russian crude exports to northern European countries ceased after EU sanctions took effect on Feb. 5.

The S&P GSCI Industrial Metals fell 7.82% in February with broad weakness across all metals. Despite China’s easing of COVID-19 restrictions, demand from the world’s leading importer of industrial metals has not recovered yet. China’s latest forward-looking Manufacturing PMI reading showed the fastest growth in a decade, however. The S&P GSCI Nickel fell the most among the industrial metals, down 18.27%. The International Nickel Study Group announced that in 2022, the global nickel market flipped from a deficit to a surplus for one of the key metallic inputs to electric vehicles. The London Metal Exchange’s nickel contract is still in question after last year’s spike in prices, leading other exchanges like the CME to announce in February that they would launch an alternative nickel contract by the end of March.

The S&P GSCI Gold gave back all of its gains from January, ending February with a flat YTD performance. The S&P GSCI Silver fell 12.06% in sympathy with gold. Silver prices tend to be much more volatile than gold, to the downside as well as the upside. The pressure from the industrial metals space was also felt with silver’s global demand making up about 50% of its use.

Within agriculture, S&P GSCI Wheat prices fell the most, down 8.20% YTD. According to S&P Global Commodities Insights, global wheat prices are expected to see further declines due to the likely rise in supplies across producer countries such as Australia, Canada and Russia. After a year of tightened supplies from the start of the Russia-Ukraine conflict, supplies are likely to normalize.

The S&P GSCI Livestock rose 1.29% and was the only sector to end the month in positive territory, with feeder cattle and live cattle leading the way. Cattle prices have risen steadily since their low in May 2022 due to a progressively smaller global herd and global demand remaining strong.

The posts on this blog are opinions, not advice. Please read our Disclaimers.

Collections of Factors

Contributor Image
Craig Lazzara

Former Managing Director, Index Investment Strategy

S&P Dow Jones Indices

Traditional investors think of portfolios (whether active or indexed) as collections of stocks. We can equally well think of portfolios as collections of factors—defining factor in the academic sense, as an attribute with which excess returns are thought to be associated. If we’re correct in assessing these attributes, it should be possible to explain portfolio performance by reference, not to the stocks that the portfolio owns, but rather to the factors that it embodies.

One way to illustrate this is with reference to factor indices.  It’s obvious, e.g., that a well-constructed value index is tilted toward cheap stocks (i.e., toward the value factor), but it’s equally true, if less obvious, that a value index might have other tilts as well—for example, toward smaller companies, or higher yields, or lower quality. If this is true, then the performance of factor indices might be explained, in part, by reference to multiple factor exposures.

We’ve noted before that one of the most salient features of 2022 factor index performance was the reversal of several multi-year trends. Equal weight beat cap weight, Low Volatility beat High Beta, and most strikingly, Value outperformed Growth. The Value–Growth differential was so large, in fact, that it explained nearly 80% of the variance in returns across other factor indices, as Exhibit 1 illustrates.

Exhibit 1, though interesting, relies on data from only 17 factor indices. Some stocks will be represented in several of these indices, while others might not be included in any. What happens if we ask how factor exposure affected performance at the individual stock level?

We can approach this question by ordering the constituents of the S&P 500 by the factors of interest, grouping into quintiles, and then measuring returns by quintile. The difference between top and bottom quintiles (i.e., between the average return of the stocks most exposed to the factor and the average return of those least exposed) gives us a convenient way to summarize each factor’s influence. Exhibit 2 shows results for 2022.

Yield was the year’s strongest factor by far, as the market’s highest dividend payers beat non-payers by nearly 29%. Value was in second place, with defensive stalwarts Quality and Low Volatility filling out the top four places. The difference between the performances of Value and Growth is quite consistent with the observations we made in Exhibit 1.

Other things equal, as granularity increases, the importance of factors declines. An individual stock will be more heavily influenced by idiosyncratic factors than will be a diversified portfolio. Even at the stock level, however, understanding factor exposures can produce useful performance insights.

The posts on this blog are opinions, not advice. Please read our Disclaimers.

Momentum’s Mystique

Contributor Image
Joseph Nelesen

Head of Specialists, Index Investment Strategy

S&P Dow Jones Indices

I confess some superhero powers underwhelm me (really, Hawkeye, arrows?) or stretch credulity further than Hulk’s hyper-elastic jeans. However, one I can appreciate is Mystique, the shape-shifting mutant who constantly alters her appearance to stay one step ahead.

If factors were superheroes, I’d argue the S&P 500® Momentum Index (“Momentum”) and Mystique share commonalities, both misunderstood and powerful through constantly morphing into something new. As a reminder, the momentum factor refers to the tendency of outperforming stocks to continue outperforming in the near term.

Thirty years after the publication of perhaps the most cited paper on momentum, researchers continue exploring why it works. To some, the momentum premium is simply compensation for risk, while others attribute it to human behavioral biases such as loss-aversion or self-attribution. In other words, markets are made up of people who don’t always act rationally, and many don’t understand momentum. Let’s bust three common misperceptions about momentum using data from the S&P 500 Momentum Index (Mystique-blue in the charts below, naturally).

Myth 1: Momentum Is Just Risky or High Beta Stocks

While the S&P 500 High Beta Index (“High Beta”) selects the 100 highest beta stocks from the S&P 500, Momentum selects constituents with top-quintile risk-adjusted price return momentum scores. Resulting differences between High Beta and Momentum indices have historically led to only a 2% overlap and a -0.54 relative return three-year correlation. Performance also underscores the uniqueness of each factor. Just during January 2023, the performance of High Beta and Momentum differed by 17%—their fourth-highest spread since 2010.

Looking over a longer time horizon, data show an often inverse relationship between excess returns for High Beta and Momentum (see Exhibit 1).

Longer-term performance also highlights the differences (see Exhibit 2).

A keen eye finds that Momentum outperformed on a relative basis for the 2022 calendar year, perhaps busting the second part of Myth #1 that the factor is inherently higher risk. In reality, the S&P 500 Momentum Index selects stocks that rank highly on risk-adjusted performance, leading to an index with annualized risk that has historically been similar to or below that of the S&P 500 (see Exhibit 3).

If momentum indices can actually be constructed with similar or less volatility than the broader market, then we can begin addressing the second myth.

Myth 2: Momentum Only Works in Bull Markets

When the S&P 500 declined 18.1% in 2022, the S&P 500 Momentum Index outperformed, falling 10.5%. Curious about Momentum’s resilience, we examined its average excess performance during one-month periods when the S&P 500 was rising or falling. As seen in Exhibit 4, Momentum outperformed in both on average.

Clearly for momentum to work in different conditions, it must transform as the factor itself moves across different parts of the market. The most market-based among factors, Momentum has a historically high turnover, which leads to our final myth. 

Myth 3: The Momentum Factor Can’t Be Indexed.

Put differently, can indices continue to harness a factor like momentum through time? Affirmation comes from the fact that many “passive” indices (such as factors) are quite dynamic in how they rebalance.

Momentum “shapeshifts,” dramatically changing security and sector weights at rebalances to maintain high exposure to the targeted factor (see Exhibit 5).

Like Mystique taking on different forms, the S&P 500 Momentum Index is always changing by design, evolving in response to market conditions and maintaining a high exposure to the factor along the way.


The posts on this blog are opinions, not advice. Please read our Disclaimers.