Get Indexology® Blog updates via email.

In This List

Momentum’s Mystique

Introducing the First Benchmark Commodity Index Incorporating Environmental Metrics, the S&P GSCI Climate Aware

S&P GSCI Shipping Indices in Portfolio Management

China Equities Diverge from Developed and Emerging Markets

Income Generation and the S&P/ASX BuyWrite Index

Momentum’s Mystique

Contributor Image
Joseph Nelesen

Head of Specialists, Index Investment Strategy

S&P Dow Jones Indices

I confess some superhero powers underwhelm me (really, Hawkeye, arrows?) or stretch credulity further than Hulk’s hyper-elastic jeans. However, one I can appreciate is Mystique, the shape-shifting mutant who constantly alters her appearance to stay one step ahead.

If factors were superheroes, I’d argue the S&P 500® Momentum Index (“Momentum”) and Mystique share commonalities, both misunderstood and powerful through constantly morphing into something new. As a reminder, the momentum factor refers to the tendency of outperforming stocks to continue outperforming in the near term.

Thirty years after the publication of perhaps the most cited paper on momentum, researchers continue exploring why it works. To some, the momentum premium is simply compensation for risk, while others attribute it to human behavioral biases such as loss-aversion or self-attribution. In other words, markets are made up of people who don’t always act rationally, and many don’t understand momentum. Let’s bust three common misperceptions about momentum using data from the S&P 500 Momentum Index (Mystique-blue in the charts below, naturally).

Myth 1: Momentum Is Just Risky or High Beta Stocks

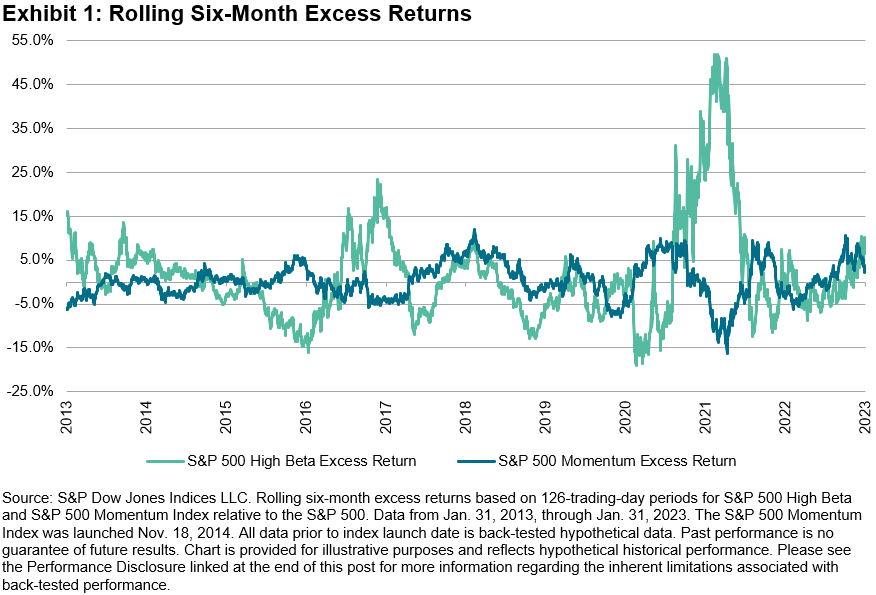
While the S&P 500 High Beta Index (“High Beta”) selects the 100 highest beta stocks from the S&P 500, Momentum selects constituents with top-quintile risk-adjusted price return momentum scores. Resulting differences between High Beta and Momentum indices have historically led to only a 2% overlap and a -0.54 relative return three-year correlation. Performance also underscores the uniqueness of each factor. Just during January 2023, the performance of High Beta and Momentum differed by 17%—their fourth-highest spread since 2010.

Looking over a longer time horizon, data show an often inverse relationship between excess returns for High Beta and Momentum (see Exhibit 1).

Longer-term performance also highlights the differences (see Exhibit 2).

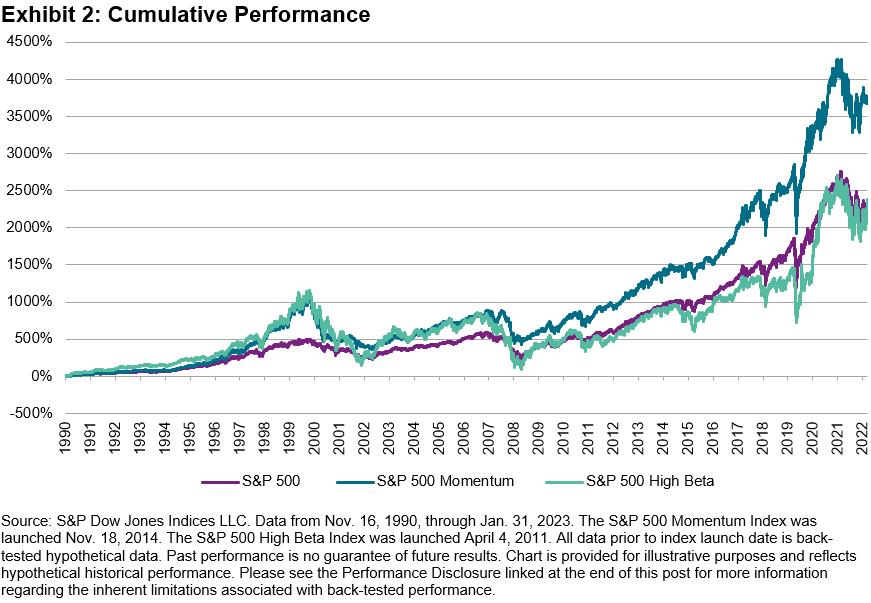
A keen eye finds that Momentum outperformed on a relative basis for the 2022 calendar year, perhaps busting the second part of Myth #1 that the factor is inherently higher risk. In reality, the S&P 500 Momentum Index selects stocks that rank highly on risk-adjusted performance, leading to an index with annualized risk that has historically been similar to or below that of the S&P 500 (see Exhibit 3).

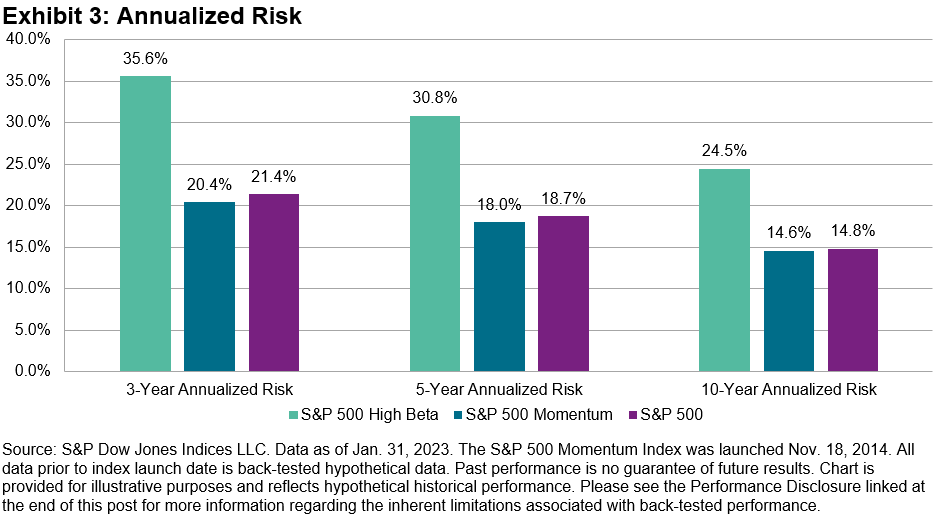
If momentum indices can actually be constructed with similar or less volatility than the broader market, then we can begin addressing the second myth.

Myth 2: Momentum Only Works in Bull Markets

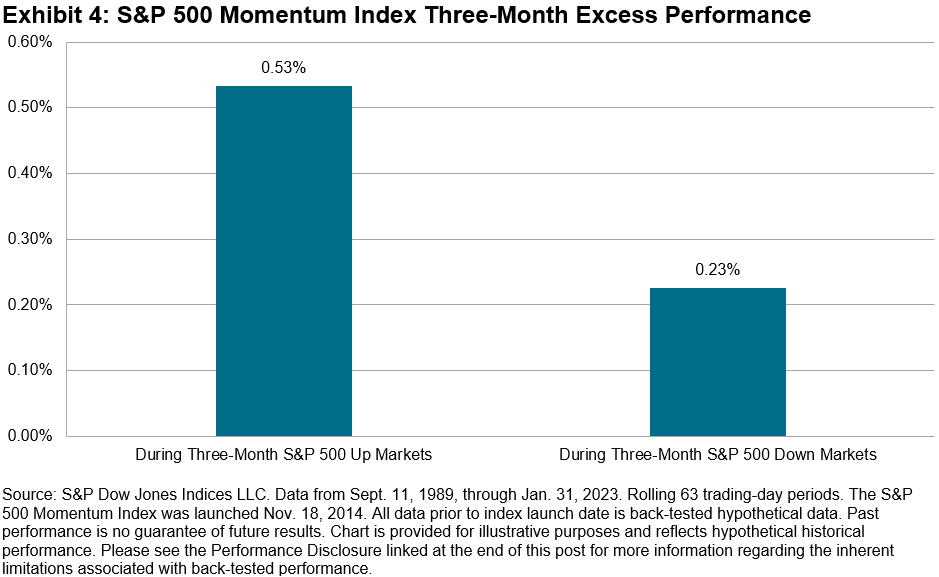
When the S&P 500 declined 18.1% in 2022, the S&P 500 Momentum Index outperformed, falling 10.5%. Curious about Momentum’s resilience, we examined its average excess performance during one-month periods when the S&P 500 was rising or falling. As seen in Exhibit 4, Momentum outperformed in both on average.

Clearly for momentum to work in different conditions, it must transform as the factor itself moves across different parts of the market. The most market-based among factors, Momentum has a historically high turnover, which leads to our final myth. 

Myth 3: The Momentum Factor Can’t Be Indexed.

Put differently, can indices continue to harness a factor like momentum through time? Affirmation comes from the fact that many “passive” indices (such as factors) are quite dynamic in how they rebalance.

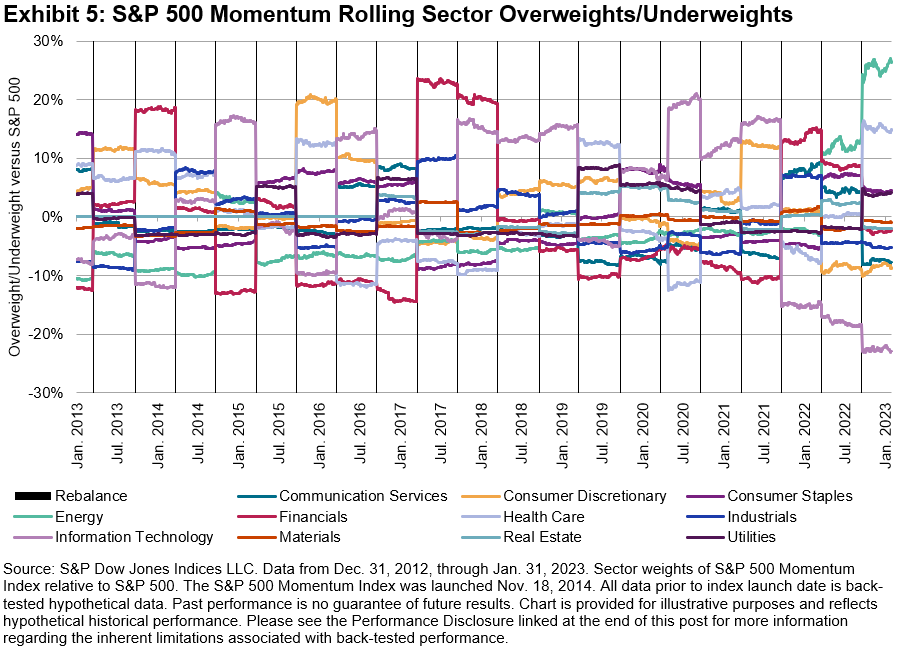
Momentum “shapeshifts,” dramatically changing security and sector weights at rebalances to maintain high exposure to the targeted factor (see Exhibit 5).

Like Mystique taking on different forms, the S&P 500 Momentum Index is always changing by design, evolving in response to market conditions and maintaining a high exposure to the factor along the way.


The posts on this blog are opinions, not advice. Please read our Disclaimers.

Introducing the First Benchmark Commodity Index Incorporating Environmental Metrics, the S&P GSCI Climate Aware

Contributor Image
Fiona Boal

Managing Director, Global Head of Equities

S&P Dow Jones Indices

As the world continues to focus on sustainability and the energy transition, it is understandable that market participants are seeking to incorporate sustainability considerations into their commodities portfolios. To that end, on Feb. 23, 2023, S&P Dow Jones Indices (S&P DJI) launched the S&P GSCI Climate Aware, utilizing a new environmental dataset developed in collaboration with S&P Global Sustainable 1. It is the first broad-based commodity index in the market to incorporate environmental metrics.

The S&P GSCI Climate Aware measures performance through futures of a long-only climate-aligned and climate-transition strategy across the constituents of the S&P GSCI. The index follows a portfolio optimization approach to compute constituent weights by seeking to reduce the environmental footprint of the index, while minimizing weight and sector deviations from the S&P GSCI. The optimized constituent weights are constrained to help maintain diversification, investability and liquidity for the index. The index seeks to achieve a 25% reduction in total environmental impact per dollar invested compared with the S&P GSCI, along with a 5% year-over-year decarbonization target, while maintaining total food production and ensuring land and water environmental impact per dollar invested are no higher than the S&P GSCI. Exhibit 1 provides back-tested performance and summary statistics for the index compared with the benchmark.

As environmental considerations come under the scope, market participants have expressed interest in maintaining diversified exposure to an inflation-sensitive asset in line with the benchmark S&P GSCI, while shifting allocations between commodities that may be substitutes, reflecting as closely as possible behaviors in the physical market that may be central to the transition. As such, the index redefines new commodity “sectors” to reflect the changing dynamics of the global economy, dividing the constituents into three economic sectors based on their impact on the environmental transition and currently available substitutions within each category: energy systems, food supply and other. As anticipated, the new index reallocates weights away from high-intensity fossil fuels to those metals important to the energy transition (see Exhibit 2).

The index utilizes a new set of environmental data—the S&P Global Commodity Environmental dataset—which provides physical and financial impact data on greenhouse gas emissions, water consumption and land use at the commodity level, based on life cycle impact assessment factors and natural capital valuation metrics. More information on the dataset can be found here.

S&P DJI continues to be the leader when it comes to bringing innovative, sustainability-focused index offerings to the market. The S&P GSCI Climate Aware is another example of how we look to drive transparency and incorporate sustainability criteria into our benchmark indices. To learn more, please visit the index webpage, or read about incorporating environmental considerations into commodities indices in our research paper published in February 2023.

The posts on this blog are opinions, not advice. Please read our Disclaimers.

S&P GSCI Shipping Indices in Portfolio Management

Contributor Image
Nikos Nomikos

Professor of Shipping Finance

Bayes Business School

On Aug. 1, 2022, S&P Dow Jones Indices (S&P DJI) launched a series of S&P GSCI Freight Indices, the first investible shipping indices of their kind in the market and an expansion of the single-commodity offering of indices based on the S&P GSCI. Refer to this blog for background on the indices.

Freight rates have historically enjoyed higher average returns and are more volatile compared to equity, fixed income and other commodities (Exhibit 1). Interestingly, Panamax freight rates are more volatile than the prices of the commodities they typically transport (mostly agricultural commodities and industrial metals). Monthly and quarterly freight rates have similar statistical properties, reflecting the common fundamentals that drive the market and each sector. At the same time, the front end of the futures curve is more volatile and is driven by short-term factors, including repositioning booms and regional supply-demand imbalances, while long-term rates are less sensitive to those events and thus less volatile.

Cumulative returns suggest that Panamax and Capesize freight rates have historically outperformed other commodity indices as well as other asset classes, on the back of a very strong and buoyant freight market in 2020 and 2021 (Exhibit 1).

As global investors increasingly seek to diversify their investments and look for alternative vehicles to tap into niche market segments, the S&P GSCI Freight index series may be a meaningful gauge of global economic activity, seaborne trade and individual commodity, and geographic market dynamics.

Freight rates reflect the balance between supply and demand. Although strong demand for commodities and subsequently high commodity prices may trigger stronger demand for shipping services, the supply of shipping services moves independently. As a result, freight rates can fall in an environment of expanding commodities demand, if the supply of vessels grows faster than the demand for shipping services. Equally, freight rates may increase in an environment of low commodity demand. For those reasons, the correlation between freight rates and other commodities is historically weak.

This is suggestive of freight rates contributing to the diversification properties of a typical portfolio consisting of commodities and stocks and this is confirmed visually by looking at the shape of the efficient frontier and the position of the Panamax and Capesize base assets, especially the quarterly ones (Exhibit 3).

Global shipping is a unique asset class. In this blog, we demonstrated the low correlation between freight rates and other commodities and the potential benefits of including freight in a diversified portfolio. The introduction of the S&P GSCI Freight Indices offers the opportunity to investors to access this unique asset class and be able to include products tracking these indices in their portfolios.

The posts on this blog are opinions, not advice. Please read our Disclaimers.

China Equities Diverge from Developed and Emerging Markets

Contributor Image
Sean Freer

Director, Global Equity Indices

S&P Dow Jones Indices

China, the world’s second-largest market by both GDP and stock market capitalization, is showing itself to be a worthy diversifier, with low correlations to other equity markets.

While many developed and emerging stock market indices have traded more in sync since the onset of the COVID-19 pandemic, China has performed differently, with both domestic China A-shares and offshore-listed China equities decoupling in comparison to developed and emerging markets.

The current market environment of China easing COVID-19 restrictions, while the world grapples with higher inflation and rising rates, has resulted in further variance in equity market returns. As of Jan. 31, 2023, China equities—as measured by the S&P China Broad Market Index (BMI)—posted a 42% relative return to the S&P 500® over a three-month period. This is the highest such variance in over 20 years.

The variance of return is reflected in the correlation coefficient of monthly returns, which on a three-year basis has also reached long-term lows for China equities versus the S&P 500 and the S&P Emerging Ex-China BMI.

China and Emerging Market Equities May Offer Risk Reduction Efficiencies

Correlation analysis is used by professional investors to help build efficient portfolios. When looking back, over the past three years China equities had a correlation coefficient of under 0.3 compared to the S&P 500 and S&P Developed BMI. Based on this, it’s possible that investors with a large portion of their portfolio in U.S. or developed market equities could have reduced volatility by adding exposure to China equities.

For Exhibit 3, we made several hypothetical portfolios mixing the S&P China BMI, S&P 500, S&P Emerging BMI and S&P Developed BMI. One may think adding more volatile assets such as China or emerging market equities to a developed or U.S. equity portfolio would increase risk. However, given the low correlations, the optimal portfolio mix may actually reduce risk. Interestingly, China’s large and low correlated weight of 35.5% in the S&P Emerging BMI has resulted in the index having lower volatility than the S&P Developed BMI over the past three-years, meaning a higher weight to the S&P Emerging BMI in the optimal portfolio (see Exhibit 3b).

Beyond the S&P China BMI, S&P Dow Jones Indices offers a series of China equity benchmarks reflecting a number of segments and styles covering both A-shares and offshore listings.

For more information see https://www.spglobal.com/spdji/en/landing/investment-themes/china/.

The posts on this blog are opinions, not advice. Please read our Disclaimers.

Income Generation and the S&P/ASX BuyWrite Index

Contributor Image
Maxime Fouilleron

Analyst, Multi-Asset Indices

S&P Dow Jones Indices

In my last blog, we discussed the performance characteristics of the S&P/ASX BuyWrite Index. We will now focus on the income-generating feature of this index.

As a reminder, a covered call strategy involves selling a call option against an asset that is already owned by the option writer. A systematic long-term covered call strategy generates a steady income stream through the accumulation of option premiums. The S&P/ASX BuyWrite Index employs such a strategy by selling quarterly at-the-money calls against a long position in the underlying S&P/ASX 200. Since its launch in 2004, the index has achieved an average quarterly option premium yield of 2.98%, with yields peaking during the bear markets of the Great Financial Crisis of 2008 and March 2020 (see Exhibit 1).

The premiums and dividends generated by the S&P/ASX BuyWrite Index are reinvested into the long equity position—the underlying S&P/ASX 200. In a hypothetical scenario in which the premiums and dividends are distributed instead of reinvested, the index would have been able to achieve an annual distribution yield of 8% across its 18-year history without losing its initial principal value (see Exhibit 2). This represents a potentially valuable source of income.

Theoretically, the income-generating feature of this type of strategy is associated with the spread between implied and realized volatility. Implied volatility can be defined as the market’s prediction of an asset’s future volatility, while realized volatility represents the volatility that actually occurred. The S&P/ASX BuyWrite Index is able to capture the risk premium that arises from the discrepancies between these two measures of volatility. In general, a covered call strategy pays off when the implied volatility of the index—as measured here by the S&P/ASX 200 VIX—is greater than its realized volatility. On average, this has been the case since 2008 (see Exhibit 3). Since implied volatility is one of the key factors in option pricing, a lower realized volatility allows option sellers to capture higher option prices—premiums—than the realized market conditions would have merited—this phenomenon is known as the volatility risk premium.


The posts on this blog are opinions, not advice. Please read our Disclaimers.