Get Indexology® Blog updates via email.

In This List

Building a Passive Bridge across the Pond

Examining a Broad-Based Approach to ESG

The Dow Jones Dividend 100 Indices Part 2: Strong Fundamentals and the Benefits of Diversification

Indexing Income: How Are Insurers Diversifying with Dividends?

Latin American Equities Outperformed Global Regions in 2022

Building a Passive Bridge across the Pond

Contributor Image
Benedek Vörös

Director, Index Investment Strategy

S&P Dow Jones Indices

At over 300 years old, the British government bond and stock markets are among the world’s oldest. They are also among the largest globally; ranked by float-adjusted market capitalization, the U.K. gilt market and U.K. stock market are the fourth and third biggest, respectively. The British investment industry has existed for centuries, with the country’s (and world’s) oldest collective investment scheme launched over 150 years ago. Despite this long history, U.K. investment funds have been just as likely to suffer from home country bias as their international peers.

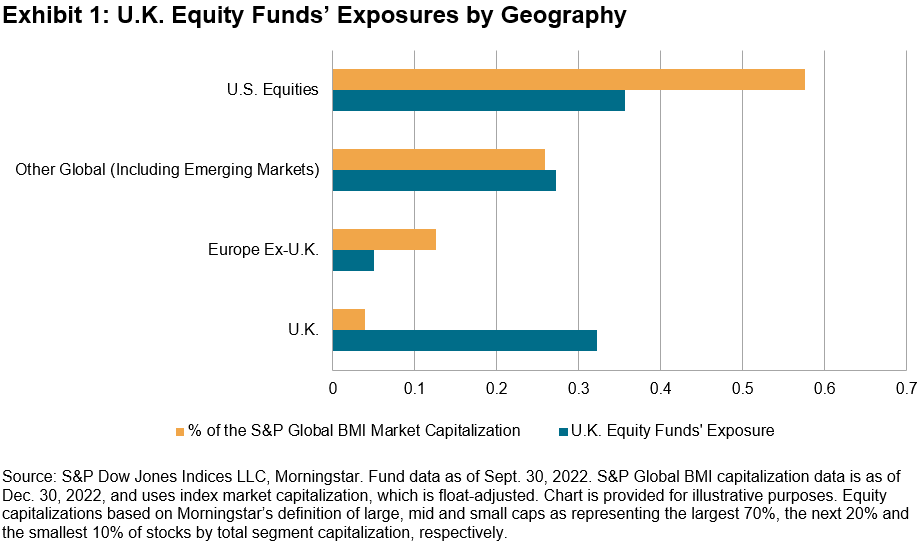
Exhibit 1 shows that U.K.-domiciled equity funds are substantially overweight their home market and underweight elsewhere, with the largest underweight in the U.S. By investing a disproportionate fraction of their assets in companies and industries based in their home country rather than globally, British market participants may be missing out on diversification benefits and potentially higher returns.

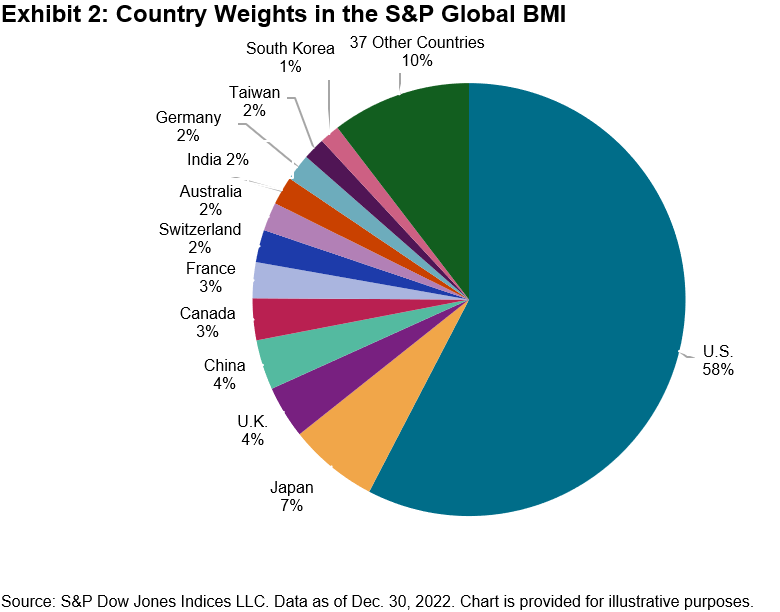
There is a large global opportunity set available to British investors, ranging across countries, sectors and currencies, and including large global companies without British equivalents. There were approximately 41,000 listed companies in the world at the end of 2019. Eliminating the smallest and least liquid names leaves around 14,000 companies from 25 developed and 24 emerging markets; Exhibit 2 shows how these compose the S&P Global BMI. With an aggregate free-float market capitalization of USD 66 trillion, the index is designed to reflect the global investable opportunity set. Given its 58% weight in the S&P Global BMI, for many investors the U.S. market represents the natural first step to globalizing their exposures.

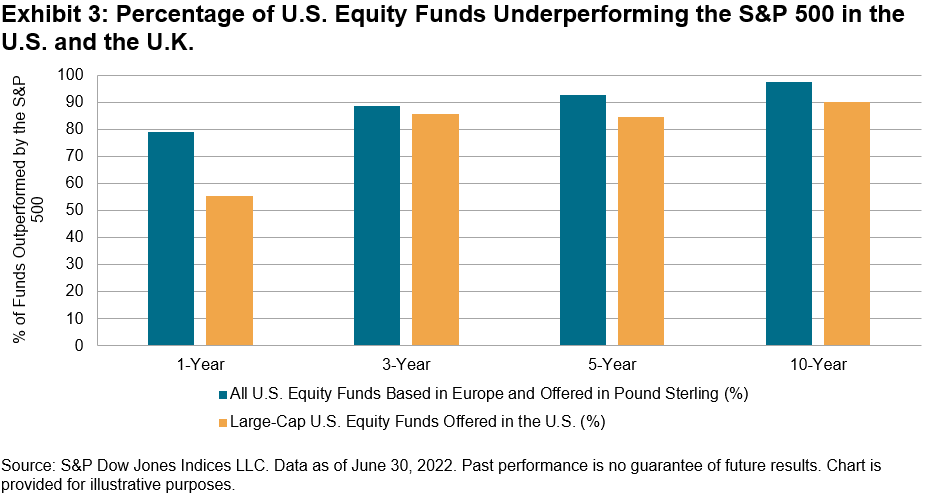
When considering an allocation to any market segment, including U.S. equities, investors must choose between active security selection and tracking a broad-based market portfolio. The SPIVA Europe Mid-Year 2022 and SPIVA U.S. Mid-Year 2022 Scorecards can help inform this decision. The historical data summarized in Exhibit 3 suggest that outperformance in large-cap U.S. equities is uncommon for fund managers based in either market, with outperformance even more elusive for longer time horizons.

These results are unsurprising. Simple arithmetic indicates that the average market participant earns the market return before fees and costs. Professional fund managers might expect to outperform in a market dominated by small retail traders, over whom they arguably have an informational and operational edge. But in markets dominated by large institutional and professional investors—as large-cap U.S. equities have been for at least 50 years—consistent outperformance becomes less likely, making the case for passive management stronger.


The posts on this blog are opinions, not advice. Please read our Disclaimers.

Examining a Broad-Based Approach to ESG

Take a closer look at the index design and data powering S&P DJI’s headline ESG indices with Maggie Dorn and DWS’ Taylor Anderson.

The posts on this blog are opinions, not advice. Please read our Disclaimers.

The Dow Jones Dividend 100 Indices Part 2: Strong Fundamentals and the Benefits of Diversification

Contributor Image
George Valantasis

Associate Director, Factors and Dividends

S&P Dow Jones Indices

In part one of this series, we highlighted how the stringent dividend sustainability and quality screens of the Dow Jones U.S. Dividend 100 Index and Dow Jones International Dividend 100 Index may have led to their outperformance in 2022 and other inflationary periods.

In this installment, we will analyze the positive effects that these screens had on the fundamentals of both indices, as well as examine examples of combining the U.S. and international indices to harness possible diversification benefits.

Comparing Fundamentals

Exhibits 1, 2 and 3 show the significantly improved value and quality metrics that both Dow Jones 100 Indices had compared with their respective benchmarks. Exhibit 1 shows that both Dow Jones Dividend 100 Indices traded at a discount to their respective benchmarks on every valuation metric. A value tilt may prove important in a rising interest rate environment, because value stocks tend to receive larger cash flows in the near term, and therefore typically have lower durations relative to growth stocks. Holding all else equal, value stocks may perform better in a rising interest rate environment compared with growth stocks.1

Furthermore, as Exhibits 2 and 3 show, both Dow Jones Dividend 100 Indices held a quality advantage and volatility reduction compared with their respective benchmarks. These features may have proved particularly beneficial amid 2022’s rapidly rising interest rates and deteriorating economic environment.

Potential Diversification Benefits

An interesting option for those wanting to reduce volatility while potentially enhancing dividend yield is to pair the Dow Jones International Dividend 100 Index with the Dow Jones U.S. Dividend 100 Index. Exhibit 4 illustrates two hypothetical weighting scenarios and their simulated performance. The first scenario allocates 70% weight to the U.S. index and 30% to the international index, while the second scenario allocates 80% weight to the U.S. index and 20% to the international index.

When observing the back-tested period of this hypothetical combined index starting in March 2005, the 70%/30% scenario had a full period of annualized 10.25% performance, exceeding both benchmarks, with volatility reduced to 14.02%. In the 80%/20% scenario, the annualized performance was to 10.56%, while the volatility was 14.11%. the back-tested hypothetical risk-adjusted return and maximum drawdown were significantly improved versus both benchmarks.

Conclusion

As discussed in part one, the Dow Jones U.S. Dividend 100 Index and Dow Jones International Dividend 100 Index performed well versus their benchmarks in 2022, despite a difficult economic environment. This may in part be due to their higher yields and fundamentals relative to their benchmarks.

For institutions only, not for retail investors.

l https://www.institutionalinvestor.com/article/b1wd19khdzwj89/In-an-Inflationary-Environment-Value-Stocks-Offer-a-Refuge

The posts on this blog are opinions, not advice. Please read our Disclaimers.

Indexing Income: How Are Insurers Diversifying with Dividends?

As insurers face one of the most challenging bond markets in decades, many insurance companies are looking for different ways to generate revenue. S&P DJI’s Raghu Ramachandran and Rupert Watts join State Street Global Advisors’ Ben Woloshin for a closer look at how and why some insurers are implementing indexed-based equity strategies.

The posts on this blog are opinions, not advice. Please read our Disclaimers.

Latin American Equities Outperformed Global Regions in 2022

Contributor Image
Silvia Kitchener

Director, Global Equity Indices, Latin America

S&P Dow Jones Indices

Despite a difficult year for most global equity markets, the S&P Latin America BMI gained 4.9% in 2022, and it was the only major regional equity market to close the year in positive territory. This marked a stark reversal from 2021, when Latin American equities were the sole region in the red, while the S&P 500® and several other regional equity markets hit record highs.

While most equity markets were hampered by rising interest rates, recession concerns and a steep decline in Information Technology and other growth-oriented stocks, Latin American equities benefited from high exposure to commodities and limited exposure to Information Technology, along with currency strength versus the U.S. dollar.

On a quarterly basis, global regions struggled throughout the year. Latin America, on the other hand, was up three of the four quarters, as shown by the performance of the S&P Latin America BMI (see Exhibit 2).

A closer look at the main country indices shows that Argentina’s S&P MERVAL (ARS) posted the largest gains for Q4 (45.3%) and YTD (142.0%). However, these returns are reflective of the country’s high inflation rate. Focusing on the emerging markets in the region, Chile was the top performer in 2022, as reflected by the S&P IPSA, driven mainly by its exposure to mining, which kept it in positive territory in Q2 (while other regions posted losses in that period). Peru and Colombia, despite recent political instability with newer elected governments, ended the year losing a mere 2% each. The largest markets in the region, Brazil and Mexico, both had their ups and downs; in the end, Brazil was able to generate higher returns, driven by its mining and oil & gas companies, helping the S&P Brazil LargeMidCap (BRL) gain 3.5%, while Mexico’s S&P/BMV IRT (MXN) was down 5.7% for the year.

Sector analysis shows that the one-year returns were mixed. The rise in oil prices drove the Energy sector (41.2%) to outperform. Other top performers among the S&P Latin America BMI sectors were Real Estate (16.3%) and Utilities (14.5%), however Financials (8.8%) and Materials (9.1%), which are represented by the largest companies in the region, had the greatest contribution to returns after Energy (see Exhibit 4).

In terms of securities, Exhibit 5 shows the top 10 companies with the largest contribution to returns in 2022. On the other side of the spectrum, some of the largest companies in the region that underperformed for the year were Mexico’s America Movil, Grupo Mexico and Cemex.

For more information on how Latin American benchmarks performed in Q4 2022, read the latest Latin America Scorecard.

The posts on this blog are opinions, not advice. Please read our Disclaimers.