
As insurers face one of the most challenging bond markets in decades, many insurance companies are looking for different ways to generate revenue. S&P DJI’s Raghu Ramachandran and Rupert Watts join State Street Global Advisors’ Ben Woloshin for a closer look at how and why some insurers are implementing indexed-based equity strategies.
The posts on this blog are opinions, not advice. Please read our Disclaimers.
Indexing Income: How Are Insurers Diversifying with Dividends?
Latin American Equities Outperformed Global Regions in 2022
The Dow Jones Dividend 100 Indices Part 1: A Focus on Dividend Sustainability and Quality
Examining Tactical Approaches to Sectors
The Key to the S&P 500 ESG Index’s Outperformance: Avoiding the “Worst”
Indexing Income: How Are Insurers Diversifying with Dividends?
Latin American Equities Outperformed Global Regions in 2022

Despite a difficult year for most global equity markets, the S&P Latin America BMI gained 4.9% in 2022, and it was the only major regional equity market to close the year in positive territory. This marked a stark reversal from 2021, when Latin American equities were the sole region in the red, while the S&P 500® and several other regional equity markets hit record highs.
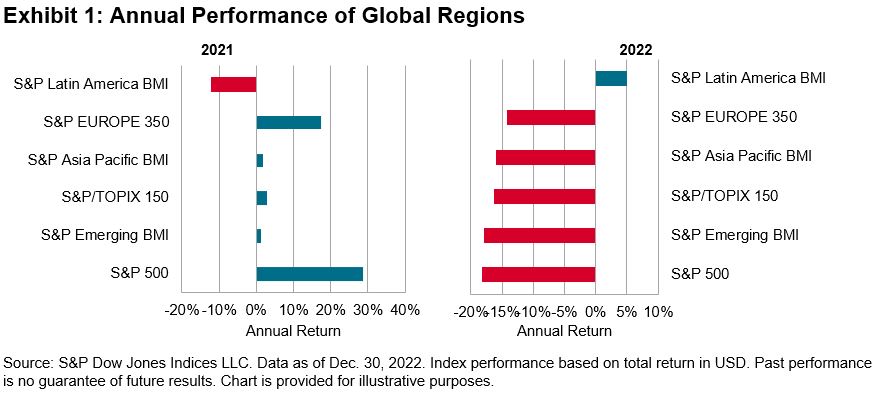
While most equity markets were hampered by rising interest rates, recession concerns and a steep decline in Information Technology and other growth-oriented stocks, Latin American equities benefited from high exposure to commodities and limited exposure to Information Technology, along with currency strength versus the U.S. dollar.
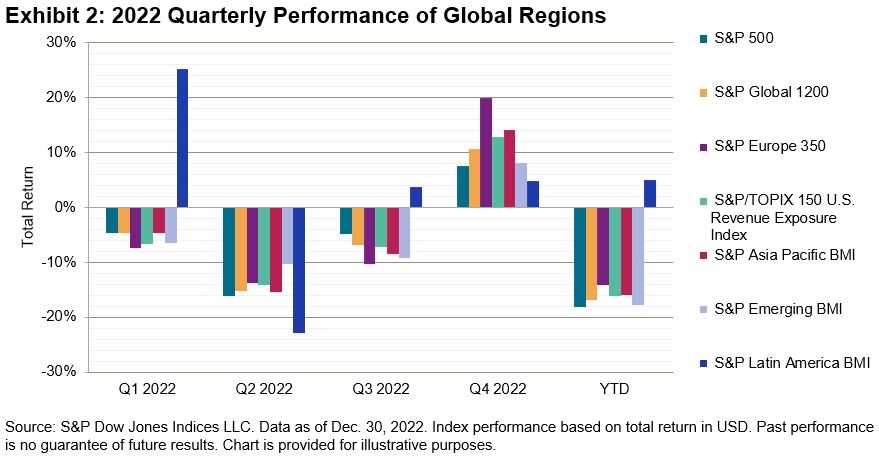
On a quarterly basis, global regions struggled throughout the year. Latin America, on the other hand, was up three of the four quarters, as shown by the performance of the S&P Latin America BMI (see Exhibit 2).
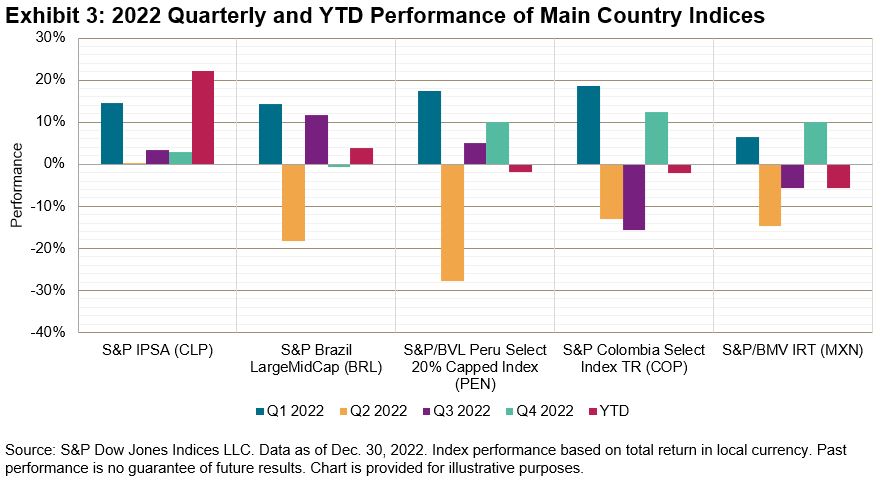
A closer look at the main country indices shows that Argentina’s S&P MERVAL (ARS) posted the largest gains for Q4 (45.3%) and YTD (142.0%). However, these returns are reflective of the country’s high inflation rate. Focusing on the emerging markets in the region, Chile was the top performer in 2022, as reflected by the S&P IPSA, driven mainly by its exposure to mining, which kept it in positive territory in Q2 (while other regions posted losses in that period). Peru and Colombia, despite recent political instability with newer elected governments, ended the year losing a mere 2% each. The largest markets in the region, Brazil and Mexico, both had their ups and downs; in the end, Brazil was able to generate higher returns, driven by its mining and oil & gas companies, helping the S&P Brazil LargeMidCap (BRL) gain 3.5%, while Mexico’s S&P/BMV IRT (MXN) was down 5.7% for the year.
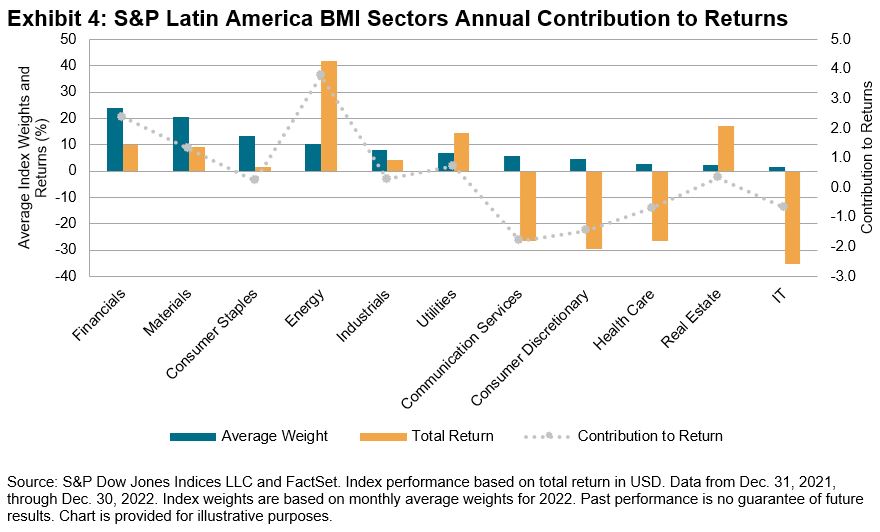
Sector analysis shows that the one-year returns were mixed. The rise in oil prices drove the Energy sector (41.2%) to outperform. Other top performers among the S&P Latin America BMI sectors were Real Estate (16.3%) and Utilities (14.5%), however Financials (8.8%) and Materials (9.1%), which are represented by the largest companies in the region, had the greatest contribution to returns after Energy (see Exhibit 4).
In terms of securities, Exhibit 5 shows the top 10 companies with the largest contribution to returns in 2022. On the other side of the spectrum, some of the largest companies in the region that underperformed for the year were Mexico’s America Movil, Grupo Mexico and Cemex.
For more information on how Latin American benchmarks performed in Q4 2022, read the latest Latin America Scorecard.
The posts on this blog are opinions, not advice. Please read our Disclaimers.The Dow Jones Dividend 100 Indices Part 1: A Focus on Dividend Sustainability and Quality

Looking back, 2022 was an impressive year for passive dividend indices, both with respect to performance and inflows on the back of rising interest rates. The Dow Jones U.S. Dividend 100 Index and Dow Jones International Dividend 100 Index were two of the standout performers, which may be due to their emphasis on strong fundamentals and robust dividend payments.

In this blog, we will examine the two indices’ focus on dividend sustainability and quality as well as review their historical performance and dividend yields. In a subsequent blog, we will analyze their fundamentals and provide back-tested historical simulations combining the U.S. and international versions for those wishing to see the benefits of diversification.
Stringent Fundamental Screening
Both Dow Jones Dividend Indices use stringent fundamental screening when selecting constituents. In fact, multiple screens are applied, including value, growth and, most extensively, quality (there is also a low volatility screen applied to the international version).
Their methodologies begin by including only companies that have paid dividends for at least 10 consecutive years. Stocks are then ranked by indicated annualized dividend (IAD) yield, with those below the eligible median stock’s IAD yield being removed.

Next, the 100 top-ranked stocks are selected based on their equal-weighted composite score consisting of free cash flow (FCF) to total debt, return on equity (ROE), IAD yield and five-year dividend growth rate. The Dow Jones International Dividend 100 Index includes an additional step of filtering out the bottom half of stocks with the highest three-year price volatility. Lastly, both indices weight constituents quarterly, using a float-market-capitalization approach (subject to weight caps).
This emphasis on multi-factor screening is unique and leads to superior fundamental metrics versus their benchmarks, which we will examine in part two of this blog series. Specifically, quality measures such as FCF to total debt and ROE are important. FCF to total debt measures how long it will take a company to repay its debt using solely its free cash flow, and ROE measures how efficiently a company employs shareholder capital to generate profits.
Performance
Over the long term, Exhibit 3 shows that the Dow Jones Dividend 100 Indices generated significantly higher risk-adjusted returns over the full back-tested period versus their respective benchmarks. Both achieved this by generating higher absolute returns while also exhibiting less volatility. The max drawdowns were also improved, by over 6% for the Dow Jones U.S Dividend 100 Index and over 7% for the Dow Jones International Dividend 100 Index.

Exhibit 4 displays the outperformance of both Dow Jones Dividend 100 Indices versus their respective benchmarks in periods when the year-over-year CPI rate exceeded 3% for at least six consecutive months. Both indices significantly outperformed their respective benchmarks in the three most severe inflationary periods dating back to 2005. During the current inflationary period, the Dow Jones U.S. Dividend 100 Index and Dow Jones International Dividend 100 Index have outperformed their respective benchmarks by 14.81% and 12.02%, respectively.

Not surprisingly, dividend yields also outperformed their benchmarks. The average yield of the Dow Jones U.S. Dividend 100 Index was 3.86% over the full period versus 1.83% for the Dow Jones U.S. Broad Stock Market Index. The average yield of the Dow Jones International Dividend 100 Index was 4.33% versus 2.89% for the Dow Jones Global ex-U.S. BMI.

Conclusion
The Dow Jones U.S. Dividend 100 Index and Dow Jones International Dividend 100 Index have performed well relative to their benchmarks in 2022, in an economic environment affected by rapidly rising interest rates, increasing geopolitical risks and slowing economic growth. Stay tuned for part two of this blog series, where we will analyze the fundamentals of these two indices and examine hypothetical portfolios that combine them.
The posts on this blog are opinions, not advice. Please read our Disclaimers.Examining Tactical Approaches to Sectors
Why does sector dispersion matter and how can it inform tactical approaches to sectors? S&P DJI’s Elizabeth Bebb and Invesco’s András Vig explore how sector dispersion can impact long-term asset allocations.
The posts on this blog are opinions, not advice. Please read our Disclaimers.The Key to the S&P 500 ESG Index’s Outperformance: Avoiding the “Worst”

Now approaching its fourth anniversary since launch, the S&P 500® ESG Index seeks to reflect many of the attributes of the S&P 500 itself, while providing an improved sustainability profile as a result of an updated ESG score.1 With live performance data covering an extraordinary period—including two bear markets on either side of a growth boom—we are presented with a real-world performance test for the index’s improved sustainability profile.
From its launch date until the end of 2022, the ESG index outperformed its benchmark, the S&P 500, by a cumulative 9.16% (impressive in the context of a benchmark that is notoriously hard to beat). But how important were higher or lower ESG-scoring constituents in generating this excess return?
To measure this, we created hypothetical ESG “quintile portfolios,” reconstituted annually by ranking the S&P 500’s constituents by their ESG score and assigning each to one of five portfolios, from highest to lowest ESG-scoring. The hypothetical cap-weighted performance of these portfolios was then calculated and used to create a Brinson-like2 “ESG attribution,” teasing out the importance of ESG exposures in the returns in the S&P 500 ESG Index.
Exhibit 1 summarizes the results of this analysis, including the average weights of the S&P 500 ESG Index and the S&P 500 in each ESG quintile (from high to low scoring), the corresponding portfolio and index returns, as well as a summary of the corresponding allocation and selection effects over the full period.3
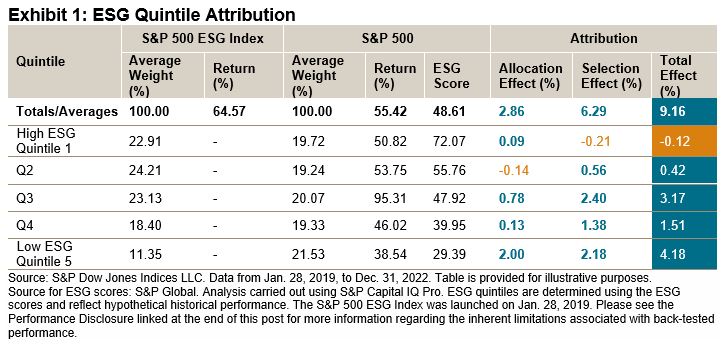
Although an overweight in the High ESG Quintile 1 detracted from returns, the total effect from over- and underweighting across and within the ESG quintiles was positive in every other quintile. Most strikingly, underweighting the lowest ESG-scoring constituents contributed the most to the S&P 500 ESG Index’s outperformance. Specifically, the Low ESG Quintile 5 underperformed S&P 500 by -16.9%, the S&P 500 ESG Index underweighted this quintile by an average of 10.2%, and the combined effect was to generate 4.18% in excess return for the S&P 500 ESG Index.
Drilling down, Exhibit 2 compares the performance of the Lowest ESG Quintile to the S&P 500 in each calendar year included in the sample: it underperformed in three of the four calendar years represented. Exhibits 1 and 2 together show that, in short: the S&P 500 ESG Index consistently benefited from avoiding the worst-scoring constituents.

Of course, performance drivers can (and do) change over time. ESG-based attribution analysis such as these can offer insight and perspective as markets and conditions evolve. Investors seeking similar attributions for a range of our flagship indices are now able to find them—updated as of the most recent quarter-end—in S&P DJI’s recently launched Climate & ESG Index Dashboard.
Register here to receive quarterly insights and performance attributions for our range of flagship ESG and climate indices.
1 The index methodology is available at: www.spglobal.com/spdji/en/documents/methodologies/methodology-sp-esg-index-series.pdf.
2 Similar to our previous analysis with Carbon Quintiles, the quintile portfolios are each assigned an equal number of benchmark constituents, and the impact of weighting to stocks with higher- or lower ESG scores is measured analogously to the way sector or country effects are measured by a traditional Brinson attribution.
3 Analysis carried out using S&P Capital IQ Pro.
The posts on this blog are opinions, not advice. Please read our Disclaimers.