

Academic theorists often assert the decision of where to invest as more important than the decision of what to invest in. Studies suggest that up to 90% of investment returns are attributable to location.
Regional equity indices represent different combinations of geographic and sector exposure. These differences can potentially improve the diversification benefits available when combining indices. We compare the underlying sector and geographical revenue exposures of two S&P DJI regional indices and show that utilizing combinations of equity indices may improve an investor’s risk/return potential, as well as reduce home bias (an anomaly whereby asset allocators overweight their domestic stock market).
What Is the S&P 500®?
Widely considered the primary gauge of the U.S. large-cap stock market, the S&P 500 is a float-adjusted, market-capitalization-weighted index that reflects 500 of the largest, most well-known companies domiciled in the U.S. The index incorporates a range of inclusion criteria, including a profitability screen. The S&P 500 represents over 80% of the total U.S. market capitalization as measured by the S&P Total Market Index (TMI). Many of the index’s constituents have a major global presence, with revenues generated in a wide range of foreign countries. Therefore, despite its U.S. focus, the S&P 500 provides insight into companies with a diverse revenue base across geographies and sectors.
Europe versus the U.S. – Differences in Exposure
The S&P Europe 350® is a European-centric counterpart to the S&P 500. The index focuses on the largest blue-chip companies domiciled in 16 European countries, weighted by float-adjusted market capitalization based on a range of inclusion criteria.
We use FactSet Geographic Revenue Exposure (GeoRev™) data, adjusted for sales-weighted exposure, to understand the geographic spread of constituent revenues for both the S&P 500 and the S&P Europe 350. For example, companies in the S&P 500 generate around 70% of their revenue in the U.S., while companies within the S&P Europe 350 generate only 24% of their revenue from the same location.
Exhibit 1 compares the S&P 500 and the S&P Europe 350. It shows that the revenues of the S&P Europe 350 have a greater tilt away from the U.S. and toward Europe than the S&P 500. Therefore, a strategy combining the two indices may lead to a more diverse geographic revenue exposure.

In practice, industries are not distributed evenly across geographies. Exhibit 2 shows that the S&P Europe 350 has significant weight in Industrials and Health Care, reflecting the strong franchises in these sectors in countries such as Germany and France for Industrials and the U.K. for Health Care. The S&P 500 has a higher weight in Information Technology and Communication Services than the European index.
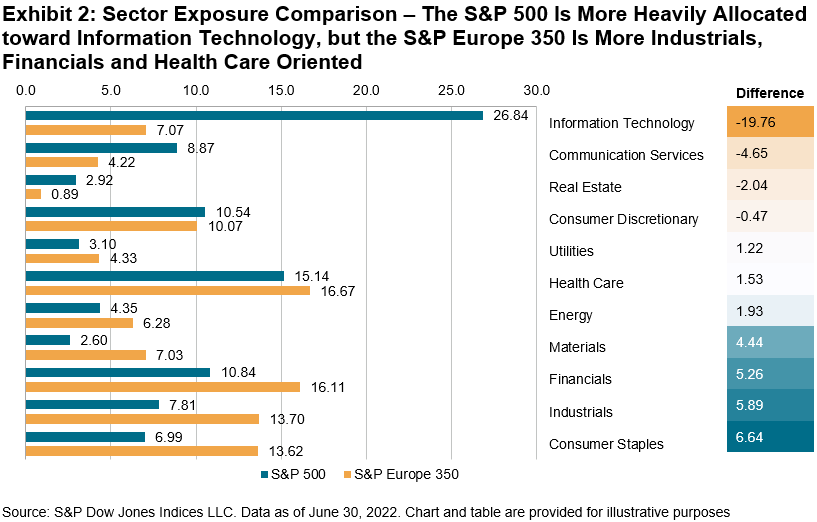

Exhibit 3 provides the annualized total return and the return/risk ratios for various hypothetical combinations of the S&P 500 and the S&P Europe 350 over different periods ending in September 2022. Exhibit 4 draws the efficient frontier for different combinations of S&P Europe 350 and S&P 500 allocations. The results show that over longer time periods, a hypothetical combination of European and U.S. indices offered a higher return and more favorable risk profile than the S&P Europe 350 investment alone, perhaps reflecting the benefits of diversification.

The posts on this blog are opinions, not advice. Please read our Disclaimers.


 Exhibit 4 shows that the S&P Focused Indices’ construction provided similar turnover figures as their benchmarks, historically.

