
| Take a closer look at the importance of index construction and underlying data across the ESG spectrum with S&P DJI’s Ben Leale-Green.
|

Using Indices to Help Align ESG Goals and Values
Minimizing Carbon Intensity with the S&P Carbon Control Indices
Low Volatility Holds Its Own
Dividend Growers in Inflationary Environments
S&P U.S. Indices Mid-Year 2022: Analyzing Relative Returns to CRSP
Using Indices to Help Align ESG Goals and Values
Minimizing Carbon Intensity with the S&P Carbon Control Indices

When it comes to climate change, one of the most effective mitigation options is to decarbonize the economy.1 Not only does the world need to rethink energy systems, transport technologies and materials production processes, but also the role of capital in financing the low-carbon transition. Low-carbon indices offer market participants an efficient way of managing and mitigating carbon-related financial risks within investments. Launched in August 2021, the S&P Carbon Control Indices seek to systematically reduce index-level carbon intensity2 relative to its underlying benchmark while maintaining similar industry group and country composition. Here, we explore how.
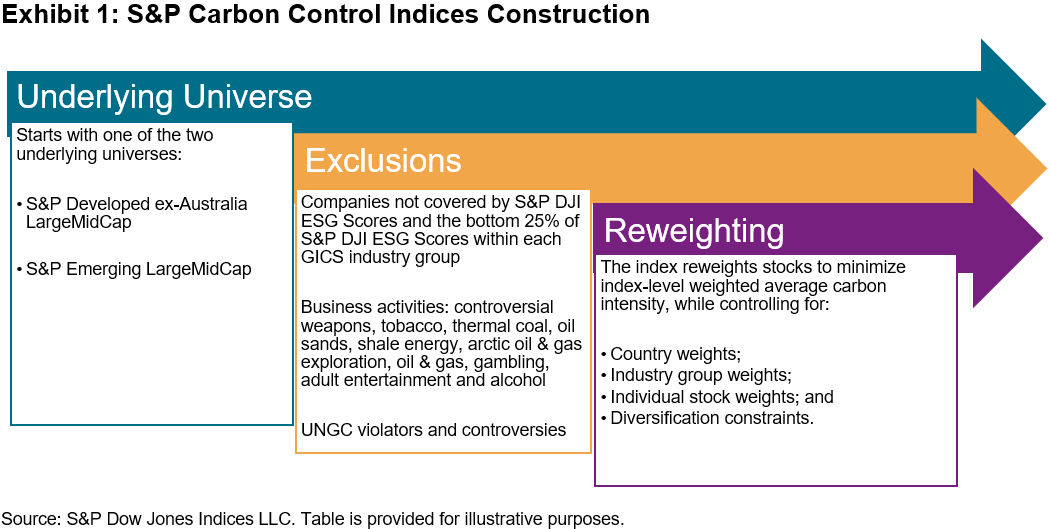
How Are the S&P Carbon Control Indices Constructed?
Exhibit 1 highlights how the S&P Carbon Control Indices are constructed. First, within each underlying universe, the carbon control index excludes based on a variety of factors, including:
- Companies with poor S&P DJI ESG Score3 relative to their GICS industry group peers;
- Companies involved in detrimental business activities; and
- UNGC violators and companies involved in controversies.
Then, the index reweights stocks to minimize index-level-weighted average carbon intensity compared to that of its market-cap-weighted benchmark.4
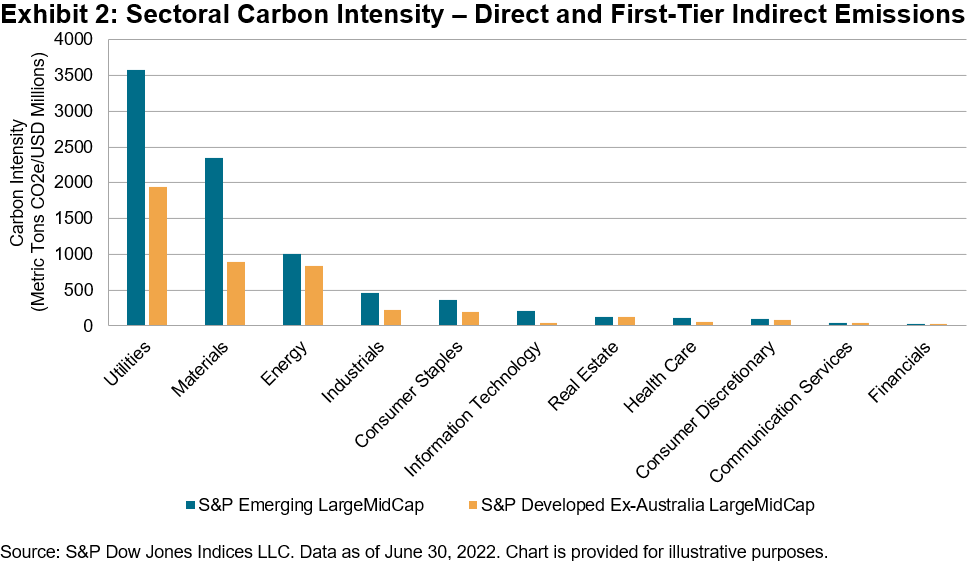
Understanding Sources of Emissions
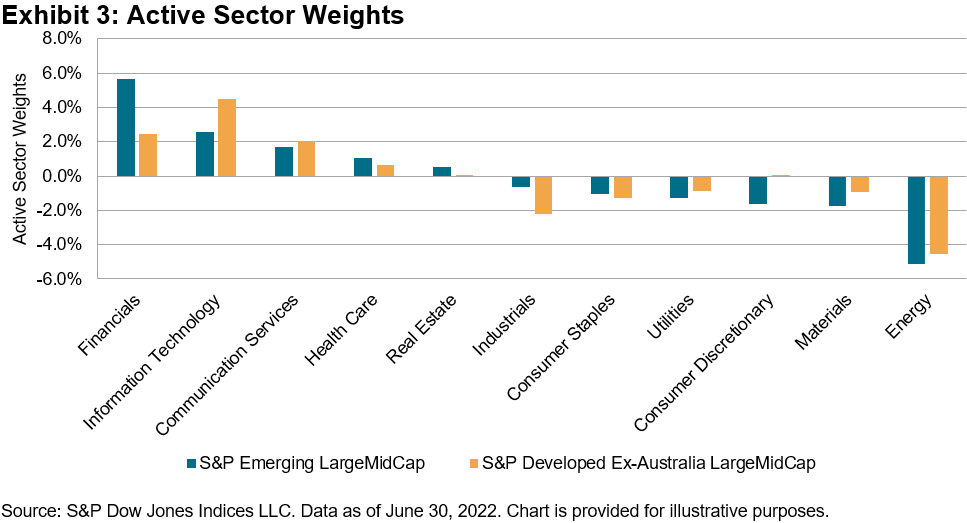
Unsurprisingly, when looking at sectors more closely, we find that Utilities, Materials and Energy have been the largest carbon emitters of direct and first-tier upstream emissions per unit of revenue,5 accounting for more than 80% of total emissions. It’s also interesting to note how Utilities and Materials companies within emerging markets are more carbon intense than their counterparts in the developed market region (see Exhibit 2). It follows that the S&P Carbon Control Indices underweighted those sectors while overweighting Financials, Information Technology and Communication Services, whose products and services have been generally low-carbon intense (see Exhibit 3).
 Systematically Reducing Carbon Intensity
As seen in Exhibit 5, the S&P Carbon Control Indices minimized index-level weighted average carbon intensity by 70% and 80%, for the developed and emerging market regions, respectively. Further, they also reduced fossil fuel reserves emissions by 100%, mostly due to the fossil fuel exclusions. As these indices also incorporate the S&P DJI ESG Score into the selection stage of index constituents, it also provides an overall improvement of the index-level S&P DJI ESG Score and its sub-dimensional scores. This is a beneficial outcome: S&P DJI ESG Scores cover far more areas than carbon emissions, thus only incorporating carbon intensity would not guarantee that broader ESG objectives would be accounted for.
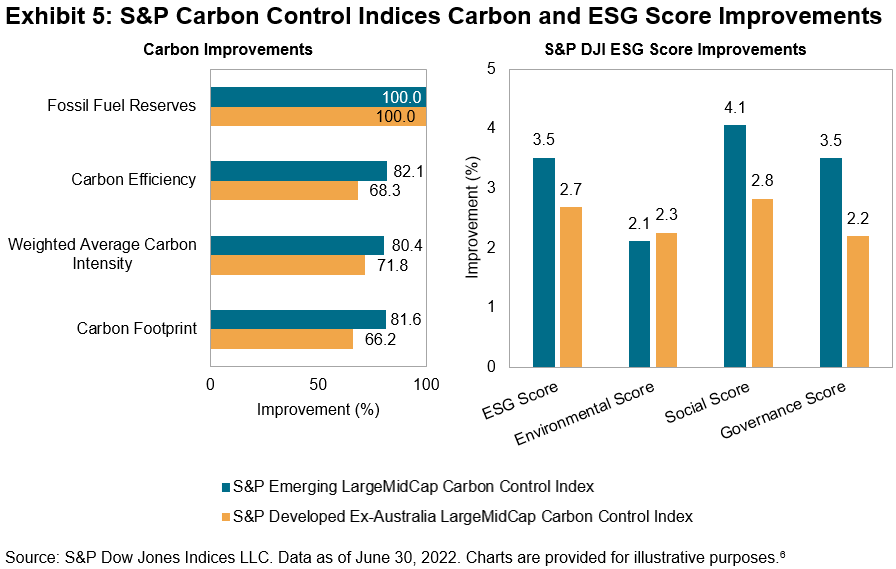
The S&P Carbon Control Indices have shown positive performance relative to their market-cap-weighted benchmarks, both in the back-tested and live periods of the indices, with a three-year tracking error of 1.16% and 1.36% for the emerging and developed market regions, respectively.
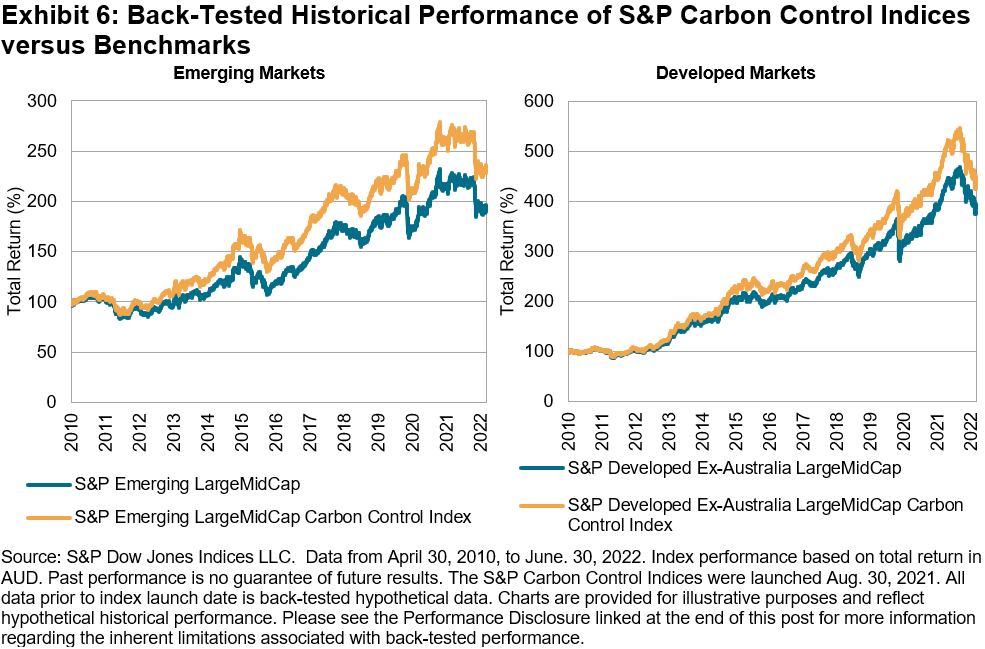
As the world pushes to transition to a greener economy, carbon will continue to represent an imminent risk for businesses and the investment community alike. The S&P Carbon Control Indices combine selection and reweighting approaches that significantly reduce index-level carbon intensity relative to their underlying benchmarks. Simply put, these indices provide a relative improvement—not an absolute one. For carbon-conscious market participants, this may be just the right fit.
1 According to the IPCC, to keep warming below 1.5°C as called for in the Paris Agreement, by 2030, global emissions need to be reduced by 45% and reach net zero by 2050. Please note that the S&P Carbon Control Indices do not seek to align with the objectives of the Paris Agreement to keep warming below 1.5°C.
2 Carbon intensity is defined as the metrics tons of operational and first-tier supply chain carbon emissions per USD 1 million in revenues.
3 For more information on S&P DJI ESG Scores, please see here.
4 For more information on the S&P Carbon Control Indices, please refer to the methodology.
5 For more information on greenhouse gas emissions calculated by Trucost, please see here.
6 For more information on index carbon metrics, please see here.
The posts on this blog are opinions, not advice. Please read our Disclaimers.Low Volatility Holds Its Own

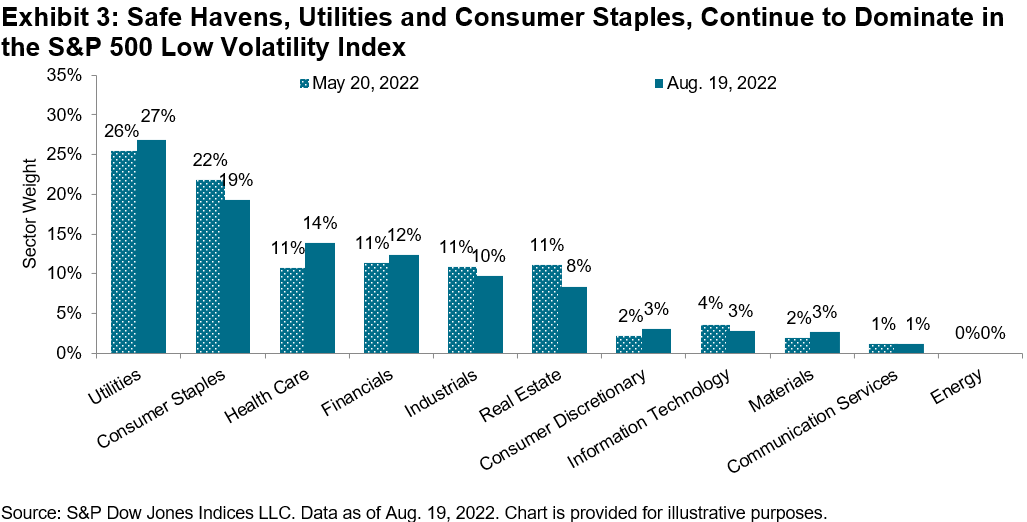
If the first six months of 2022 were defined by the woes of equities, the year’s second half has been defined (so far!) by a comeback. Since hitting a low in mid-June, the S&P 500® has gained an impressive 17.1% through Aug. 18, 2022. In such an environment, low volatility strategies are expected to underperform, and, reliably, the S&P 500 Low Volatility Index (which has historically tempered the performance of the benchmark) gained “just” 14.5%, underperforming 2.6% in the same period. This reflects an upside capture of 85%. (Historically, the low volatility index’s upside capture has averaged 72%.) 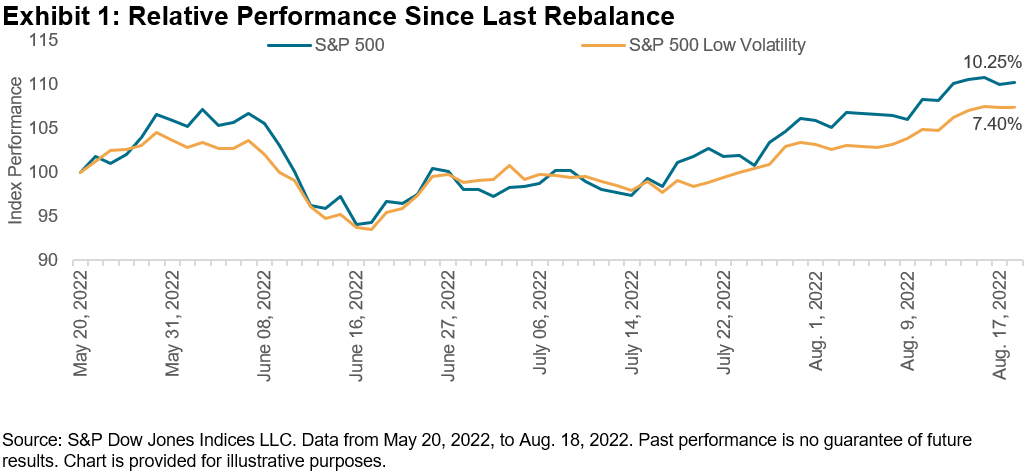
Volatility has generally risen since the low volatility index’s last rebalance, with the biggest increase in the Consumer Discretionary and Energy sectors.
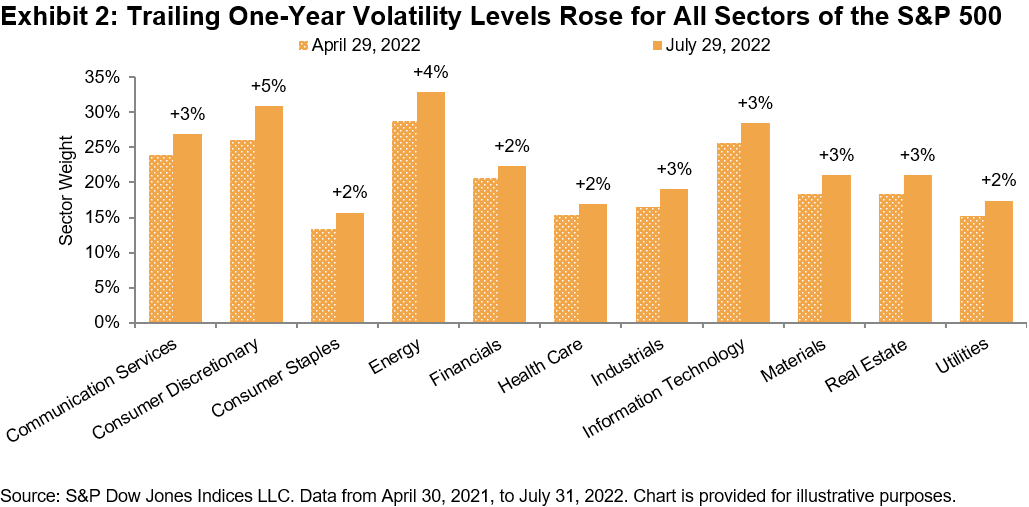
The latest rebalance for the S&P 500 Low Volatility Index shifted an additional 3% weight to the Health Care sector. Consumer Discretionary, despite notching the highest volatility increase, also added weight to the portfolio, pointing to pockets of relative stability within the sector. Information Technology, which in recent years has had a higher allocation relative to its presence historically, has been paring back its allocation in the past three rebalances. It now takes up just 3% of the low volatility index. Energy’s weight remains at 0%. The latest rebalance is effective after the market close on Aug. 19, 2022.
The posts on this blog are opinions, not advice. Please read our Disclaimers.
Dividend Growers in Inflationary Environments

With inflation being a major issue in the current economy, consumers are increasingly looking for ways to combat their loss of purchasing power. One way to achieve this is to have sources of income that keep pace with, or even exceed, the inflation rate. Over the past four decades, dividends have played an increasing role as a source of income, growing from just 2.88% of all income in December 1981 to 6.25% of all income in March 2022.1
During inflationary periods, history has shown the importance of focusing on companies that have consistently increased dividends. A company’s ability to consistently increase dividends may signal a quality company that is able to continually generate increasing cash flows as well as high returns on capital.
Dividend Growers Methodology
In this blog, we will focus on the S&P U.S. Dividend Growers Index and S&P Global ex-U.S. Dividend Growers Index, which provide exposure to companies that have consecutively increased dividends for 10 and 7 years, respectively. In addition to the dividend policy filter, the top 25% of stocks ranked by indicated annual dividend yield are also excluded from these indices. This diminishes the risk of owning “yield traps,” or companies that have high dividend yields simply due to large stock price declines.
Dividend Growth Rate Outpaces the Inflation Rate over the Long Term
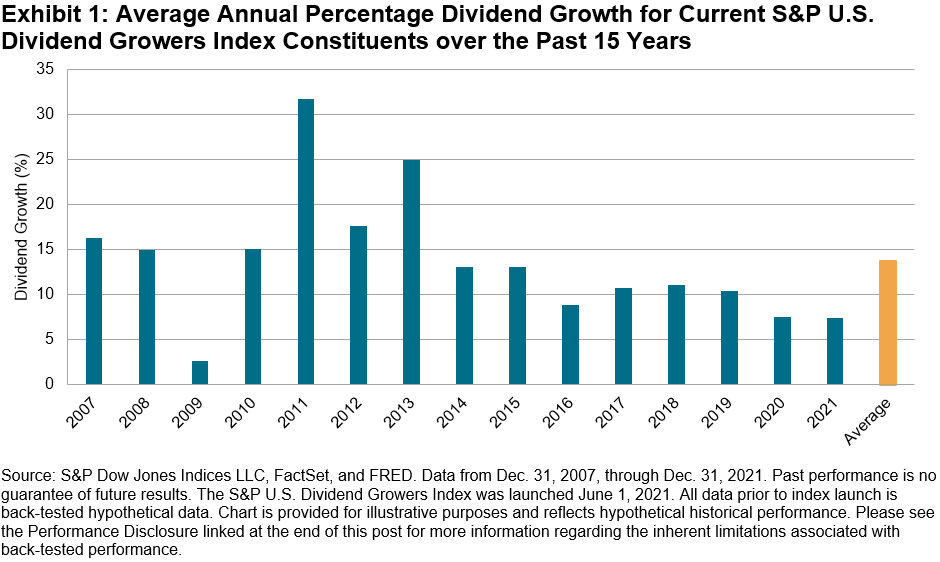
Exhibit 1 shows the average year-over-year annual percentage dividend growth rate for current S&P U.S. Dividend Growers Index constituents. The average year-over-year dividend growth rate over the past 15 years was 13.71%, surpassing the average year-over-year U.S. CPI rate of 2.21% over the same period.
IHS Markit Forecasted Dividend Growth Rate
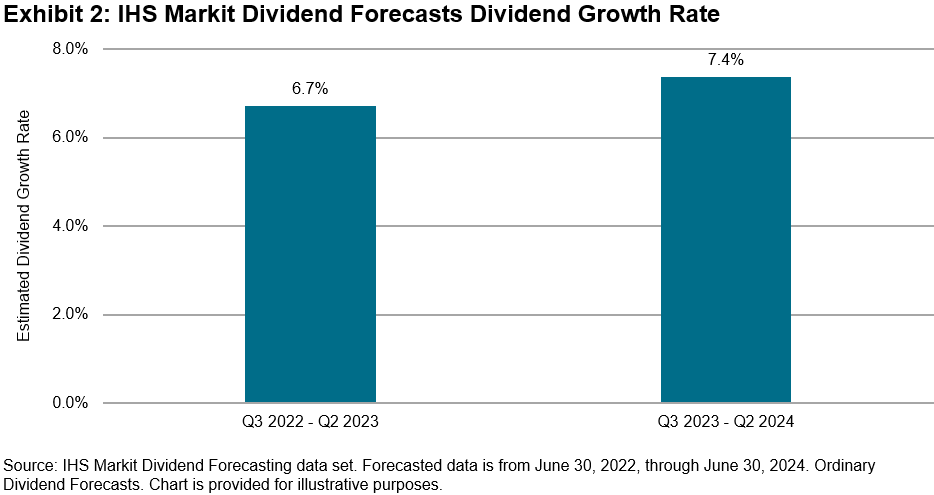
Exhibit 2 shows the year-over-year forecasted dividend growth rate for current S&P U.S. Dividend Growers Index constituents using the IHS Markit Dividend Forecasting data set.2 S&P Global’s Dividend Forecasting team provides discrete forecasts of the size and timing of dividend payments for over 30,000 stocks worldwide. Forecasts for stocks in the core Dividend Forecasting universe are generated by analysts using fundamental research, market announcements and unique quantitative insight. Over the next four quarters, forecasted dividend growth is expected to remain robust, at 6.7% year-over-year. The forecasted growth rate for the following four quarters (Q3 2023 to Q2 2024) is 7.4% year-over-year.
Performance During Inflationary Periods
Exhibit 3 displays the outperformance of the S&P Dividend Growers Indices versus their respective benchmarks in periods when the year-over-year CPI rate exceeded 3% for at least six consecutive months. Both S&P Dividend Growers Indices significantly outperformed their benchmarks in the three most severe inflationary periods dating back to 2006.
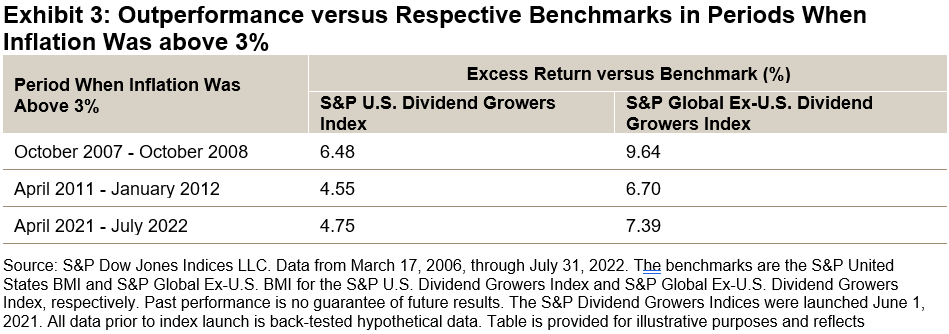
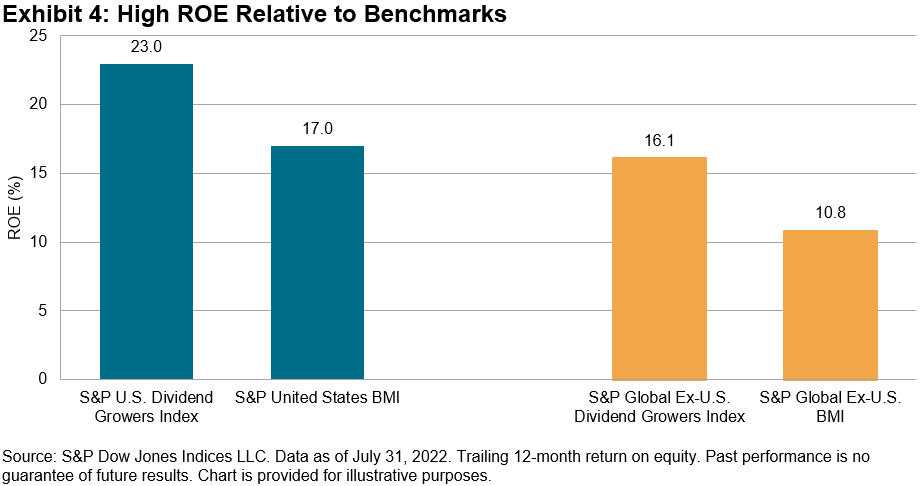
Exhibit 4 shows the trailing 12-month return on equity (ROE) for both S&P Dividend Growers Indices versus their respective benchmarks. The outperformance of the S&P Dividend Growers Indices during inflationary periods may be due to their substantially higher ROE. This is significant because companies that earn low returns on their capital can lose value in real terms, when the capital they invest earns a lower return than the inflation rate.
Full-Period Performance
Exhibit 5 details the full-period performance comparison. Both S&P Dividend Growers Indices generated superior full-period risk-adjusted returns versus their benchmarks. Importantly, the S&P Dividend Growers Indices outperformed their benchmarks YTD as well as over the past year.
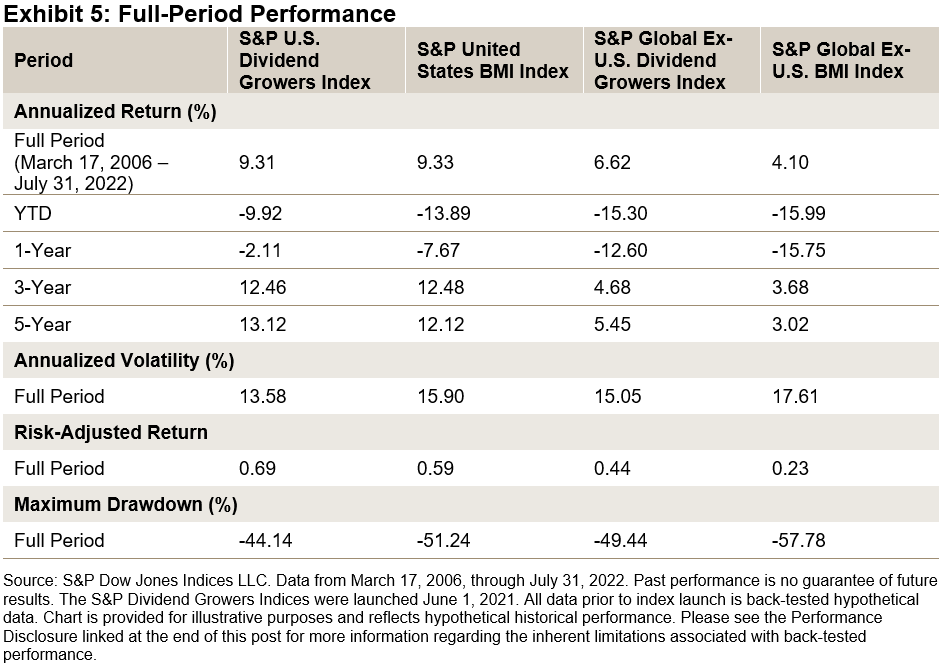
The S&P Dividend Growers Indices have historically outperformed their benchmarks on a risk-adjusted basis. Notably, they have significantly outperformed in recent inflationary periods, possibly due to their high-quality characteristics. Hence, the S&P Dividend Growers Indices may be a good option to consider if current inflation trends continue.
1 Source: Bureau of Economic Analysis. Data as of March 31, 2022.
2 See https://cdn.ihsmarkit.com/www/pdf/0822/IHS_Markit_Dividend_Forecasting_Methodology.pdf
The posts on this blog are opinions, not advice. Please read our Disclaimers.S&P U.S. Indices Mid-Year 2022: Analyzing Relative Returns to CRSP

- Categories Equities
- Tags 2022, core, Cristopher Anguiano, equities, Index Construction, index performance, Mid-Year 2022, performance comparison, quality, S&P 500, S&P Composite 1500, S&P DJI U.S. equity indices, S&P MidCap 400, S&P SmallCap 600, S&P U.S. Indices, U.S., U.S. Core, U.S. Core Equities, U.S. Equities, United States, US FA
The first half of 2022 saw supply chain disruptions, interest rate hikes amid rising inflation and geopolitical tensions sour sentiment, creating a complex environment for equity markets. The S&P 500® was down 20%, which represented the worst start of the year since 1970. What was the impact on other S&P DJI U.S. equity indices and their competitors? In this blog, we analyze and compare the mid-year absolute and relative performance of various S&P DJI U.S. equity indices and CRSP equity indices designed to represent similar segments.
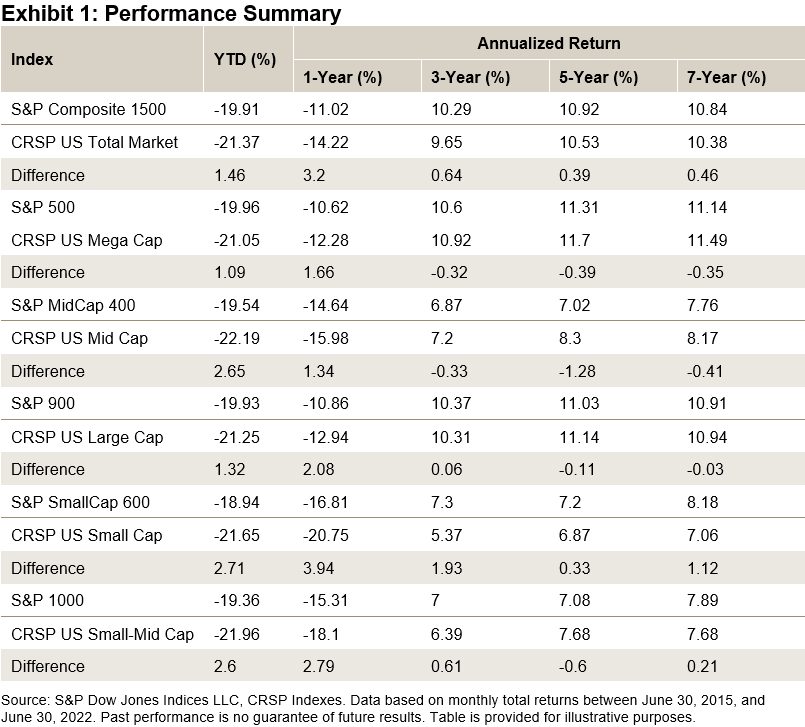
The S&P Composite 1500® is designed to measure the performance of U.S. equities across the size spectrum by combining the S&P 500, S&P MidCap 400® and the S&P SmallCap 600® in float-market cap proportions. But the S&P 1500® is not alone in seeking to measure the U.S. equity market; the CRSP US Total Market Index has a similar objective.
Exhibit 1 shows that the S&P 1500 outperformed the CRSP Total Stock Market Index over various horizons. The S&P 1500’s outperformance typically came from across the cap spectrum: the S&P 500, S&P 400® and S&P 600® outperformed their respective CRSP counterparts in several periods, mainly on a YTD and 1-year basis.
 Differences in index construction can help us to understand these performance differentials. Exhibit 2 summarizes the methodologies underlying the S&P DJI U.S. equity indices and their CRSP counterparts. One of the biggest differences between the methodologies is that, unlike the CRSP indices, the S&P 1500 and its component indices use an earning screen: new index additions must have a history of positive earnings.
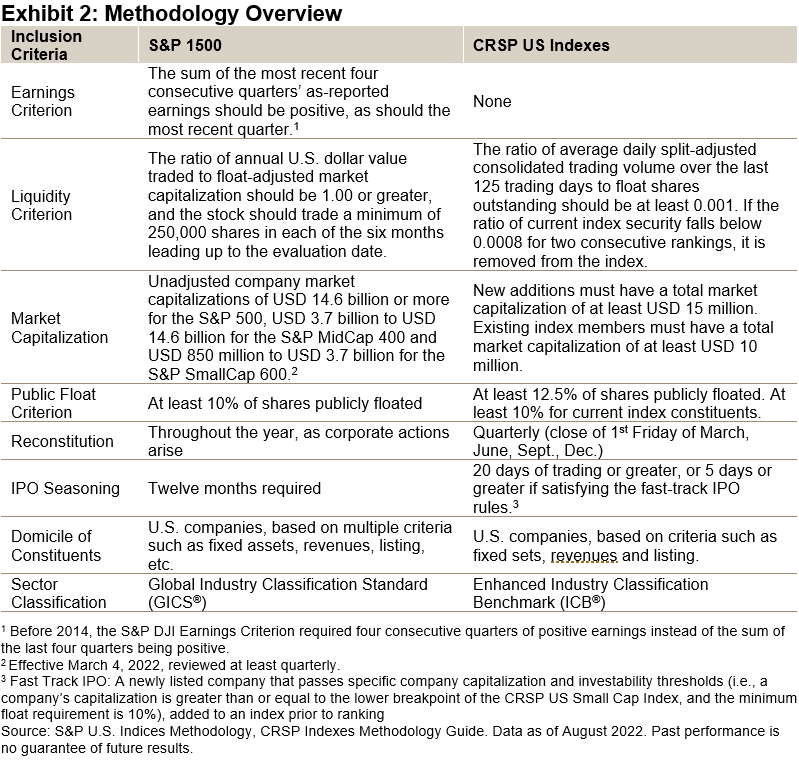
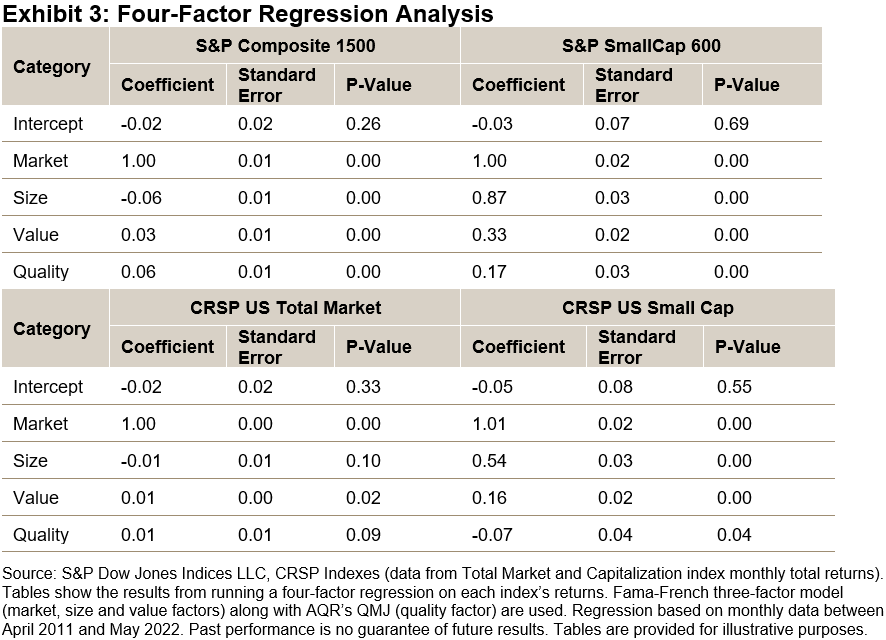
Exhibit 3 shows the impact of the earnings screen on the S&P Composite 1500’s and S&P SmallCap 600’s factor exposures: each S&P DJI U.S. equity index has statistically significant positive quality exposure. Similar results can be obtained for other market cap segments. Given the role of the quality factor in driving relative returns against other indices, particularly in small caps,1 differences in performance and factor exposures once again highlight the importance of index construction.
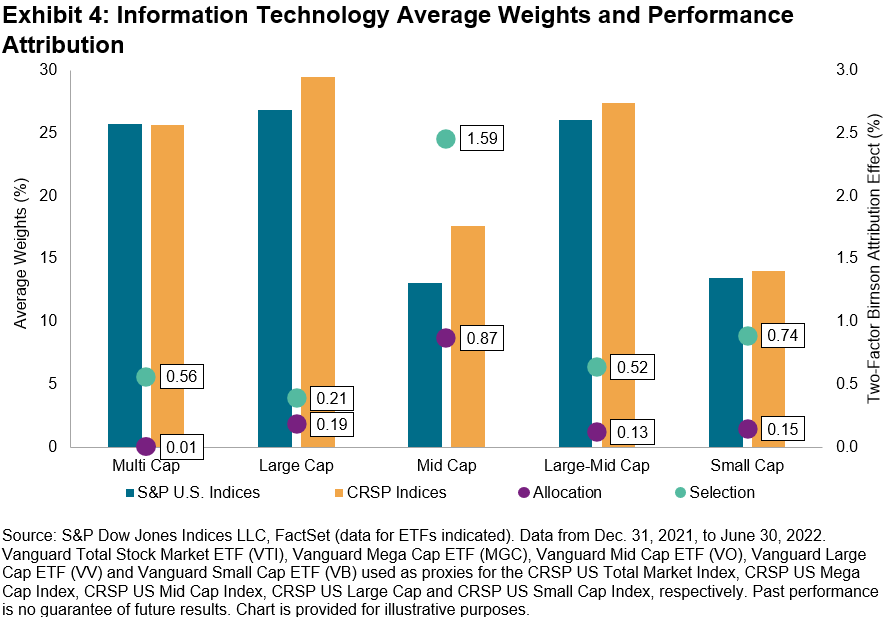
The methodology differences can also affect the indices’ sector exposures and the selection of companies within sectors. Exhibit 4 shows the 2022 average weight of each index to the IT sector as well as the allocation and selection effect specifically for the IT sector. The S&P U.S. Indices’ lower exposures to IT meant they were more insulated against the sector’s drawdowns in the first half of 2022. Interestingly, the S&P U.S. Indices’ choice of IT stocks proved more resilient than their CRSP counterparts and the selection effect was more important across the cap spectrum.
On average, the S&P DJI U.S. equity indices outperformed their CRSP counterparts by 2.0% in the first half of 2022 and 2.5% on a trailing one-year basis. These results were driven by differences in index construction, which led to the S&P U.S. Indices having meaningful exposure to the quality factor, lower exposure to the IT sector and the selection of IT companies with stronger performance.
1 See https://www.indexologyblog.com/2022/01/26/sp-smallcap-600-a-pandemic-case-study/
The posts on this blog are opinions, not advice. Please read our Disclaimers.