Get Indexology® Blog updates via email.

In This List

Dividend Growers in Inflationary Environments

S&P U.S. Indices Mid-Year 2022: Analyzing Relative Returns to CRSP

What’s Inside the Real Estate Select Sector?

Defensive Dynamics

The S&P Systematic Global Macro Index Outperformed YTD

Dividend Growers in Inflationary Environments

Contributor Image
George Valantasis

Associate Director, Factors and Dividends

S&P Dow Jones Indices

With inflation being a major issue in the current economy, consumers are increasingly looking for ways to combat their loss of purchasing power. One way to achieve this is to have sources of income that keep pace with, or even exceed, the inflation rate. Over the past four decades, dividends have played an increasing role as a source of income, growing from just 2.88% of all income in December 1981 to 6.25% of all income in March 2022.1

During inflationary periods, history has shown the importance of focusing on companies that have consistently increased dividends. A company’s ability to consistently increase dividends may signal a quality company that is able to continually generate increasing cash flows as well as high returns on capital.

Dividend Growers Methodology

In this blog, we will focus on the S&P U.S. Dividend Growers Index and S&P Global ex-U.S. Dividend Growers Index, which provide exposure to companies that have consecutively increased dividends for 10 and 7 years, respectively. In addition to the dividend policy filter, the top 25% of stocks ranked by indicated annual dividend yield are also excluded from these indices. This diminishes the risk of owning “yield traps,” or companies that have high dividend yields simply due to large stock price declines.

Dividend Growth Rate Outpaces the Inflation Rate over the Long Term

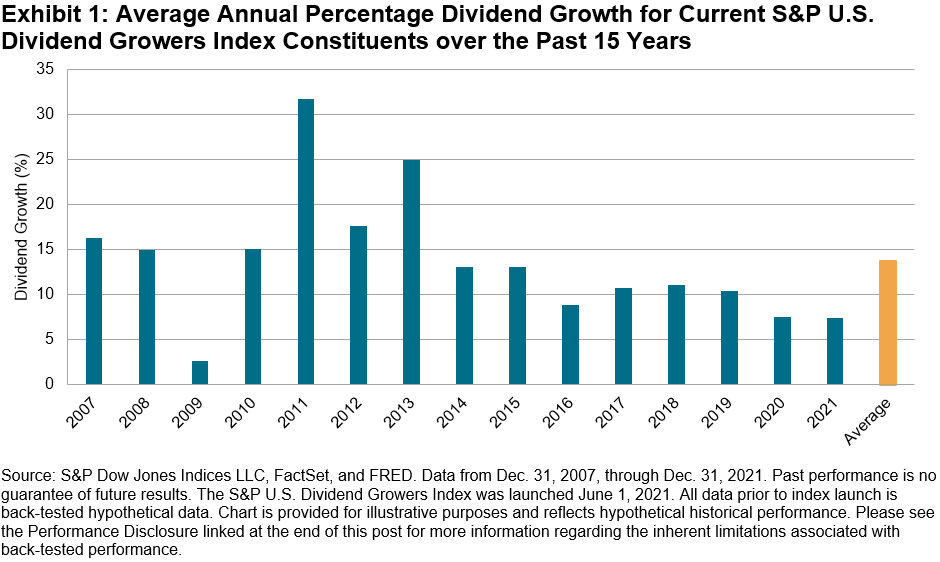
Exhibit 1 shows the average year-over-year annual percentage dividend growth rate for current S&P U.S. Dividend Growers Index constituents. The average year-over-year dividend growth rate over the past 15 years was 13.71%, surpassing the average year-over-year U.S. CPI rate of 2.21% over the same period.

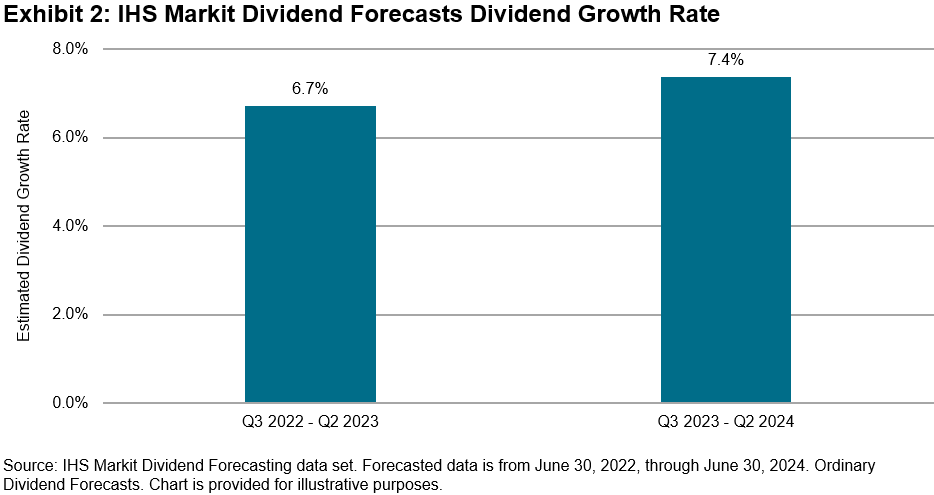
IHS Markit Forecasted Dividend Growth Rate

Exhibit 2 shows the year-over-year forecasted dividend growth rate for current S&P U.S. Dividend Growers Index constituents using the IHS Markit Dividend Forecasting data set.2 S&P Global’s Dividend Forecasting team provides discrete forecasts of the size and timing of dividend payments for over 30,000 stocks worldwide. Forecasts for stocks in the core Dividend Forecasting universe are generated by analysts using fundamental research, market announcements and unique quantitative insight. Over the next four quarters, forecasted dividend growth is expected to remain robust, at 6.7% year-over-year. The forecasted growth rate for the following four quarters (Q3 2023 to Q2 2024) is 7.4% year-over-year.

Performance During Inflationary Periods

Exhibit 3 displays the outperformance of the S&P Dividend Growers Indices versus their respective benchmarks in periods when the year-over-year CPI rate exceeded 3% for at least six consecutive months. Both S&P Dividend Growers Indices significantly outperformed their benchmarks in the three most severe inflationary periods dating back to 2006.

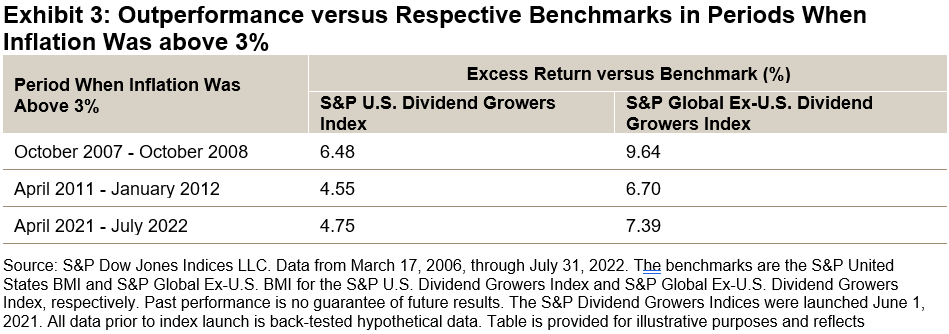
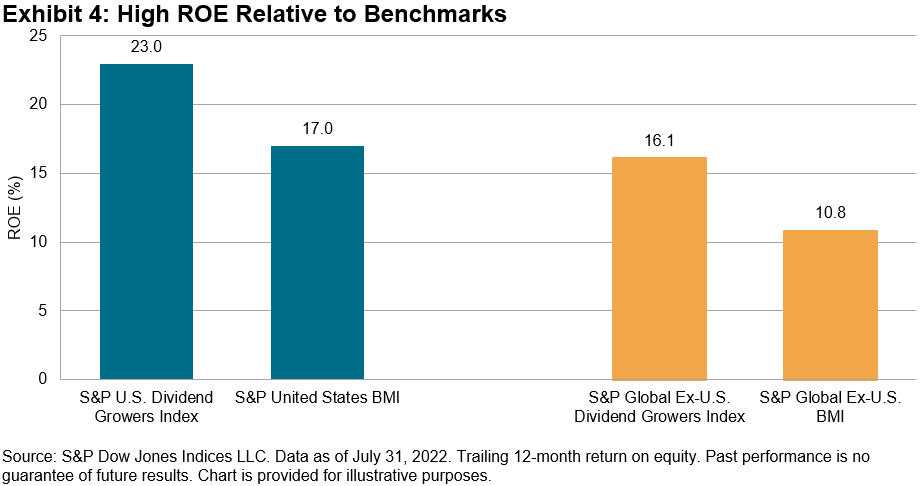
Exhibit 4 shows the trailing 12-month return on equity (ROE) for both S&P Dividend Growers Indices versus their respective benchmarks. The outperformance of the S&P Dividend Growers Indices during inflationary periods may be due to their substantially higher ROE. This is significant because companies that earn low returns on their capital can lose value in real terms, when the capital they invest earns a lower return than the inflation rate.

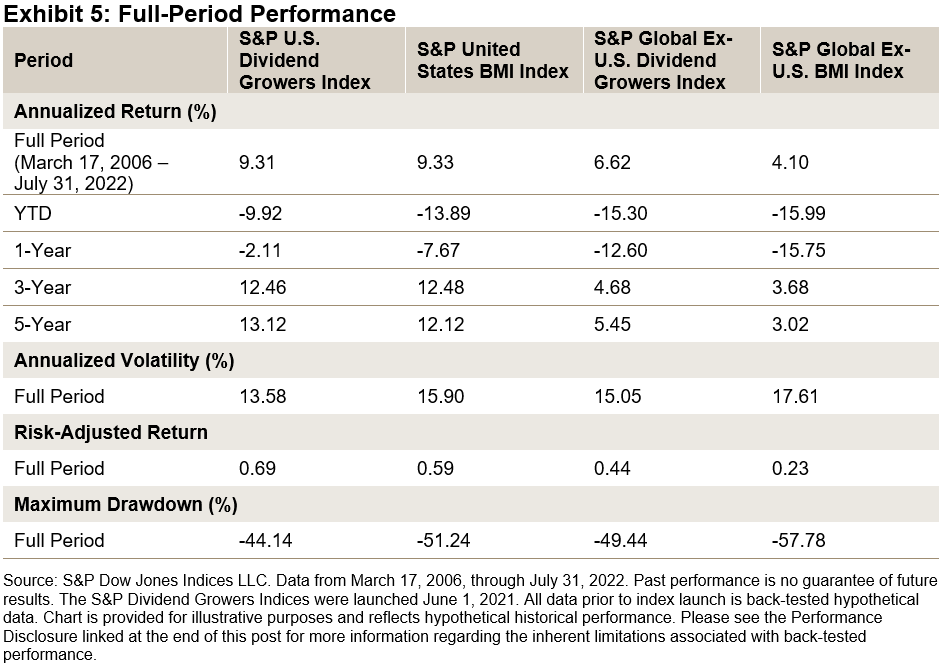
Full-Period Performance

Exhibit 5 details the full-period performance comparison. Both S&P Dividend Growers Indices generated superior full-period risk-adjusted returns versus their benchmarks. Importantly, the S&P Dividend Growers Indices outperformed their benchmarks YTD as well as over the past year.

The S&P Dividend Growers Indices have historically outperformed their benchmarks on a risk-adjusted basis. Notably, they have significantly outperformed in recent inflationary periods, possibly due to their high-quality characteristics. Hence, the S&P Dividend Growers Indices may be a good option to consider if current inflation trends continue.

1 Source: Bureau of Economic Analysis. Data as of March 31, 2022.

2 See https://cdn.ihsmarkit.com/www/pdf/0822/IHS_Markit_Dividend_Forecasting_Methodology.pdf

The posts on this blog are opinions, not advice. Please read our Disclaimers.

S&P U.S. Indices Mid-Year 2022: Analyzing Relative Returns to CRSP

Contributor Image
Cristopher Anguiano

Senior Analyst, U.S. Equity Indices

S&P Dow Jones Indices

The first half of 2022 saw supply chain disruptions, interest rate hikes amid rising inflation and geopolitical tensions sour sentiment, creating a complex environment for equity markets. The S&P 500® was down 20%, which represented the worst start of the year since 1970. What was the impact on other S&P DJI U.S. equity indices and their competitors? In this blog, we analyze and compare the mid-year absolute and relative performance of various S&P DJI U.S. equity indices and CRSP equity indices designed to represent similar segments.

The S&P Composite 1500® is designed to measure the performance of U.S. equities across the size spectrum by combining the S&P 500, S&P MidCap 400® and the S&P SmallCap 600® in float-market cap proportions. But the S&P 1500® is not alone in seeking to measure the U.S. equity market; the CRSP US Total Market Index has a similar objective.

Exhibit 1 shows that the S&P 1500 outperformed the CRSP Total Stock Market Index over various horizons. The S&P 1500’s outperformance typically came from across the cap spectrum: the S&P 500, S&P 400® and S&P 600® outperformed their respective CRSP counterparts in several periods, mainly on a YTD and 1-year basis.

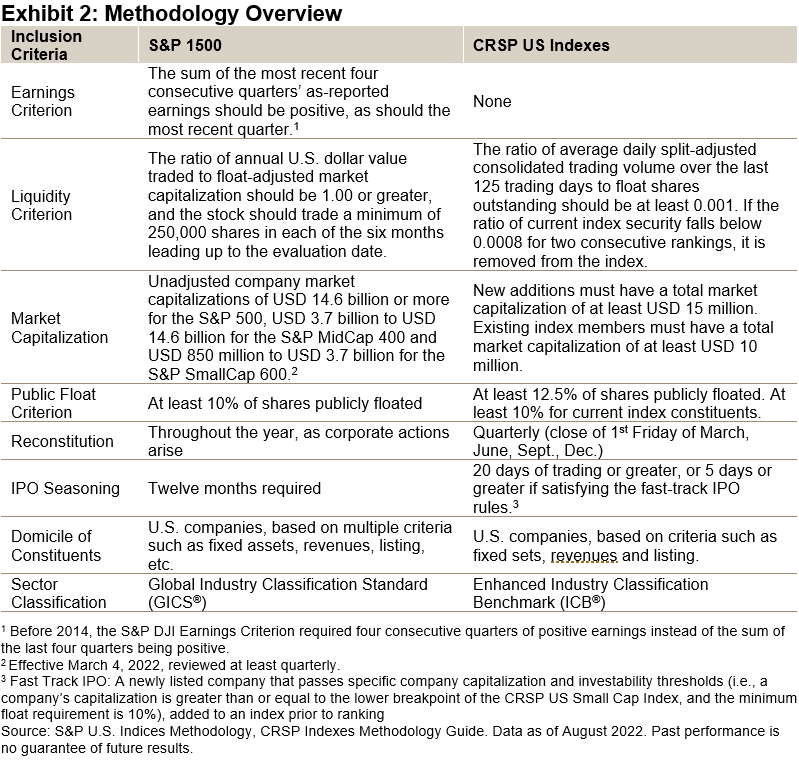
Differences in index construction can help us to understand these performance differentials. Exhibit 2 summarizes the methodologies underlying the S&P DJI U.S. equity indices and their CRSP counterparts. One of the biggest differences between the methodologies is that, unlike the CRSP indices, the S&P 1500 and its component indices use an earning screen: new index additions must have a history of positive earnings.

Exhibit 3 shows the impact of the earnings screen on the S&P Composite 1500’s and S&P SmallCap 600’s factor exposures: each S&P DJI U.S. equity index has statistically significant positive quality exposure. Similar results can be obtained for other market cap segments. Given the role of the quality factor in driving relative returns against other indices, particularly in small caps,1 differences in performance and factor exposures once again highlight the importance of index construction.

The methodology differences can also affect the indices’ sector exposures and the selection of companies within sectors. Exhibit 4 shows the 2022 average weight of each index to the IT sector as well as the allocation and selection effect specifically for the IT sector. The S&P U.S. Indices’ lower exposures to IT meant they were more insulated against the sector’s drawdowns in the first half of 2022. Interestingly, the S&P U.S. Indices’ choice of IT stocks proved more resilient than their CRSP counterparts and the selection effect was more important across the cap spectrum.

On average, the S&P DJI U.S. equity indices outperformed their CRSP counterparts by 2.0% in the first half of 2022 and 2.5% on a trailing one-year basis. These results were driven by differences in index construction, which led to the S&P U.S. Indices having meaningful exposure to the quality factor, lower exposure to the IT sector and the selection of IT companies with stronger performance.

1 See https://www.indexologyblog.com/2022/01/26/sp-smallcap-600-a-pandemic-case-study/


The posts on this blog are opinions, not advice. Please read our Disclaimers.

What’s Inside the Real Estate Select Sector?

Explore how a rules-based approach to tracking real estate companies in the S&P 500® impacts dividend yield and diversification.

The posts on this blog are opinions, not advice. Please read our Disclaimers.

Defensive Dynamics

Contributor Image
Anu Ganti

U.S. Head of Index Investment Strategy

S&P Dow Jones Indices

2022 has been a tumultuous year characterized by reversals, with the S&P 500® down 20% in the first six months of the year and rebounding by 9% in July. In this uncertain environment, seeking defensive exposures via sectors could mitigate portfolio risk, but a nuanced perspective may be required to understand which sectors offer the best defense.

As Exhibit 1 illustrates, over the past 12 months, Energy was not only the most volatile sector, but was also the most positive contributor to the S&P 500’s performance. Meanwhile, Information Technology, the largest of the S&P 500 sectors by weight, was a key detractor to the S&P 500’s performance and the third most volatile sector.

The impact of the Energy and IT sectors is particularly interesting to analyze due to the sectors’ different diversification properties. In Exhibit 2, we calculate the spread in trailing 12-month volatility between the S&P 500 versus S&P 500 Ex-Energy and the S&P 500 Ex-Information Technology, respectively. When this spread is positive, the inclusion of the sector increases volatility in the benchmark; when negative, the sector acts as a diversifier. Note the negative spread for Energy and positive spread for IT, over the most recent 12-month observation.

Digging deeper, Exhibit 3 plots the trailing 12-month correlations of the Energy and Information Technology sectors, respectively, with the S&P 500 excluding that sector. Consistent with the results of Exhibit 2, the correlation between S&P 500 Energy and S&P 500 Ex-Energy has declined in recent years. In contrast, the correlation between S&P 500 Information Technology and S&P 500 Ex-Information Technology, which has historically been positive, has increased recently. In other words, Energy’s performance has increasingly been divergent from the rest of the market’s, while IT’s performance has increasingly mirrored the remainder of the market.

While we can conclude that Energy has recently been acting as a defensive sector by mitigating market volatility and Information Technology as a cyclical play via risk enhancement, this hasn’t always been the case. For example, in 2008, during the depths of the financial crisis, these two sectors acted very differently, as adding Energy significantly increased market volatility, while adding IT decreased overall market volatility. In contrast, following the burst of the tech bubble in 2001, IT added substantially to market risk. Understanding that sectors’ defensive characteristics change over time is key to alleviating risk via sector allocation.


The posts on this blog are opinions, not advice. Please read our Disclaimers.

The S&P Systematic Global Macro Index Outperformed YTD

Contributor Image
Berlinda Liu

Former Director, Multi-Asset Indices

S&P Dow Jones Indices

U.S. equities rebounded in July thanks to earnings from mega-cap technology and major oil companies. The S&P 500® surged 9.2%, posting its best month since November 2020 and reversing its 8.3% loss in June. Nevertheless, the S&P 500 remains in correction territory, down 13.1% from its Jan. 3, 2022, record high.

The S&P Systematic Global Macro Index (SGMI) has outperformed the equity market YTD. While the S&P 500 was down 12.6% YTD, the multi-asset trend following index rose 17.4%, similar to the average returns of commodity trading advisors (CTAs) as measured by the SG CTA Total Return Index. In the 12-month period, the SGMI outperformed the broad equity benchmark and the CTA index (see Exhibit 1).

The SGMI is designed to measure a trend-following strategy that takes a long, short or zero position in 37 constituents across six sectors (equities, fixed income, short-term interest rate, foreign exchange, commodities and energy). The trend signal for each constituent is evaluated and established individually via regression. Sectors and constituents are weighted so that they contribute equally to the index risk. The index uses leverage to achieve its 17.5% target volatility.

The SGMI is rebalanced monthly. Comparing its allocation in early August with that at the end of July, we can see the index is shifting from commodities to equities (see Exhibit 2). This is not surprising as it is designed to capture and respond to the latest trend in the market. The index continues to short government bonds but has scaled back the size of these short positions.

It remains unclear whether the market has completely shaken off concerns over inflation and rising rates. The S&P SGMI may help market participants seeking to ride market trends via a diversified multi-asset approach.

The posts on this blog are opinions, not advice. Please read our Disclaimers.