Get Indexology® Blog updates via email.

In This List

A Risk Control Approach to Cryptocurrencies: A Tool for a Crypto Winter

Commodities: Inflation, Interest Rates and the U.S. Dollar

S&P Global Commodity Insight’s Mining Data Lays Foundation for the S&P Global Core Battery Metals Index

The S&P China 500 Added 2.8% in Q2 2022, as China Equities Held up During a Broad Global Sell-Off

Compliance versus Voluntary Carbon Markets

A Risk Control Approach to Cryptocurrencies: A Tool for a Crypto Winter

Contributor Image
Sharon Liebowitz

Former Head of Innovation

S&P Dow Jones Indices

Earlier this year, we reported on the volatility of Bitcoin and cryptocurrencies overall. In February 2022, the market was slightly down from its all-time high in November 2021. S&P Dow Jones Indices had just launched the new S&P Bitcoin and Ethereum Dynamically Rebalancing Risk Control 40% Indices (CET Close), and we saw that risk-adjusted performance over time of the Bitcoin risk control index exceeded that of the underlying S&P Bitcoin Index.

Since then, the crypto market has experienced a significant downturn, while equities officially entered a bear market. For crypto, the collapse of Terra and its sister coin Luna,1 the halt of withdrawals from the Celsius network2 and the contagion to other firms such as crypto hedge fund Three Arrows Capital and crypto lender Babel3 created difficult conditions in the second half of the Q2.

Why not review how the crypto risk control indices performed through this time period and see how they met the index methodology goals of mitigating volatility?

Exhibits 1 and 2 show the performance for the S&P Bitcoin and S&P Ethereum Dynamically Rebalancing Risk Control 40% Indices and their underlying benchmark indices.

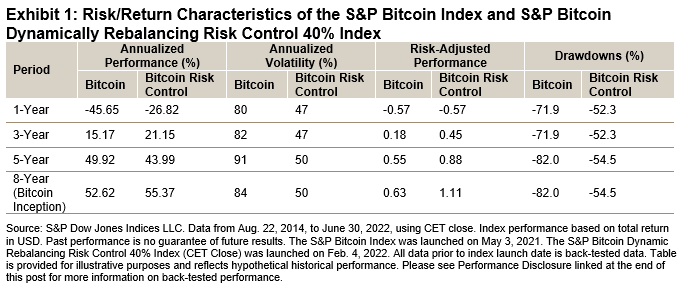
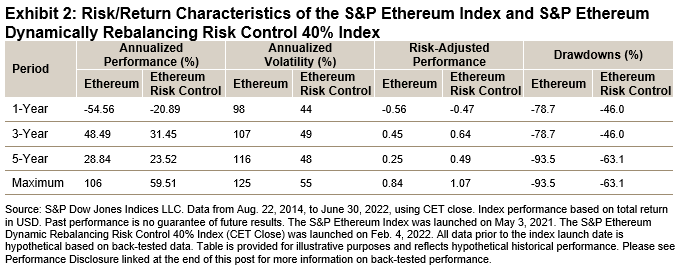
Specifically, for the Bitcoin risk control index, during the June market drop, the rebalance was triggered three times. The rebalance adjusts the exposure to the underlying index and allocates to U.S. dollars on any given day when the 10% threshold based on exposure is crossed. While the benchmark S&P Bitcoin Index was down 40% in June, the S&P Bitcoin Dynamically Rebalancing Risk Control 40% Index was down just 21%. This demonstrates how responsive the dynamic nature of the risk control index is to the current market conditions, and the methodology mitigated the effects of volatile, declining markets.

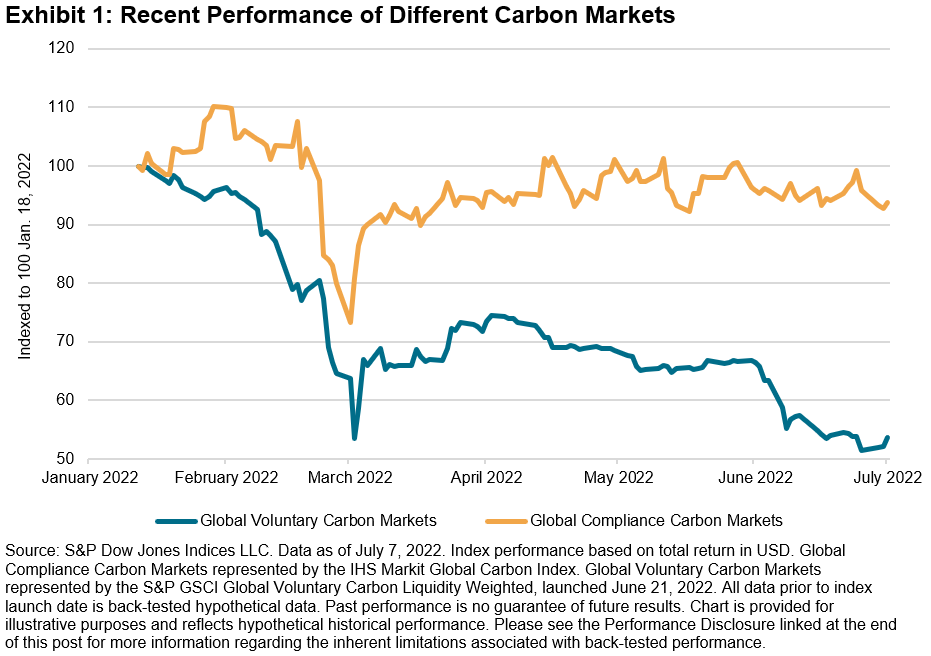
However, not all is gloom and doom in the crypto space. It is worth noting that the S&P Bitcoin Index was up 15% in the first week of July (as of July 7, 2022), and the S&P Bitcoin Dynamically Rebalancing Risk Control 40% Index was up 4% during this period. As expected with this asset class, volatility continues, and risk control can help mitigate it.


For additional details, please refer to the S&P Risk Control Indices Methodology & Parameters for current parameters and to the S&P Risk Control Indices section of the S&P DJI Index Mathematics Methodology.

For S&P DJI, this is another innovative way to bring tools and transparency to this emerging asset class.


1 https://www.coindesk.com/learn/the-fall-of-terra-a-timeline-of-the-meteoric-rise-and-crash-of-ust-and-luna/

2 https://www.coindesk.com/business/2022/06/15/celsius-troubles-ust-collapse-could-have-long-term-benefits-for-crypto-fsinsight-says/

3 https://www.coindesk.com/layer2/2022/06/29/why-the-crypto-unwind-wasnt-contagious-this-time/; https://www.coindesk.com/business/2022/07/01/troubled-crypto-lender-babel-finance-looking-to-hire-restructuring-specialist-houlihan-lokey-sources/

The posts on this blog are opinions, not advice. Please read our Disclaimers.

Commodities: Inflation, Interest Rates and the U.S. Dollar

Contributor Image
Jim Wiederhold

Former Director, Commodities and Real Assets

S&P Dow Jones Indices

After last week’s highest inflation print in over four decades, the U.S. dollar (USD) rose to its strongest level in 20 years, as measured against a broad basket of currencies. The euro also hit parity with the USD for the first time since 2002 as a consequence of Europe’s front-line exposure to the Russia-Ukraine conflict and the perception that the European Central Bank has been slow to raise interest rates. Most major commodities included in the headline commodity benchmark, the S&P GSCI, are still showing positive gains YTD, even with the global recession fears permeating market sentiment. Some traditional inflation hedging assets are not performing as expected, with negative YTD performance for real estate, gold, and U.S. Treasury Inflation Protected Securities (TIPS) (see Exhibit 1), but commodities have recently been offering inflation protection amicably.

Commodities’ outperformance can be explained by the energy sector commodities. The worst-performing energy constituent within the S&P GSCI, S&P GSCI Crude Oil, was up 41.36% YTD. While gasoline prices have been getting the headlines in the U.S., gasoil, heating oil and natural gas were all up nearly 100% in 2022. A cooling off of these energy commodities could be a leading indication for cooling of inflation in the near term.

USD strength has traditionally been a headwind for commodities. Most major commodities around the world are priced in USD, so when the currency strengthens, buying commodities becomes more expensive in non-USD currencies. As one strengthens, the other weakens. But this has not been the case recently, and there are previous periods in history where this relationship has faltered (see Exhibit 2). In this case, commodities moved first, and the USD strength has been more recent in response to an abrupt switch in global monetary policy aimed at cooling inflation. Something will have to give soon if this unusual situation based on history continues in the short run. If inflation finally starts to ease, it’s possible the U.S. Federal Reserve might ease up on its rate hiking regime, thereby cooling off the red-hot USD.

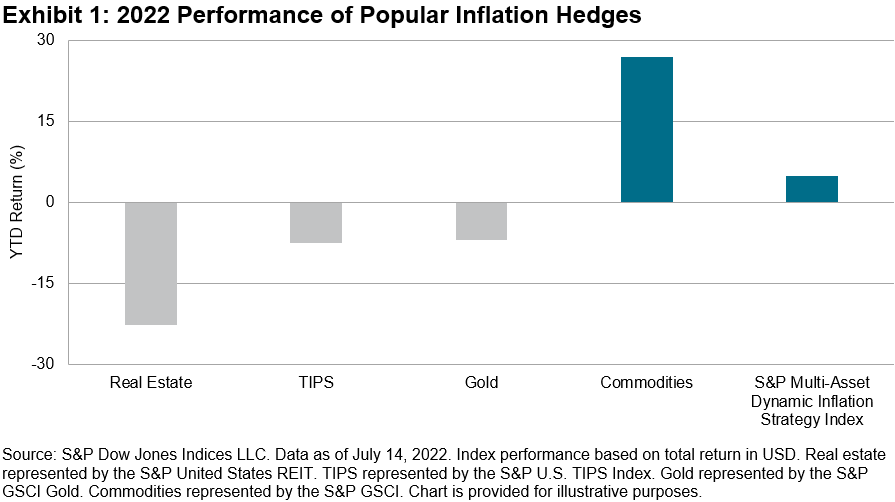
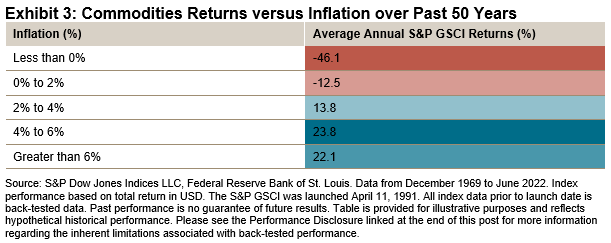
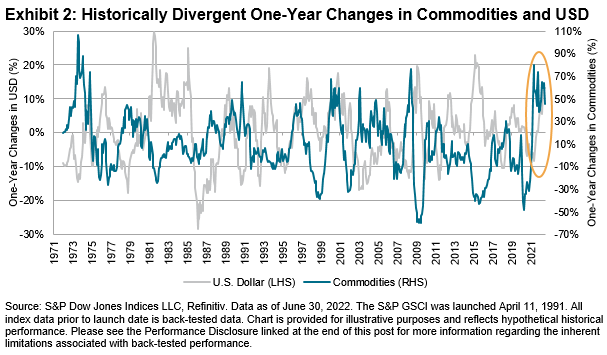
Where does this leave us in the current environment compared to similar situations historically? During two similar periods where skyrocketing inflation was met with interest rate tightening (in the 1980s and 2000s), commodities still tended to outperform, although eventually the high cost of goods caused the U.S. consumer to suffer and recessions to ensue. Commodities have posted double-digit percentage gains during high inflationary regimes, as can be seen in Exhibit 3. Allocating aggressively to commodities and away from equities during these times has tended to produce favorable risk-adjusted returns, as can be seen by our S&P Multi-Asset Dynamic Inflation Strategy Index, with a 6.4% gain YTD. For more information on this index, please read our prior blog.

Commodities have been known as an inflation hedging asset mostly because they are raw materials that go into the production of the goods that tend to rise in lockstep with inflation. Much of the recent strength in commodities prices can be attributed to supply shocks, including the Russia-Ukraine conflict and post-COVID-19 supply chain disruptions. Longer term, there are additional supply constraints imposed by the energy transition. Interest rates are a blunt monetary instrument and can do little to directly address these supply constraints, but they can slow demand. Similarly, USD strength may eventually hamper commodity demand from non-U.S. consumers.

The posts on this blog are opinions, not advice. Please read our Disclaimers.

S&P Global Commodity Insight’s Mining Data Lays Foundation for the S&P Global Core Battery Metals Index

Contributor Image
Ben Cook

Associate Director, Metals & Mining Product Management

S&P Global Commodity Insights

As mentioned in a previous post, S&P Dow Jones Indices (S&P DJI) partnered with S&P Global Commodity Insights (S&P GCI) to leverage its over 30 years of industry-leading Metals & Mining data and expertise in order to launch the S&P Global Core Battery Metals Index. As the index seeks to identify the key players in the upstream battery metals supply market, S&P GCI is proud to be a contributor of back-end data and industry expertise.

Hosted on the S&P Capital IQ Pro platform by S&P Global Market Intelligence, the detailed asset and company-level data coverage, combined with deep industry research and analysis, provides a comprehensive view of the mining sector worldwide. The Metals & Mining solution covers worldwide exploration, discoveries, development, production, mine cost analysis, acquisitions activity and commodity market forecasts and analysis, and it connects its customers to global opportunities on a single platform (see Exhibit 1).

An Asset-Level Approach to Company Production

A key input that drives the S&P Global Core Battery Metals Index is company production and its derived production value for core battery metals—nickel, cobalt and lithium.

A company’s commodity production plays a central role when benchmarking mining companies’ standing, as well as understanding the upstream supply affecting global commodity markets. For the manufacturing of downstream battery-related products, such as electric vehicles, understanding the mined output/supply of the core battery commodities is crucial, and that all begins with the output at the mine level (see Exhibit 2).

S&P GCI aggregates (or sums) asset-level production data up to the company level, based on the equity ownership stake in each property, and both ownership and production data sets are sourced primarily from public company filings. Also, standardization is applied to adjust production into a single unit of measurement per commodity and a single 12-month period ending in December of each year.

With S&P DJI’s core expertise in licensing indices to more than 550 financial institutions worldwide and S&P GCI’s strong offerings across the commodities sector, the formation of the S&P Global Core Battery Metals Index is a natural partnership between the two divisions to accelerate progress in the energy transition via battery metals.

If you are interested in learning more about the data that fuels the index, please don’t hesitate to contact S&P GCI. Keep an eye out for a future blog that will further delve into the index’s methodology and provide an overview of historic performance.

The posts on this blog are opinions, not advice. Please read our Disclaimers.

The S&P China 500 Added 2.8% in Q2 2022, as China Equities Held up During a Broad Global Sell-Off

Contributor Image
Sean Freer

Director, Global Equity Indices

S&P Dow Jones Indices

The S&P China 500 bucked the trend of a broad market downturn, posting a 2.8% gain for Q2 2022. In terms of sectors, Consumer Discretionary and Consumer Staples grew nearly 15% each over the quarter, while the Industrials and Energy sectors were also additive to performance. The S&P China 500 outperformed the broader S&P Emerging BMI and S&P Developed BMI, which declined 10.3% and 16.3%, respectively.

The index also outperformed regional benchmarks and was the only Asian market to post a positive quarterly return. The S&P Hong Kong BMI was the next-best Asian market, declining 1.1%, while most other Asian markets posted double-digit declines, with the S&P Korea BMI, S&P Taiwan BMI and S&P India BMI receding by 21.4%, 18.5% and 13.6%, respectively.

Despite the recent weakness in the market, the S&P China 500 has maintained strength over the long term. With an annualized gain of 7.8% in USD terms over the past 10 years, the index has easily outperformed the S&P Emerging BMI, which only gained 4.1% over the same period.

Both Onshore and Offshore Stocks Contributed

Both domestic China A-shares, as well as offshore listed China equities, delivered positive returns during the quarter. The first half of 2022 saw much less dispersion of returns among offshore and onshore Chinese equities compared to 2021, when onshore stocks outperformed offshore listings by more than 30%. Due to its diversified composition across all Chinese share classes and sectors, the S&P China 500 posted performance in the middle of most major China equity benchmarks.

Consumer Discretionary and Consumer Staples Recouped Some of Their Q1 Losses

Consumer Discretionary and Consumer Staples companies outperformed in Q2, returning 14.9% and 14.6%, respectively, and reversing some of their losses from Q1. These two sectors collectively make up just over a quarter of the S&P China 500 and helped drive a positive return for the index for the quarter. Industrials also contributed to performance, returning 4.0%, while Information Technology held up at 0.4% following its Q1 sell-off.

Among the most significant contributors to the index return were alcohol producer Kweichow Moutai in the Consumer Staples sector, up 12.7%, shopping platform Meituan in the Consumer Discretionary sector, which reversed a poor Q1 and returned 24.6%, and Wuliangye Yibin, another beverage company, which returned 23.4%.

Within the Communication Services sector, technology and entertainment conglomerate Tencent was a key detractor mainly due to its size as the top index constituent, decreasing 5.5%. China Merchants Bank (within Financials) and Zijin Mining Group (in Materials) were also key detractors from the index return, declining 14.6% and 22.0%, respectively.

Price Declines Led to More Favorable Valuation Metrics

The S&P China 500’s trailing P/E ratio ticked up to 15.5x in Q2 (compared with 14.2x in Q1), reverting above the 10-year average. Meanwhile, the rolling one-, three- and five-year P/E ratios remained somewhat elevated compared to the longer-term average.

The trailing P/E for the broad-based S&P Emerging BMI edged lower (13.1x) as share price declines were broad across ex-China emerging regions. Meanwhile, the S&P China 500’s dividend yield increased from 1.98% to 2.03% on a quarterly basis.

The posts on this blog are opinions, not advice. Please read our Disclaimers.

Compliance versus Voluntary Carbon Markets

Contributor Image
Jim Wiederhold

Former Director, Commodities and Real Assets

S&P Dow Jones Indices

After the launch of S&P GSCI Global Voluntary Carbon Liquidity Weighted, the first-to-market benchmark that seeks to track the current performance of global voluntary carbon futures markets, we thought it would be wise to go into further detail regarding the two main types of carbon commodity markets. These two markets are similar in that the most basic underlying component is one ton of carbon dioxide equivalent, but diving deeper, these two markets are strikingly different. The first significant difference is the price performance and history (see Exhibit 1). The much more established compliance markets have a number of years of available history, while the voluntary carbon markets are some of the newest commodity markets, with some contracts having only one year or less of trading history.

The carbon futures markets offer new alternative investment vehicles with robust potential interest across many different market participants. Physical carbon spot markets allow for direct carbon offsetting, while the development of futures markets encourages financial market participants to enter, increasing liquidity. Within the compliance carbon markets space, the Intercontinental Exchange (ICE) has been at the forefront, while the CME has led the charge in voluntary carbon markets. Recent news of exchanges, particularly in Asia, looking to enter or expand offerings in the carbon markets will likely enhance these new commodities’ price discovery and liquidity. Hong Kong Exchanges and Clearing (HKEX) was the latest to target voluntary carbon market trading, while Singapore Exchange backed a new carbon-focused trading venue.

What exactly are the differences between the two main types of carbon markets? Voluntary carbon markets differ from government-mandated compliance markets in several ways. Exhibit 2 breaks down the differences between both types of carbon markets. One main takeaway is that voluntary carbon markets are not fungible or interchangeable. Every individual project underlying the offset is unique, requiring the verification and validation mechanism. Compliance markets, which are much more established, simply permit an entity to emit 1 ton of CO2 equivalent and tend to be geographically based.

Carbon markets are a crucial piece of the energy transition puzzle needed to lessen the global economy’s reliance on fossil fuels to combat climate change. Many corporations and governments are stepping up to the challenge and reiterating their support for this colossal global effort to lessen the future catastrophic effects of climate change. The world will likely rely on carbon markets for efficiency and transparency in order to save the planet. These carbon markets are nascent and will surely grow as the world evolves. S&P Dow Jones Indices will be there to offer indices like the recent S&P GSCI Global Voluntary Carbon Liquidity Weighted to ensure benchmarks are available and designed to evolve as the market evolves. With the ability to add futures contracts from new exchanges and new offerings from current exchange partners, SPDJI is uniquely positioned to be the world leader in carbon markets. For more information, visit our Commodities Investment Theme Page and check out our sister company’s, S&P Global Commodity Insights, Energy Transition Resources.

The posts on this blog are opinions, not advice. Please read our Disclaimers.