Get Indexology® Blog updates via email.

In This List

Connecting Climate Goals with Relative Index Returns

Patience Is a Virtue

Tracking Australia's Growing Agribusiness Sector

Tumultuous Trends

Putting the Pedal to the Metal: The S&P Global Core Battery Metals Index

Connecting Climate Goals with Relative Index Returns

Contributor Image
Maya Beyhan

Senior Director, ESG Specialist, Index Investment Strategy

S&P Dow Jones Indices

The widespread global adoption of ESG and climate indices has created an accompanying need for better understanding regarding the performance impact of the various choices made in their design. As introduced in S&P DJI’s new Climate & ESG Index Dashboard, a Brinson-like “carbon attribution” teases out one particularly important source of returns.

Untangling the exact impact of individual goals on ESG and climate index returns can be a challenge, as sophisticated indices can incorporate a range of objectives. For example, the S&P PACTTM Indices (S&P Paris-Aligned & Climate Indices) includes explicit carbon-reduction targets, temperature alignment goals and climate objectives such as mitigation and adaption, while an optimization process is used to target these multiple objectives simultaneously.1 This can make the individual contributions hard to unpack.2

Conveniently, the impact of weighting to higher- or lower-carbon-emitting stocks may be assessed analogously to the way sector or country effects are measured by a Brinson attribution.3 To do so, first, we rank each benchmark security according to their weighted average carbon intensity (WACI),4 and then slice up the underlying benchmark universe into five quintile portfolios, from highest to lowest, each with an equal number of benchmark constituents. Then, for any index based on the same benchmark universe, we can simply apply the standard Brinson methodology (using the performance of our hypothetical carbon portfolios instead of the traditional sector or country portfolios) to measure the allocation effects of over- or underweighting each carbon quintile.

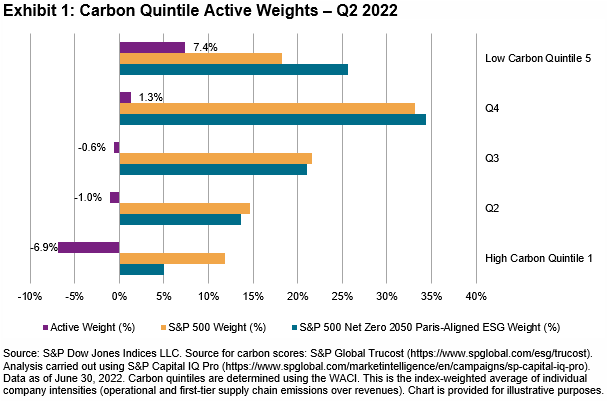
The S&P 500®-based S&P 500 Net Zero 2050 Paris-Aligned ESG Index offers a case study. Exhibit 1 shows the weights of the index and its underlying benchmark, as well as the active weight of the index, in each S&P 500 carbon quintile as of June 30, 2022.

The results of the subsequent return attribution by carbon quintile portfolio—as measured over the prior three months—are shown in Exhibit 2.

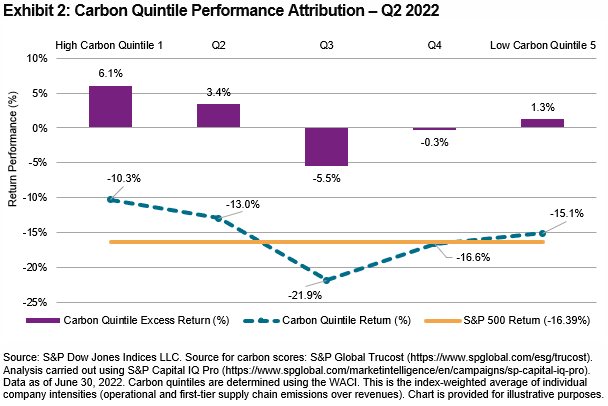
Together, Exhibits 1 and 2 measure the extent and impact of carbon-based weights over the period: the High Carbon Quintile 1 outperformed the S&P 500 by 6.1% (see Exhibit 2), and the S&P 500 Net Zero 2050 Paris Aligned ESG Index underweighted this carbon quintile by -6.9% (see Exhibit 1), which detracted from the relative index performance. Conversely, the overweight in the Low Carbon Quintile 5 contributed positively to the relative index performance.

Repeating and cumulating such analysis over multiple periods offers a longer-term perspective, as shown in Exhibit 3 for the five-year period ending in June 2022. Over this longer-term period, an underweight in the High Carbon Quintile 1, and an overweight in the second-least carbon intensive quintile, contributed the most to the index’s overall outperformance.

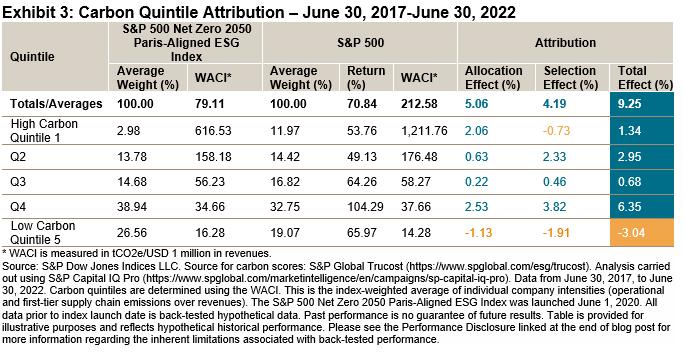
By quantifying the links between index design choices and index performance, a carbon-based attribution analysis such as that in Exhibit 3 can offer insight and perspective that may prove useful in assessing the merits of one index over another. Investors seeking similar attributions for a range of our flagship indices are now able to find them in S&P DJI’s newly launched Climate & ESG Index Dashboard.

Register here to receive quarterly insights and performance attributions for our range of flagship ESG and climate indices.


1 For more details, see the full index methodology, available at www.spglobal.com/spdji/en/documents/methodologies/methodology-sp-paris-aligned-climate-transition-pact-indices.pdf

2 www.ssga.com/content/dam/ssmp/library-content/pdfs/insights/reducing-carbon-in-equity-portfolios.pdf

3 https://jpm.pm-research.com/content/11/3/73; https://www.jstor.org/stable/4478947

4 https://www.spglobal.com/spdji/en/documents/additional-material/faq-sp-paris-aligned-climate-transition-indices.pdf

The posts on this blog are opinions, not advice. Please read our Disclaimers.

Patience Is a Virtue

Contributor Image
Craig Lazzara

Former Managing Director, Index Investment Strategy

S&P Dow Jones Indices

With the first half of 2022 in the books, commentators have noted that this year’s -20.0% total return for the S&P 500® is the worst January-June result in more than 50 years. Painful as the first six months were, what might they tell us about the rest of the year?
History gives us both bad news and good news. Bad news first: the correlation between the past six months’ return and the next six months’ return is vanishingly small. Predictions are problematic. Exhibit 1 illustrates this for the S&P 500; results for the S&P MidCap 400® and S&P SmallCap 600® are comparable. (The data here encompass not just the first six months of the year, but every six-month period from 1995 onward.)

In general, knowing how well or poorly an index did in the past six months tells you nothing about how well or poorly it will do over the next six months.

But…with a little legerdemain, we can tease out some good news as well. The fact that returns have been above average, or below average, does not help us forecast what returns will be going forward. This means that regardless of what has already happened, the next six months’ return is best regarded as a random draw from the same distribution that generated the last six months’ return.

We can use this insight by sorting the data points in Exhibit 1 into deciles based on the last six months’ performance. Within each decile, we can measure the average monthly performance in the last six months and the next six months. The difference between the next six months and the last six months represents the improvement (or worsening) of performance by decile and is graphed in Exhibit 2.

On one level, Exhibit 2 is just a demonstration of mean reversion in action. But it also has a practical implication: if historical returns have been especially good, future returns are likely to be worse, and if historical returns have been especially bad, future returns are likely to be better. At the end of June 2022, historical results across the capitalization range were indeed especially bad, as Exhibit 3 illustrates.

There are no guarantees, but history tells us that when returns are as bad as the first half of 2022’s have been, improvement has been much more frequent than continued decline. When returns have been especially bad, patience tends to be especially valuable.

The posts on this blog are opinions, not advice. Please read our Disclaimers.

Tracking Australia's Growing Agribusiness Sector

The United Nations estimates a 70% increase in food supply is needed to meet a projected 2050 global population of 9.6 billion. With 70% of its agricultural production exported today, Australia could play an integral role in meeting increased demand from the global supply chain. Join Nadine Blayney of Ausbiz, Daphne van der Oord of S&P DJI, and Ken Chapman from ASX for a closer look at how the broad S&P/ASX Agribusiness Index could help market participants track and access growth in Australia’s agribusiness sector.

Explore the Australian Market with Confidence www.spglobal.com/spdji/australia

The posts on this blog are opinions, not advice. Please read our Disclaimers.

Tumultuous Trends

Contributor Image
Anu Ganti

U.S. Head of Index Investment Strategy

S&P Dow Jones Indices

The S&P 500® posted its worst first-half performance since 1970,1 as inflation concerns, Fed rate hikes and slowing economic growth have weighed on markets. Mega caps were hit particularly hard, with the S&P 500 Top 50 posting a loss of 22%, underperforming the S&P 500 by 2%. Exhibit 1 shows that Information Technology was the biggest sectoral detractor from the S&P 500’s performance, followed by Consumer Discretionary and Communication Services. Energy was the sole positive contributor and the only sector to post a gain YTD, up 32%.

This market environment, characterized by higher volatility and wide disparity among sectoral performance, has positive implications for skillful sector allocators. To understand why, it is important to remember that volatility is linked to dispersion, which measures the spread among returns of an index’s components. When volatility goes up, dispersion also tends to rise, as the gap between the winners and losers widens. The greater the spread, the greater the opportunity to add value. Dispersion can be measured at various levels of granularity, such as among stocks or sectors.

Total market dispersion can be decomposed into the average dispersion within each sector and the dispersion across sectors. The ratio of cross-sector effects to total S&P 500 dispersion has remained above average, which implies that the rewards for skillful sector picks have been increasing (see Exhibit 2).

A natural consequence of the weakness among mega caps was a tailwind for Equal Weight because of its small-cap bias, with the index outperforming the S&P 500 by 3% so far this year. Exhibit 3’s YTD performance attribution of the S&P 500 Equal Weight Index illustrates that the underweight to IT and Communication Services were key contributors to Equal Weight’s outperformance

Another consequence of the outperformance of smaller caps is that most factor indices, which generally have a small-cap tilt, outperformed the S&P 500 (see Exhibit 4). Low Volatility and Dividend strategies took the lead, as factor performance was importantly influenced by the extraordinary outperformance of Value versus Growth.

The comeback of smaller caps and Equal Weight might have positive implications for active managers, as their portfolios are often closer to equal than cap weighted.  Exhibit 5 plots the underperformance of large-cap funds compared to the relative performance of the S&P 500 Equal Weight Index versus the S&P 500, as a proxy measure for smaller-cap outperformance. We notice that two out of the three years when most active large-cap managers outperformed (2005, 2007 and 2009) coincided with Equal Weight’s outperformance.

The current challenging environment, characterized by high inflation, concerns about potential Fed rate hikes and weak economic fundamentals, is reminiscent of 1970. That was the last time we experienced this level of underperformance for the first half of the year, which was subsequently followed by a strong turnaround in the second half of the year—an ultimate indicator that past performance is not indicative of future results. 

1 Based on S&P 500 Price Return.

The posts on this blog are opinions, not advice. Please read our Disclaimers.

Putting the Pedal to the Metal: The S&P Global Core Battery Metals Index

Contributor Image
Rupert Watts

Head of Factors and Dividends

S&P Dow Jones Indices

While electric vehicles have been attractive to environmentally conscious consumers for several decades, in recent years, they have come into their own as innovation has made them more accessible and practical. With the current prices at the pump, now more than ever, consumers are turning to electric vehicles as a greener and more economical option. As Exhibit 1 shows, sales of “plug-in” electric vehicles are expected to grow significantly through 2026. As demand for electric vehicles and other technologies strengthens, so does the need for rechargeable batteries.

Booming Battery Metals Markets

Considering the current and anticipated demand for rechargeable batteries, markets for their input commodities have been booming. For market participants seeking to participate in this trend, S&P Dow Jones Indices (S&P DJI) recently launched the S&P Global Core Battery Metals Index. The index seeks to track global companies engaged in producing and mining three core battery metals: cobalt, lithium and nickel.

Partnership with S&P Global Commodity Insights

To develop this index, S&P DJI partnered with S&P Global Commodity Insights (S&P GCI). Given their expertise in metals and mining, S&P GCI played a significant role in defining the rules of the index.

They identified cobalt, lithium and nickel as the three core battery metals that the index would track via producing companies. These metals were selected since they are typically the key metals used in active cathode materials deployed in high-performance batteries.

To accurately capture the battery metals’ production values, the index sources data from S&P GCI’s Metals and Mining dataset. Provided via the S&P Capital IQ Pro platform, this industry-leading dataset includes over 4,500 mining companies and over 37,000 mining properties.

Methodology Overview

To be eligible for inclusion, companies must be a member of the S&P Global BMI. Additionally, companies must have been a producer of either cobalt, lithium or nickel for the previous year (as measured by S&P GCI’s Metals and Mining Dataset). All eligible companies are included in the index.

Qualifying companies are weighted proportionate to their production-value-to-revenue ratio. To calculate this ratio, the sum of the production value across the three battery metals is divided by the revenue from the previous year (in USD). Constituents are then ranked in ascending order so that the companies with the highest proportion of battery metal production are given the largest rank. Each company’s final weight is calculated by its rank divided by the sum of all ranks (subject to liquidity capping). In this way, the index overweights companies where the production of these core battery metals represents a significant portion of their business.

Statistical Analysis

The first value date for the S&P Global Core Battery Metals Index was set as July 21, 2017, when enough companies were represented in the dataset. Since then, the index has earned an annualized return of 23.25%, outperforming its benchmark by almost 16.5%. Most of this outperformance was achieved in the last couple of years on the back of the booming metals markets.

Let’s now examine the country breakdown for the S&P Global Core Battery Metals Index. As one might expect, the index weighs heavily toward Australia and China, the two top-producing countries for battery raw materials. However, the index has a strong representation across over a dozen counties (see Exhibit 4).

In two subsequent blogs, we will further explore the methodological details and index characteristics. In fact, our colleagues at S&P GCI will author the next blog, focusing on the Metals and Mining dataset that the index leverages to source battery metals’ production values. Stay tuned!


The posts on this blog are opinions, not advice. Please read our Disclaimers.