Get Indexology® Blog updates via email.

In This List

S&P PACT Indices Target Sector Neutrality

Beyond Bitcoin: Increasing Accessibility through a Digital Assets Classification System

Green Pools: Evolving ESG Trading Ecosystems

Going Electric: Introducing the S&P GSCI Electric Vehicle Metals

Face-to-Face with the Metaverse

S&P PACT Indices Target Sector Neutrality

Contributor Image
Ben Leale-Green

Former Associate Director, Research & Design, ESG Indices

S&P Dow Jones Indices

Recently announced results for a consultation on the S&P PACT™ Indices (S&P Paris-Aligned & Climate Transition Indices) reveal that they will now target country and sector neutrality. This has the potential benefit of comparing companies, as much as possible, to close peers (those in the same sector and country), while reducing active risk.

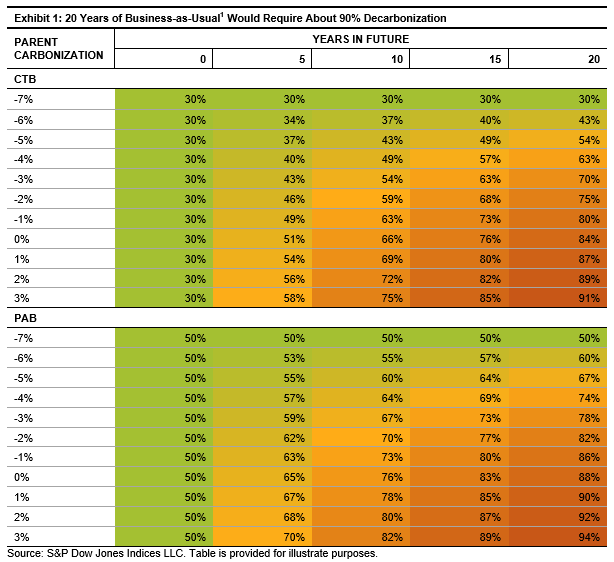
The EU’s minimum requirements for Climate Transition and Paris-aligned Benchmarks (CTB and PAB, respectively) represent a new paradigm within climate investing—an absolute decarbonization pathway, meaning that strategies may have to achieve significantly higher levels of decarbonization relative to a benchmark in the future than they do today, if the benchmark does not significantly decarbonize (see Exhibit 1).

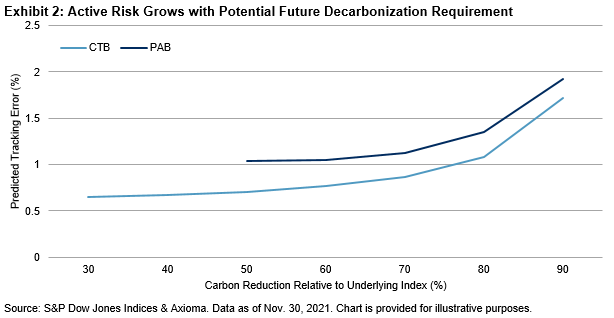
Given we do not know whether the world will decarbonize, we stress tested the methodology to understand, even when getting to a 90% decarbonization relative to the underlying universe, whether the S&P PACT Indices can meet the index objective. We see the index methodology finds a solution, becoming more active as the decarbonization grows, as expected, but remaining relatively benchmark like (see Exhibit 2).2

As we don’t know how much of a relative decarbonization we will need in the future, we can’t know how active the index will need to be. So, what’s the best way to address sector and country active risk that can continue to work throughout time?

A constraint on sector allocation may yield suboptimal outcomes. If we were to implement a tight sector constraint that worked well at inception (30% decarbonization), this may result in extreme stock-specific risk to maintain sector neutrality at greater levels of decarbonization, which may potentially be required in the future—e.g., sector constraints could be met by allocating all of the weight of one sector to one or two stocks with the lowest carbon intensity, causing concentration risk. Alternatively, we could take a more relaxed approach and set a sector constraint that would work well at a closer to 80% decarbonization, which would likely take on significantly more active sector risk than required to meet the ESG and climate objectives.

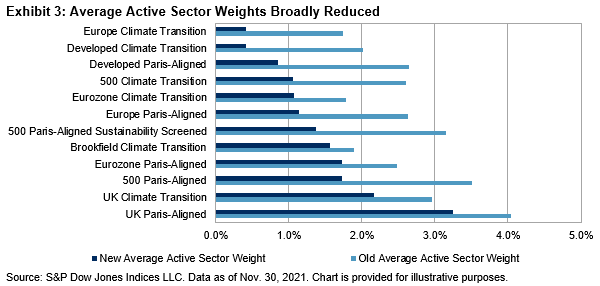
A more flexible solution might be to incorporate active sector weight penalization within the objective function, to produce an optimal balance among stock-specific active risk, country active risk and sector active risk—the change we will see in the upcoming rebalance, based on the recent consultation. This new objective function allows for a broad reduction in active sector weight across indices (see Exhibit 3) and potential levels of decarbonization required.

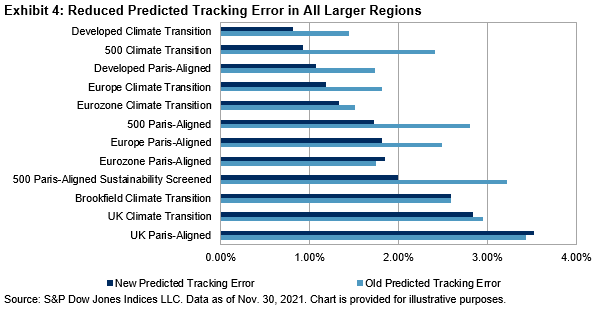
How do these reduced sector and country active risks, alongside other methodology changes, translate into predicted tracking error? We see large reductions within the largest regional indices, for both the climate transition and Paris-aligned variants (see Exhibit 4).

Impact analysis reveals changes to the S&P PACT Indices via this consultation would have caused companies to be compared more with their direct country and sector peers and reduced tracking error, while still meeting all the climate objectives, within a glass-box optimization framework. This allows for a sophisticated, multifaceted ESG and climate index and has historically provided benchmark-like characteristics.


1 For frame of reference, between 1950 and 2019, the global CO2 emissions grew by 2.66% (Our World in Data, 2022).

2 Note that this stress test is based on a hypothetical index based on the S&P Developed ex-U.S. universe. This stress test assumes that only the decarbonization rate required will change over time.

The posts on this blog are opinions, not advice. Please read our Disclaimers.

Beyond Bitcoin: Increasing Accessibility through a Digital Assets Classification System

Contributor Image
James McDonald

Product Manager, Enterprise Data Team

Lukka

In part one of the Beyond Bitcoin series, we introduced the importance of applying a sector classification system to the emerging digital assets asset class. We examined what it looks like for an investor to expand their view of the digital assets markets beyond the oft-cited mega-cap assets (such as Bitcoin and Ethereum) and discussed how a sector classification could potentially benefit portfolio managers making active investment decisions.

This part of the series explores how this would potentially increase access for market participants through the transparency, clarity, and stability that comes from applying a sector classification.

Benefits of Adopting a Standardized Sector Classification

The broad adoption of a digital assets sector classification system has the capability to provide benefits to market participants, supplement the growth of digital assets, and enable new investors to participate in the market. Notable benefits include:

Adding Efficiency to the Portfolio Management Process

Asset sector categorization allows investors to overlay traditional portfolio management methods within the portfolio construction process. For example, investors could compare risk and return metrics across different sectors as well as examine historical returns to see how specific assets have performed compared to their sector. Going further, investors could study the correlation of returns across sectors with the goal of reducing idiosyncratic risk within a portfolio.

These types of analyses, which are common in mature markets, support the overall portfolio construction process. However, the adoption of similar practices within the digital assets space has yet to come to fruition in the same way it is used in public equities markets, largely due to barriers in classifying digital assets in a standard and consistent way.

HOW IT COULD WORK

A hypothetical investor may compare the 12-month historical performance and standard deviation of returns for assets within the Smart Contract Platforms and Scaling sectors. They see that the Smart Contract Platforms sector outperformed the Scaling sector in the last 12 months, while maintaining a comparable level of risk. This information, plus a manager-driven macro-level view of the fundamentals within the digital assets market, could inform an investment thesis for overweighting or underweighting an allocation to the Scaling sector.

Creation of New Investment Products

As the digital assets asset class grows and matures, the demand for new products and tailored exposures from market participants continues to increase. Using a sector classification system to build investment products that help formulate tailored exposures in the digital assets market could benefit issuers, investors, and the overall market structure. As regulatory clarity unfolds, investors may see the introduction of products that enable quick exposure to specific corners of the digital assets market.

HOW IT COULD WORK

Similar to how investors are able to gain exposure to certain sectors via sector-specific ETFs in the stock market today, they may demand similarly tailored exposure to digital assets. Investors may choose from an array of products that provide exposure to a specific sector, such as Metaverse ecosystems, Play to Earn tokens, or DeFi platforms, allowing investors to create more diverse and efficient portfolios.

Enable Index Construction to Assist in Benchmarking

Adoption of a standardized sector classification system could lead to new digital asset-specific indices, which can offer greater transparency to market participants within the digital assets space as well as provide a standardized point of comparison for benchmarking. Experienced market participants, including sage index providers, recognize this is a critical requirement to advance market maturity.

A great example of this is the S&P Dow Jones Indices suite of digital asset indices designed to track exposure to different areas of the market. Indices help investors benchmark asset or portfolio performance, compare professional investment managers and set trackable risk and return goals.

HOW IT COULD WORK

Self-directed investors could opt to invest in digital assets and gauge their performance against an index that tracks the broader market, such as the S&P Cryptocurrency Broad Digital Market Index. From another side of the market, a Fund of Funds Manager may look to construct a portfolio of active digital asset hedge funds primarily based on previous performance against the S&P Cryptocurrency Broad Digital Market Index.

Investor Portfolio Governance and Guideline Supervision

The application of a standardized classification system allows for tailored and rigorous controls in portfolio mandate documentation and subsequent portfolio monitoring. In addition, classification empowers professional money managers and clients to specify more granular controls for investment managers within traditional agreements, such as an investment policy statement or financial plan.

HOW IT COULD WORK

The client and money manager could agree that no more than a certain percentage of the portfolio value can be allocated to DeFi strategies, and only another percent can be allocated to the digital assets asset class. These rules could be crucial for new investors who are hesitant to enter the market due to risk or volatility concerns. The correct implementation of such guidelines could enable a risk-focused approach to entering the market and promote broader adoption.

The underlying theme in all of the above benefits is that they make digital assets more accessible for investors. A classification system removes significant barriers to entry for new investors and makes the asset class more digestible at all levels of market participation. Bypassing cryptocurrency jargon and viewing the market via a standardized digital assets sector classification system can help investors understand their investment and increase transparency, stability and participation.


About Lukka

Lukka is a firm that helps solve some of the greatest financial challenges in crypto and has the intellectual resources, along with the data and processing capabilities, to test hypothetical scenarios like the one here. For more information on how Lukka puts data to work across multiple finance sectors, traditional and decentralized, supporting industries from insurance to Formula E, go to our website at Lukka.tech

For all press-related inquiries, please visit Lukka.tech/press/

Lukka, Inc. is the provider of S&P Dow Jones Indices’ cryptocurrency pricing, custody and reference data. S&P Global, Inc., the parent of S&P Dow Jones Indices, is an investor in L ukka.  For information on S&P Global’s investment in Lukka, please see here. In addition, representatives of Lukka may provide consultative services to the S&P Digital Assets Index Committee from time to time.

DISCLAIMER

THE INFORMATION CONTAINED IN THIS BULLETIN PROVIDES ONLY A GENERAL OVERVIEW OF CURRENT ISSUES RELATED TO DEBT FINANCING IN CRYPTOCURRENCY MARKETS AND SHALL IN NO EVENT BE CONSTRUED AS THE RENDERING BY LUKKA OF PROFESSIONAL ADVICE OR SERVICES. AS SUCH, THE INFORMATION PROVIDED IN THIS BULLETIN SHOULD NOT BE USED BY YOU AS A SUBSTITUTE FOR CONSULTATION WITH PROFESSIONAL ADVISORS. BEFORE MAKING ANY DECISION OR TAKING ANY ACTION REGARDING YOUR DIGITAL CURRENCIES OR THE DEBT TREATMENT THEREOF, YOU SHOULD ALWAYS CONSULT WITH AN APPROPRIATE FINANCIAL, LICENSED TAX, ACCOUNTING, OR OTHER PROFESSIONAL. TO THE FULLEST EXTENT PERMITTED BY LAW, IN NO EVENT WILL LUKKA(INCLUDING ITS RELATED ENTITIES, OWNERS, AGENTS, DIRECTORS, OFFICERS, ADVISORS, OR EMPLOYEES) BE LIABLE TO ANY READER OF THIS BULLETIN OR ANYONE ELSE FOR ANY DIRECT, INDIRECT, OR CONSEQUENTIAL LOSS OR LOSS OF PROFIT ARISING FROM THE USE OF THIS BULLETIN, ITS CONTENTS, ITS OMISSIONS, RELIANCE ON THE INFORMATION CONTAINED WITHIN IT, OR ON OPINIONS COMMUNICATED IN RELATION THERETO OR OTHERWISE ARISING IN CONNECTION THEREWITH.

The posts on this blog are opinions, not advice. Please read our Disclaimers.

Green Pools: Evolving ESG Trading Ecosystems

Contributor Image
Sherifa Issifu

Senior Analyst, U.S. Equity Indices

S&P Dow Jones Indices

Compared to the wide range of liquid, tradable instruments associated to more traditional benchmarks like the S&P 500®, the trading ecosystem of ESG-based investment products is still in its infancy. But, with the increased volume in listed futures linked to the S&P 500 ESG Index and S&P Europe 350® ESG Index, change is afoot.

Of course, market participants have used exchange-traded vehicles for ESG investing for quite some time. The first ESG ETF launched 20 years ago, and there are now nearly 1,000 ETFs and ETPs listed globally with approximately USD 400 billion in assets as of February 2022, a massive contrast to the USD 2 billion in assets in 2005, according to ETFGI.

However, the growth of a true trading ecosystem around ESG products is a newer phenomenon. The futures based on S&P DJI ESG Indices have been at the forefront of the development: the S&P 500 variant has the highest dollar volume of any equity index-based ESG future, according to independent research by Graham Capital Management. As Exhibit 2 shows, volumes in S&P DJI ESG futures initially tended to cluster around quarter-end, when positions in front-month contracts are usually rolled or closed. But in 2022, this has begun to change, with more consistent trading through the quarterly cycle.

A 2021 research piece by CME Group titled “Answering the liquidity question” also pointed out that futures on indices of leading benchmarks can be transferred into their ESG futures variants, which means that market makers may be able to rely on global pools of futures, options and ETF liquidity to facilitate trading. Meanwhile, accompanied by the growth in liquidity, index options and ETF options linked to the S&P ESG Indices have also been introduced, providing investors with a broader range of risk management tools to participate, hedge or speculate within U.S markets through a “green” lens.

Highlighting the growing importance of ESG index-related futures, Exhibit 3 shows the annual dollar value in trading of all products within the S&P DJI ESG ecosystem, including ETFs, futures and options linked to ESG-themed indices. In terms of the economic value of traded index exposure, ESG futures now make up about 50% of the S&P DJI ESG trading ecosystem.

Why does this matter? If ESG is to become more mainstream, investors may look for ease and speed of execution comparable to traditional benchmarks such as the S&P 500. Futures and options can play an important role in strengthening investor confidence by creating new and deeper pools of liquidity, and by bringing the price scrutiny of a small army of arbitrageurs to “police” price discrepancies. A robust network of tradeable products may entice such arbitrageurs, and there are signs that precisely such a network has begun to develop around the S&P 500 ESG Index and the broader S&P DJI ESG ecosystem.

The posts on this blog are opinions, not advice. Please read our Disclaimers.

Going Electric: Introducing the S&P GSCI Electric Vehicle Metals

Contributor Image
Fiona Boal

Managing Director, Global Head of Equities

S&P Dow Jones Indices

As the world has begun to focus on new technology to aid in the global energy transition, electric vehicles (EV) are becoming more a part of everyday life. S&P Dow Jones Indices (S&P DJI) has collaborated with S&P Global Commodity Insights (SPGCI) to launch the S&P GSCI Electric Vehicle Metals, which seeks to track the metal commodities used in the production of electric vehicles.

The index was created in response to client demand for investable thematic strategies that offer exposure to the global energy transition. The energy transition represents both a significant challenge and opportunity to financial market participants, and nowhere is that dichotomy more obvious than in commodities markets.

The S&P GSCI Electric Vehicle Metals is a commodities futures-based index that is designed to reflect the performance of the tradeable metals used in the production of an EV. The expertise of SPGCI is leveraged for data to help determine the index constituents and production weights to ensure the index broadly reflects the relative metal usage in a representative EV. An important characteristic of the index is the flexibility to reweight, add or remove constituents at regular intervals to ensure that it can adapt to changes in EV technology and the launch and adoption of new metals futures contracts.

Constituents in the index are weighted based on their current metal usage in an average EV multiplied by the average per unit price for the metal, thereby representing the relative cost (or value) of the metal components in an EV. Minimum contract trading and liquidity rules for constituent inclusion, similar in design to the eligibility criteria used for the broad S&P GSCI, are also applied. Additionally, battery metal constituents, as defined by SPGCI but including cobalt and lithium, are capped based on contract trading volume and liquidity requirements to ensure that the index is both replicable and investable. Exhibit 1 illustrates the index constituents at launch and representative weights following the January 2022 rebalance. Exhibit 2 compares the recent performance of the index with the broad-based S&P GSCI.

Another important characteristic of the index is that it is based on commodities futures, not equities. The presence of equity market beta in thematic equity indices can make it difficult for these indices to truly reflect the performance of a particular theme or component of the real economy. It may not be possible to know which companies will win the battle for EV supremacy, but measuring the supply and demand dynamics and price performance of the underlying physical components that will be needed to build out the EV fleet is relatively straightforward.

The S&P GSCI Electric Vehicle Metals is the first S&P DJI index to incorporate data from SPGCI. It is exciting to bring together the expertise of two analytically independent S&P Global divisions on such an important and relevant segment of the investment landscape. Together, we hope to improve market transparency and offer market participants the ability to build unique investment strategies across a growing segment of the energy transition.

The posts on this blog are opinions, not advice. Please read our Disclaimers.

Face-to-Face with the Metaverse

Contributor Image
Srineel Jalagani

Senior Director, Thematic Indices

S&P Dow Jones Indices

Metaverse on the Runway to Reality

S&P DJI recently launched the S&P Kensho Metaverse Index, which is designed to track the growing group of technologies under the metaverse banner. The origin story of the metaverse can be traced back to a science fiction novel in the early ‘90s. Since then, it has seen many reincarnations under different names.1 Nonetheless, one core idea has remained constant through its iterations—an immersive virtual world that allows users across the globe to participate in activities and interact using their digital avatars.

How is the latest metaverse different than its predecessors? The aspirational features and related infrastructure development for the latest version of the metaverse are bringing the idea of a true digital world closer to reality than ever before. A confluence of advances in multiple fields, including but not limited to computational hardware, cloud software, content management, digital payments and flexible work schedules, have all played a part in the popular embrace of the metaverse. Some of the distinct features for this chapter of metaverse evolution that set it apart are as follows.2

  • Interoperability that underpins its scalability across multiple social platforms
  • A push to leverage both a faster decentralized internet (5G, Web 3.0) and untethered devices with sizable onboard computational power, to accommodate synchronous rendering and an unlimited number of users
  • Multi-disciplinary application areas that expand the scope and speed of its global acceptance; various estimates put metaverse-related revenue to hit approximately USD 800 billion by 2024, reflecting a CAGR of 13% since 20203

Focus on Core Building Blocks

Given the breadth of potential metaverse applications, our approach for constructing a metaverse index focuses on the following four pivotal themes, which in our view, form the backbone of the seamless metaverse experience.

  • XR Enabling Software and Applications: Software applications driving interactions within the high-capacity digital environments
  • XR Enabling Equipment: Hardware driving the immersive low-latency digital user experience
  • Infrastructure Technologies: Edge computing and cloud-based data infrastructure that will enable real-time capabilities
  • Digital Finance: Virtual payments and digital currencies that will facilitate frictionless commerce within the metaverse

Index Construction and Methodology Underscores Its Differentiation

With our metaverse index scope defined, we apply our innovative S&P Kensho Index construction methodology to generate the list of individual stocks eligible for inclusion. This procedure harnesses natural language processing techniques meshed with our experts’ oversight to define a rules-based approach in selecting U.S.-listed stocks whose business objectives and revenue disclosures include relevant text to the index’s focus areas. For our metaverse index, we limit the basket to companies whose core business is one of the four areas defined above, tailored to pick stocks essential to the theme. The S&P Kensho Metaverse Index has a relatively small overlap with Nasdaq 100 and S&P Software & Services Select Industry Index (see Exhibit 1), highlighting its emphasis on incipient stocks within this growing theme. The S&P Kensho Metaverse Index’s stock overlap even with some of its similar-themed competitors is roughly about one-half of its constituents. This can be attributed to our targeted sub-themes within the metaverse, which doesn’t have one stated consensus industry definition.

The S&P Kensho Metaverse Index’s current constitution (as of March 22, 2022) contains 30 stocks and is weighted primarily toward the Infrastructure Technologies segment (51%), followed by XR Enabling Software and Applications (36%), XR Enabling Equipment (10%) and Digital Finance (4%) (see Exhibit 2).

The S&P Kensho framework’s adaptive and forward-looking characteristics help to ensure current constituents’ continued relevance to the index’s theme, as well as room for new constituents to account for evolution within this nascent area. Additionally, our liquidity-adjusted equal weighting methodology seeks to reduce index concentration and increase its investability.

1 https://www.cnbctv18.com/business/industrial-ai-startup-detect-technologies-signs-global-pact-with-shell-12908962.htm

2 https://www.td.org/atd-blog/what-is-the-metaverse-where-we-are-and-where-were-headed

3 https://www.bloomberg.com/professional/blog/metaverse-may-be-800-billion-market-next-tech-platform/

4 For more information about these ETF holdings, please see the following websites: https://www.invesco.com/us/financial-products/etfs/product-detail?audienceType=Investor&productId=ETF-QQQM. https://www.fountetfs.com/product/mtvr. https://www.proshares.com/our-etfs/strategic/vers/. https://www.roundhillinvestments.com/etf/metv/. https://www.subversiveetfs.com/punk.

5 For more information about these ETF holdings, please see the following websites: https://www.fountetfs.com/product/mtvr. https://www.proshares.com/our-etfs/strategic/vers/. https://www.roundhillinvestments.com/etf/metv/. https://www.subversiveetfs.com/punk

The posts on this blog are opinions, not advice. Please read our Disclaimers.