Get Indexology® Blog updates via email.

In This List

Industrial Commodities Push the S&P GSCI Lower in August

Risk Parity Act Two: Presenting the S&P Risk Parity 2.0 Indices

Demystifying Digital Assets: Getting to Know the S&P Cryptocurrency Indices

Stalwarts Continue to Increase Presence in the S&P 500 Low Volatility Index

Digital Asset Infrastructure – Custody

Industrial Commodities Push the S&P GSCI Lower in August

Contributor Image
Fiona Boal

Managing Director, Global Head of Equities

S&P Dow Jones Indices

The S&P GSCI declined 2.3% in August, as industrial commodities retreated in line with a surge in COVID-19 cases attributed to the Delta variant, as well as signs that China intended to dampen industrial production to curb carbon emissions. In contrast, performance across the soft commodities was impressive, with a variety of production-related disruptions elevating the risk of lower supply.

The S&P GSCI Petroleum fell 5.1% over the month. Oil production picked up across the world, while demand dipped slightly in the wake of a rise in COVID-19 cases. The resumption of aviation, especially long-haul passenger flights, would be critical to the full recovery in petroleum consumption.

Within the industrial metals complex, copper, lead, and nickel fell as China intensified its crackdown on some of the least environmentally friendly components of its economy. The S&P GSCI Aluminum was an exception, reaching a new 10-year high and ending the month up 4.5% and up 34.6% YTD. Supplies of the metal are becoming increasingly tighter as Beijing seeks to curb pollution from the metal’s energy-intensive production process. Environmental concerns are a double-edged sword for industrial metals, as they tend to be some of the worst GHG-emitting commodities, but they are key components in almost every new green technology.

Iron ore prices touched record highs this year, but the S&P GSCI Iron Ore suffered one of its biggest monthly losses ever in August (down 13.3%) as China’s curbs on carbon emissions included limits on the output of steel. Demand for steel has been healthy, but Chinese steel mills are constrained by Beijing’s instruction that production for 2021 should not exceed the record 1.065 billion metric tons produced last year. To meet that goal, steel producers would have to cut output by roughly 10% for the rest of 2021 from their record first-half pace.

The annual U.S. Fed meeting in Jackson Hole came and went without significant market volatility, and the S&P GSCI Gold ended flat for the month. Gold is often viewed as a hedge against inflation and currency debasement, and the Fed’s tapering would tackle both those conditions, thereby diminishing gold’s appeal.

The S&P GSCI Agriculture rose 0.3%, with the softs outperforming. The S&P GSCI Sugar rose 10.8%, marking a new three-year high as estimates for the size of the Brazilian cane crop continued to fall. The S&P GSCI Coffee rose 7.3%, continuing its impressive and volatile two-month rally. Several weather and logistical issues, including new pandemic lockdowns in Vietnam, coalesced to raise the price of a cup of joe.

The combination of stronger-than-expected pork demand and the ongoing lack of labor at U.S. packing plants pushed the S&P GSCI Lean Hogs up 0.9% for the month.

The posts on this blog are opinions, not advice. Please read our Disclaimers.

Risk Parity Act Two: Presenting the S&P Risk Parity 2.0 Indices

Contributor Image
Rupert Watts

Head of Factors and Dividends

S&P Dow Jones Indices

While the rationale behind risk parity is well understood, the implementation frameworks often differ. For example, some implementations are purely passive while others are more active, the way risk is defined can differ, and the underlying instruments used can vary.

In 2018, the S&P Risk Parity Indices became the first transparent, rules-based benchmarks offered in the space. Since their launch, several firms have adopted these indices as benchmarks and for replication. Moreover, we have been in regular dialogue with several of the leading asset owners, asset managers, and consultants focused on risk parity. Insights from these valuable interactions motivated us to launch a second series of indices, the S&P Risk Parity 2.0 Indices. In this blog, we will introduce this new index series and compare it to the original.

High-Level Methodology Comparison

Exhibit 1 highlights the features of the methodologies that are shared or different. The S&P Risk Parity 2.0 Indices differentiate themselves from the first series in two distinct ways: they incorporate a fourth asset class (TIPS) and assess risk differently. Details on the construction for both series will be covered more extensively in an upcoming blog

Risk parity strategies are often assessed in terms of how they are expected to perform across periods when growth and inflation are either rising or falling. TIPS is an important asset class for many investors because it can be an effective way to guard against inflation. TIPS are also expected to outperform equities and commodities during periods of falling growth.

The S&P Risk Parity 2.0 Indices also switch from the simplistic definition of risk (as volatility) to define it in terms of volatility and covariance. By including both volatility and covariance, the risk of each asset class is being assessed in terms of its contribution to the overall portfolio. Furthermore, instead of allocating risk equally across all four asset classes, it uses a budgeted approach where commodities, equities, and fixed income are each assigned a 28.3% risk budget and TIPS is assigned a 15% risk budget. To achieve this, an optimizer solves for the weights that satisfy these risk budgets.

Headline Performance Statistics

Exhibit 2 summarizes the high-level performance characteristics for each of the series using the 10% target volatility indices.

Over the long-term, both index series have posted risk-adjusted returns that are superior to the manager composite, the HFR Risk Parity Vol 10 Index. For reference, the HFR Risk Parity Indices represent the weighted average performance of the universe of active fund managers employing an equal risk-contribution approach in their portfolio construction. We intend to review the performance characteristics in more detail in upcoming blogs in this series.

Conclusion

Despite their commonalities, these two series are certainly distinct, and we anticipate demand for both. Thus far, the original series has proved popular, given it is 100% futures-based and assesses risk in a simple and straightforward manner. The S&P Risk Parity 2.0 Index Series cannot be fully implemented using futures (since it incorporates TIPS) and cedes some simplicity (by using an optimizer), but in doing so it accounts for cross-asset correlations as it strives to achieve improved risk diversification. We look forward to delving further into this new index series in future blogs.

The posts on this blog are opinions, not advice. Please read our Disclaimers.

Demystifying Digital Assets: Getting to Know the S&P Cryptocurrency Indices

How are indices helping bring greater transparency to this emerging asset class? S&P DJI’s Tyler Carter and Ved Malla explore the design and objectives of new tools for tracking and evaluating digital currencies.

The posts on this blog are opinions, not advice. Please read our Disclaimers.

Stalwarts Continue to Increase Presence in the S&P 500 Low Volatility Index

Contributor Image
Fei Mei Chan

Former Director, Core Product Management

S&P Dow Jones Indices

If the equity market’s report card so far in 2021 is any indication, it’s on track to be another stellar year. Through Aug. 19, 2021, the S&P 500® is up 17%. The gains were achieved steadily; apart from January, the benchmark has been up every month in 2021. Predictably, in such an environment the S&P 500 Low Volatility Index has lagged, up 14% through close of Aug. 19, 2021.

Volatility declined slightly in most sectors of the S&P 500. Even Energy was less volatile compared to three months prior.

One-Year Volatility Levels Declined Slightly for All Sectors of the S&P 500

The changes in the latest rebalance for S&P 500 Low Volatility Index, effective after market close Aug. 20, 2021, are subdued compared to the flurry of activity in the previous rebalance.

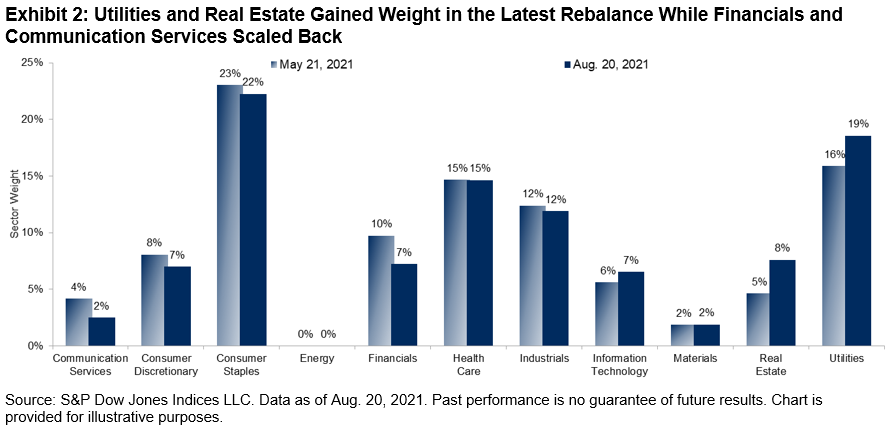
Utilities and Real Estate Gained Weight in the Latest Rebalance While Financials and Communication Services Scaled Back

Real Estate and Utilities continued to increase their weight in the index, with Financials and Communication Services showing the largest declines. The reduction in Financials is somewhat surprising given the sector’s relatively large drop in volatility. Despite this decline, however, Financials remains one of the most volatile sectors in the market, and the S&P 500 Low Volatility Index looks to minimize volatility at the stock level.

The posts on this blog are opinions, not advice. Please read our Disclaimers.

Digital Asset Infrastructure – Custody

Contributor Image
Sharon Liebowitz

Former Head of Innovation

S&P Dow Jones Indices

Have your clients asked you about Bitcoin? Perhaps they’ve asked how to buy Bitcoin or another cryptocurrency. Maybe they’ve asked about signing up for a MetaMask wallet. Perhaps they have been confronted with choosing a centralized exchange (e.g., Coinbase) or a DEX (decentralized exchange—e.g., UniSwap). Diving into cryptocurrencies requires learning a new language involving terms like public and private keys, hot and cold storage, Ledgers and Trezors, and seed phrases. Beyond the jargon, the market is finding many ways to buy, trade, and hold crypto, and innovation is accelerating

As with any market advancing this quickly, the infrastructure is also progressing to confront issues such as evolving regulations, young technology, unfamiliar risks (potential for hacks, lost keys, etc.), and the need for operational and IT security. It is a diverse and complex market, and it can sometimes be difficult to navigate.

One particular logistical challenge is cryptocurrency custody. For institutions, choosing a fit-for-purpose custody solution is paramount to their success and competitiveness in this space.

Some financial institutions choose to avoid the cryptocurrency custody (and, more broadly, the infrastructure) challenge altogether. Concerned about the regulatory impact of holding Bitcoin or other cryptocurrencies outright, these institutions look toward products such as ETFs or futures that give exposure to cryptocurrencies without directly holding them.

For those who do want to hold cryptocurrencies directly, there are several alternative approaches.

While we see the occasional firm that wants to build its own custody (i.e., Standard Chartered building Zodia), an increasing number of top custodians, banks, and asset owners are starting to integrate with digital native custodians (e.g., firms that were created specifically to service the blockchain infrastructure). This may allow the traditional firms to manage operational complexities, navigate regulatory gray areas, and to get to market more quickly. As an example, BNY Mellon is planning to use Fireblocks for digital custody.1 Other known digital custodians include Anchorage, BitGo (which is being acquired by Galaxy), and Kingdom Trust.

Other digital market players are also adding custody. For example, some of the largest digital exchanges such as Coinbase and Gemini offer custody. Also, in the U.S., new guidance from the Office of the Comptroller of the Currency (OCC) opened the possibility of crypto custody at national banks. Avanti Bank and Anchorage Digital Bank are among the first to receive approval. In Europe, Sygnum, a Swiss digital bank, is now offering regulated custody for DeFi (decentralized finance) tokens to address this booming part of the market.

Seeing the market demand, firms offering institutional-grade custody for digital assets have grown quickly over the last few years, and new solutions continue to enter the market. These custodians help secure funds, protect against cyberattacks, apply robust cryptography, and create redundancies and checks to avoid human error and behavior. For custody, and other services, a firm that has SOC 1 Type 2 and Soc 2 Type 2 certification to validate institutional-grade operations is a key differentiator.

These new developments highlight an increasing institutional demand and focus regarding the growing cryptocurrency asset class. They also provide better quality services for large institutions such as banks, hedge funds, and asset managers.

Centralized liquidity and custody seem to contradict the decentralized thesis that underpins cryptocurrency and blockchain in general, but as the market shifts from early adopters to a broader reach with more mainstream and institutional players, the quality and convenience of centralized, sophisticated services appear to be gaining traction.

Stay tuned as this market develops!

Next up in Digital Asset Infrastructure: Institutional trading and exchanges – CEXes, DEXes, and more.

1 https://www.ledgerinsights.com/bny-mellon-picks-digital-asset-custody-firm-fireblocks-which-raises-133-million/

The posts on this blog are opinions, not advice. Please read our Disclaimers.