Get Indexology® Blog updates via email.

In This List

A YTD History of S&P 500® Dividend Increases, Cuts, and Suspensions

Indian Capital Markets Followed Global Trends in the First Half of 2020

A Cast of Crude Oil Indices

A New ESG Index for Mexico Sets the Stage for Investment

A Conundrum in a Different Key

A YTD History of S&P 500® Dividend Increases, Cuts, and Suspensions

Contributor Image
Howard Silverblatt

Senior Index Analyst, Product Management

S&P Dow Jones Indices

Back in mid-February 2020, S&P 500 issues were easily on track to set their ninth annual record for dividend cash payments, as forecasts called for double-digit 2020 returns. By month-end February, 113 issues in the S&P 500, 22% of the index, had increased their dividends, with no cuts (and certainly no suspensions), and Q1 2020 went on to return a record USD 127 billion of cash payments to holders.

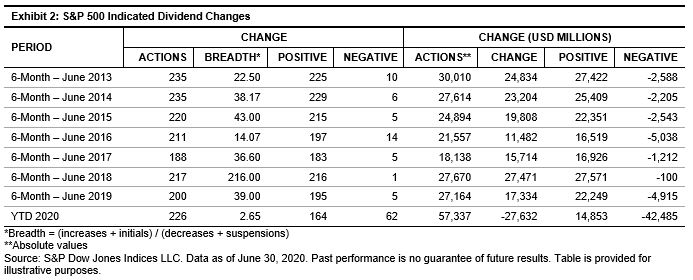
All was good until the word “corona” turned from a beer order into a virus. By the end of June, four months later, the index posted 49 additional increases (with lower increases; the Q2 2020 average increase was 7.50% versus Q1 2020’s 9.01% and Q2 2019’s 11.03%), along with 62 decreases, with 41 of the 62 being suspensions (the last suspension was in 2017 by PG&E). Still, the Q2 2020 payments held up, as companies fulfilled their prior declarations, returning USD 119 billion to holders. The amount was higher on a year-over-year basis (0.3% over Q2 2019), but 6.2% lower than the record Q1 2020 payment. Because of the record Q1 2020 payment, the payment for the first half of 2020 was 5.1% higher on a year-over-year basis.

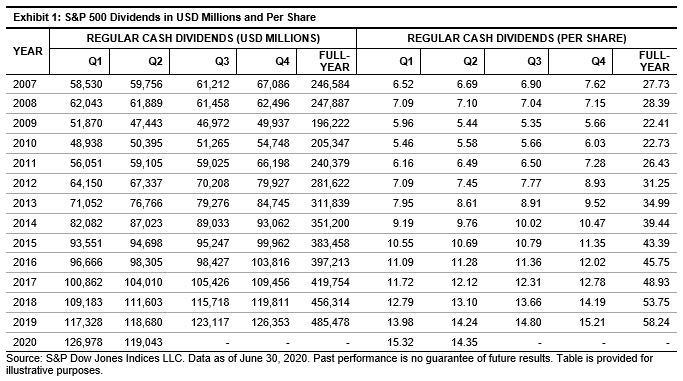
However, the announcements of Q2 2020 payments that started in March paint a different picture of the second half of 2020. The first half produced USD 14.9 billion in announced increases and USD 42.5 billion in cuts, resulting in a USD 27.6 billion reduction in dividends, with the immediate result of lower declared payments for Q3 and Q4 2020.

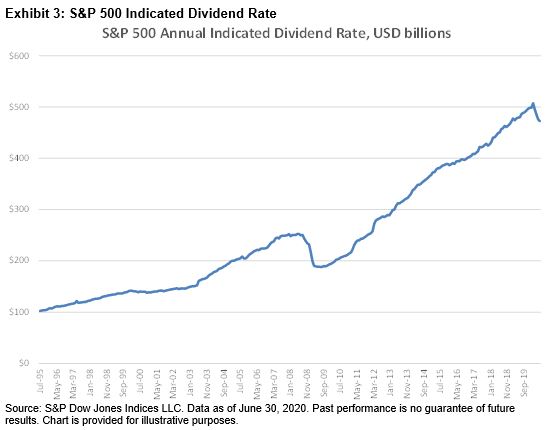
If one thinks of dividends as a paycheck, a 25-year wage growth, compounded using actual cash payments, amounts to 6.4% annualized. The annualized growth from the full recovery from the financial downturn to YTD was higher, at 7.6%. From February 2020, when dividend rates reached an all time high, to now, the drop was equivalent to taking a 6.8% pay cut.

At the moment, the 2020 estimate for payments from S&P 500 issues has improved to a 2% decline in the actual 2020 payment over 2019, compared with May’s decline estimate of a 3%-4% decline. The last down dividend year for the index was in 2009 (-21.07%).

Taken all together, the swift dividend cuts and suspensions have overpowered smaller and fewer increases for S&P 500 companies. Going forward, if the reopening continues to be positive for the economy, the major damage of cuts and suspensions could be behind us. It is worth noting that while the current working estimate for S&P 500 issues has improved, it remains contingent on the reopening.

The posts on this blog are opinions, not advice. Please read our Disclaimers.

Indian Capital Markets Followed Global Trends in the First Half of 2020

Contributor Image
Ved Malla

Associate Director, Client Coverage

S&P Dow Jones Indices

2020 has been overshadowed by the COVID-19 outbreak and the subsequent lockdown across the world. Capital markets have been negatively affected globally as well as locally in India. The lockdown in India began during the third week of March 2020 and has only recently been slightly relaxed. The first half of 2020 was volatile for the capital markets in India. All size indices and most sector indices posted negative returns for the six-month period ending June 2020.

Exhibits 1 and 2 showcase the six-month returns for India’s leading size indices for calendar year 2020.

From Exhibits 1 and 2, we can see that the returns for large-, mid-, and small-cap segments for the first six months of 2020 were negative. The large-cap indices posted the lowest returns among the size indices. The S&P BSE SENSEX, which comprises the 30 largest and most-liquid listed companies in India, provided a negative return of nearly -15% over the first half of 2020. However, after a free fall that lasted until the end of March 2020, we have seen a good recovery in all the size indices. The S&P BSE SmallCap has had a better recovery than the large- and mid-cap indices.

Exhibits 3 and 4 showcase returns for the 11 leading sector indices in India over the past six months.

From Exhibits 3 and 4, we can see that the S&P BSE Healthcare and S&P BSE Telecom posted strong six-month absolute returns of 21.61% and 17.33%, respectively. The S&P BSE Realty, S&P BSE Finance, and S&P BSE Industrials posted the lowest absolute returns of -30.50%, -29.38%, and -19.85, respectively, for the first half of 2020.

To summarize, we can say that the Indian capital markets fell sharply in the first quarter of 2020, especially in the month of March. However, there has been a recovery in the second quarter, although the six-month returns were still negative.

The posts on this blog are opinions, not advice. Please read our Disclaimers.

A Cast of Crude Oil Indices

Contributor Image
Fiona Boal

Managing Director, Global Head of Equities

S&P Dow Jones Indices

Over the past two decades, innovation in futures-based commodity indexing has allowed for the launch of commodity indices beyond broad market beta indices and into more sophisticated strategies with non-traditional roll mechanisms or contract selection.

In that vein, S&P Dow Jones Indices (S&P DJI) offers a wide variety of oil indices that offer exposure at different points along the crude oil futures curve, allowing market participants to select the index that best meets their investment requirements. For example, the S&P GSCI Crude Oil Dynamic Roll employs a flexible monthly futures contract rolling strategy and is designed to meet the demands of investors seeking to alleviate the negative impact of rolling during periods of contango.

Indices based on longer-dated contracts, such as the S&P GSCI Crude Oil 12 Month Forward, can also meet the needs of investors who prefer energy exposure with lower volatility or exposure that better reflects the long-term cost of oil production. Longer-dated indices can also be useful as a benchmark for real asset investments.

Oil indices based on multiple contracts are the newest offerings in commodity indexing. On June 15, 2020, S&P DJI launched the S&P GSCI Crude Oil Multiple Contract 55/30/15 1M/2M/3M. Instead of being represented by only one contract month, the index takes positions in three separate futures contract months. The S&P GSCI WTI crude oil contract production weights are distributed among the three contract months as follows: 55% is assigned to the contract month represented by the 1-month forward index, 30% is assigned to the contract month represented by the 2-month forward index, and 15% is assigned to the contract month represented by the 3-month forward index.

Multiple contract indices can add to or detract from index performance depending on the shape of the futures curve. During periods of contango, the indices benefit compared to the strategy that invests in rolling front-month futures contracts, but the reverse would take place during periods of backwardation. In light of the ongoing discussions among regulators, futures exchanges, and sponsors of financial products regarding position limits in commodity futures, financial products that are based on multiple contract indices may also find it easier to manage risk.

There are energy indices based on a broader range of petroleum products, ranging from Brent crude oil to oil products such as gasoline and heating oil. While crude oil product markets can be less liquid than crude oil, periods of deep structural contango generally occur less often in these markets, which may make indices based on these commodities more appealing to long-only investors with extended investment time horizons.

A broad range of energy indices exist today in the market, each tracking the performance of the oil market across different market segments and across the futures curve.

The posts on this blog are opinions, not advice. Please read our Disclaimers.

A New ESG Index for Mexico Sets the Stage for Investment

Contributor Image
Reid Steadman

Former Managing Director, Global Head of ESG & Innovation

S&P Dow Jones Indices

Where can environmental, social, and governance (ESG) benchmarks help investors and markets most? The answer may be in emerging markets, where it is crucially important to identify and navigate ESG concerns. The transparency that ESG benchmarks provide can help investors distinguish companies that prioritize the needs of not just their shareholders, but also their many additional stakeholders, including their employees, the communities they operate in, and the environment around them.

However, to truly drive change, an ESG index must be more than a flag to wave—it must set the foundation for investment. The S&P/BMV Total Mexico ESG Index, launched on June 22, 2020, is one such benchmark, built for investors looking for a tool to help them act.

The S&P/BMV Total Mexico ESG Index is built with the same philosophy underpinning the creation of many popular new ESG indices around the world, such as the S&P 500 ESG Index. The idea is that certain ESG indices should be more inclusive than exclusive to remain broad and diversified, such that the ESG index has a similar overall industry group weight as the benchmark, while providing an improved ESG profile.

Exhibit 1 shows how this index is constructed. First, exclusions are made according to companies’ involvement in business activities related to tobacco or controversial weapons or low compliance with the United Nations Global Compact (UNGC). Next, the S&P DJI ESG Score is used to screen and select companies. Finally, companies are weighted by their ESG Score.

The result is an index that, at launch, retained 29 of the 56 companies in its benchmark index, the S&P/BMV Total Mexico Index. By maintaining more than half of the original number of constituents and selecting companies within their industries, the index remains relatively balanced from a sector perspective. Exhibit 2 shows the average sector exposure of the ESG index and the benchmark index from the time S&P DJI had enough ESG data to calculate this index.

Because of the sector alignment and the ESG index constituents exhibiting an average beta of nearly 1—1.02 to be exact—the indices have historically performed largely in line with each other. This is attractive to many investors seeking to integrate ESG into their portfolios at a manageable level of risk.

In addition to this new index having achieved a similar risk/return profile as the market historically, market participants are also investing in better-performing companies from an ESG perspective—companies that align with their values. At launch, the composite ESG score for the S&P/BMV Total Mexico ESG Index was 59.6, a full 17 points higher than the composite score of its non-ESG benchmark index.

What does this higher score practically mean? It means more exposure to companies that have governance structures, human capital development, and environmental impacts better than their peers and in line with international standards, among many other positive qualifications. Further, it means that an investor using this index is aligning their investments with their values, thereby driving change in Mexico, creating a hopeful and sustainable future.

The posts on this blog are opinions, not advice. Please read our Disclaimers.

A Conundrum in a Different Key

Contributor Image
Anu Ganti

U.S. Head of Index Investment Strategy

S&P Dow Jones Indices

Volatility, dispersion, and correlation are elements of what we’ve elsewhere characterized as The Active Manager’s Conundrum. Active managers should prefer:

  • Low volatility, which is typically associated with higher returns
  • High dispersion, which means a larger payoff for correct stock selections
  • High correlation, which reduces the opportunity cost of a concentrated portfolio

The conundrum arises because low volatility, high dispersion, and high correlation almost never occur at the same time.

An excellent example of this conundrum lies within the Kensho New Economy Indices. From our Q2 S&P Kensho New Economies Dashboard, Exhibit 1 illustrates that the Kensho sectors have much higher dispersion levels than the traditional S&P 500 GICS sectors. Interestingly, the Kensho sectors also have much lower correlations compared to their S&P 500 counterparts, unsurprisingly given the more idiosyncratic nature of their constituents compared to those within the GICS framework.

Source: S&P Dow Jones Indices LLC. Data as of June 2020. Chart is provided for illustrative purposes.

The results are even more striking in Exhibit 2, where we compare the S&P 500 GICS sectors to the Kensho subsectors, which have higher dispersion levels along with extremely low correlations.


Source: S&P Dow Jones Indices LLC. Data as of June 2020. Chart is provided for illustrative purposes.

Active managers, almost by definition, run less diversified, more volatile portfolios than their index counterparts. When correlations are high, the incremental volatility associated with being less diversified and more concentrated declines.  We define the cost of concentration as the ratio of the average volatility of the component assets to the volatility of a portfolio.  A higher cost of concentration implies a higher hurdle for active managers to overcome.

Applying this logic to the Kensho New Economies, we would expect the cost of concentration for the S&P Kensho New Economies Composite to be higher than that of the S&P 500, as its low correlations create the possibility of less incremental portfolio volatility. We observe this to be the case in Exhibit 3, which shows that this cost is consistently higher for Kensho through time.


Source: S&P Dow Jones Indices LLC. Chart is provided for illustrative purposes.

This analysis has important implications for active management. Because of their high dispersion, there are immense opportunities for stock-pickers to add value by choosing among names in the Kensho New Economy Indices. But doing so requires active portfolios to bear a higher cost of concentration; the low correlation among the New Economies names means that stock-pickers forgo a huge diversification benefit.  Investors who choose active management couple the possibility of higher returns with the certainty of higher volatility.


The posts on this blog are opinions, not advice. Please read our Disclaimers.