Get Indexology® Blog updates via email.

In This List

Move over Millennials: ESG Investing Is a Multigenerational Conversation

How are India's Capital Markets Changing?

Seeking Durability in Dividends

Risk-Adjusted SPIVA® Year-End 2019 Scorecard: Most Active Managers Still Lagged

No Immunity for Active Managers

Move over Millennials: ESG Investing Is a Multigenerational Conversation

Contributor Image
Margaret Dorn

Senior Director, Head of ESG Indices, North America

S&P Dow Jones Indices

The COVID-19 pandemic has shaken financial markets and led many market participants to take a closer look at their investments. While emotionally and psychologically challenging, these selloffs can create opportunities to enhance long-term portfolio objectives. In this environment, advisors can demonstrate their value by helping clients invest in strategies they find meaningful and motivating.

Investors are reimagining the future state of investing in the aftermath of the pandemic, and record flows into environmental, social, and governance (ESG) ETFs undoubtedly reflect that mindset (see Exhibit 1). Assets in ESG ETFs and ETPs listed globally increased by 4.93% at the end of February 2020, to a new record of USD 67.99 billion.[1]

The recent surge of ESG ETF asset growth raises the question of who is investing in ESG-focused funds.

For years, ESG adoption has focused on millennials and their influence on sustainable investing. What has been consistently ignored, however, is that investors from all generations want to learn more about ESG investing and how best to put their values into action. Surprising to some, this includes the baby boomer generation. Let us not forget that many millennials inherited their core values from their baby boomer parents, whose activism and strong voices led to the establishment of the first sustainable funds in the 1970s. A recent report found that “baby boomers are more likely than millennials and Gen Xers to say that the reason they want to participate in ESG investing is to encourage companies to be good corporate citizens,”[2] which is an inspiring perspective, especially in the current environment.

It is increasingly evident that all generations wish to educate themselves on how to make ESG investment decisions and how to best align their investment objectives with their values. However, an additional objective shared by baby boomers, Gen Xers, and millennials alike is that aligning investments with their values not come at the cost of investment performance.

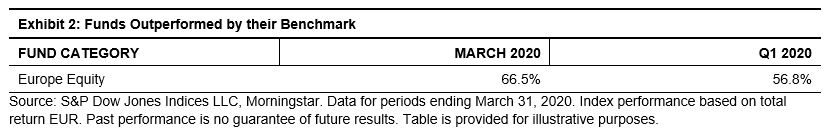
The S&P 500® ESG Index helps dispel the myth that a trade-off must exist between ESG principles and performance. Rather than detract from performance, ESG data can enhance visibility into financially material metrics that have not always been captured by traditional regulatory filings and standard financial analysis. In the past year, the S&P 500 ESG Index has provided a sustainable alternative to the iconic S&P 500, with similar risk and return, but with an additional lens into the constituents’ ESG principles (see Exhibit 2). While the recent outperformance is a welcomed result, it is important to note that the S&P 500 ESG Index does not aim to outperform its S&P 500 benchmark. It does, however, aim to achieve a considerable improvement in overall ESG performance by retaining companies with notable positive impacts such as an increase in female representation across management positions, a reduction in greenhouse gas emissions, and effective promotion of a risk culture.[3]

While indices like the S&P 500 ESG Index have continued to push the often marginalized conversation around sustainable investing into the mainstream, there remains boundless opportunity for financial professionals to educate all their clients on the reality of ESG investing. Advisors taking a proactive approach by initiating the ESG conversation are likely to be surprised by the openness of clients of all ages to engage around the topic in the current environment and beyond.

[1]   ETFGI reports ESG ETFs and ETPs listed globally gathered USD 7.54 billion in net inflows during Feb. 28, 2020. https://etfgi.com/news/press-releases/2020/03/etfgi-reports-environmental-social-and-governance-esg-etfs-and-etps

[2]   Allianz Global Investors, Socially Responsible Investing and ESG: It’s Not just a Millennial Trend. August 2019. https://www.allianzlife.com/about/newsroom/2019-press-releases/socially-responsible-investing-and-esg

[3]   For more information on the S&P 500 ESG Index, visit www.spdji.com.

The posts on this blog are opinions, not advice. Please read our Disclaimers.

How are India's Capital Markets Changing?

COVID-19 has left its mark on India’s capital markets, as gains of the past five years were given back in Q1 2020. S&P DJI’s Ved Malla takes a closer look at how India’s sectors have held up amid uncertainty.

Read more here: https://www.indexologyblog.com/2020/04/06/covid-19s-role-in-the-changing-landscape-of-indian-capital-markets/

The posts on this blog are opinions, not advice. Please read our Disclaimers.

Seeking Durability in Dividends

Do the S&P 500 High Yield Dividend Aristocrats provide durability during times of distress? S&P DJI’s Anu Ganti explains how dividend growers are positioned for the current climate.

Learn more here https://www.indexologyblog.com/2020/04/30/durability-during-distress/

The posts on this blog are opinions, not advice. Please read our Disclaimers.

Risk-Adjusted SPIVA® Year-End 2019 Scorecard: Most Active Managers Still Lagged

Contributor Image
Berlinda Liu

Former Director, Multi-Asset Indices

S&P Dow Jones Indices

In addition to absolute returns, institutional investors also evaluate active funds by risk-adjusted returns. This is not surprising since Modern Portfolio Theory tells us that higher returns tend to be associated with higher risk.

Our Risk-Adjusted SPIVA Scorecard was introduced in 2018 as an extension of the standard SPIVA Scorecards.

  • It aims to assess whether actively managed funds generate higher risk-adjusted returns than their corresponding benchmarks.
  • We consider volatility, calculated through the standard deviation of monthly returns, as a proxy for risk, and we use return/volatility ratios to evaluate performance.
  • Given that indices do not incur costs, we also present gross-of-fees performance figures by adding the expense ratio to net-of-fees returns. In this way, generally, higher risk should be compensated by higher returns.

Now, let’s look at the most recent report from year-end 2019.

U.S. Equity Funds: Scarce Outperformance

The Risk-Adjusted SPIVA Year-End 2019 Scorecard shows that, after adjusting for risk, most U.S. Equity Funds across all categories underperformed their benchmarks over mid- and long-term investment horizons, net of fees. Even on a gross-of-fees basis, outperformance only appeared in a few categories: Real Estate (over 5 and 15 years), Large-Cap Value (over 15 years), and Mid-Cap Growth funds (over 5 years). This is particularly noteworthy since the equity market was experiencing one of the longest bull markets during this period, with S&P 500® gaining 257%.

International Equity Funds: Most Funds Fell Short

As in the U.S., most international equity funds across all categories generated lower risk-adjusted returns than their benchmarks when using net-of-fees returns. On a gross-of-fees basis, only International Small-Cap funds outperformed over the 10- and 15-year periods.

Fixed Income Funds: Fees Were Critical

Fees played a critical role in fixed income fund performance. When using net-of-fees risk-adjusted returns, most actively managed fixed income funds in most categories underperformed over all three investment horizons. The exceptions were Government Long, Investment Grade Long, and Loan Participation funds (over 5 and 10 years), as well as Investment Grade Short funds (over 5 years). However, unlike their equity counterparts, most fixed income funds outperformed their respective benchmarks gross of fees.

Large versus Small: Size Mattered

On a net-of-fees basis, asset-weighted return/volatility ratios for active portfolios were higher than the corresponding equal-weighted ratios, indicating that larger firms have taken on better-compensated risk than smaller ones.

On a gross-of-fees basis, most fund categories produced higher return/volatility ratios than their benchmarks when equally weighted. However, their outperformance diminished once fees or fund size were accounted for, especially in domestic and international equity funds. In general, equal-weighted return/volatility ratios improved more than the corresponding asset-weighted ratios when fees were ignored, indicating that fees played a prominent role in smaller funds’ performance.

Conclusion

While our SPIVA Scorecards typically show that active funds underperform their benchmarks in absolute returns, defenders often argue that active funds may be superior to passive investment after adjusting for risk. The Risk-Adjusted SPIVA Year-End 2019 Scorecard demonstrates that history showed us quite the opposite: most active funds lagged their benchmarks over the long term, and exceptions were even more scarce when fees were counted for.

The posts on this blog are opinions, not advice. Please read our Disclaimers.

No Immunity for Active Managers

Contributor Image
Andrew Cairns

Director, Global Research & Design

S&P Dow Jones Indices

Despite the early warning signs of a global pandemic and its devastating potential to obliterate economic growth, it appears that fund managers in Europe generally failed to position themselves appropriately for the storm that was to come.

Taking a sneak peek into our upcoming SPIVA® Europe Scorecard, we can see the majority of Europe Equity active fund managers were unable to beat the S&P Europe 350® in Q1 2020.

Month-by-Month

The invisible threat of COVID-19 began to shut down production in many parts of mainland China by mid-January 2020, but the market repercussions took some time to be felt in Europe. By the end of January, Europe Equity funds had only lost 1% of their value on an asset-weighted basis, compared with a 1.3% drop in the S&P Europe 350 benchmark.

Come the end of February 2020, many European-focused investors would have welcomed such returns. European fund returns were down 7.7% for the month, slightly better than the benchmark, which fell 8.6%. At this point, it may have looked like active fund managers had the upper hand and were well placed to continue this outperformance into March.

March 2020 will go down in European stock market history as one of the most volatile months ever (surpassed only by October 2008). European funds lost 15.5% for the month compared with a 14.1% drop in the benchmark.

Tallying it all up, the first quarter of 2020 saw fund returns down 22.7%, while benchmark returns were down 22.4%.

While active managers’ performance in the quarter may appear broadly level with the benchmark, the chances of choosing an active fund that outperformed were not. The majority of Europe Equity fund managers were unable to beat the benchmark in either March or Q1 2020 as a whole, with 66% and 57% underperforming the benchmark, respectively.

The large proportion of underperforming active funds in March 2020 would suggest that despite their ability to time the market and extract value, fund managers broadly failed to utilize their skills and navigate the market in one of the most turbulent months. This is contrary to the widely held belief that market volatility provides a better opportunity for active managers to outperform.

With the COVID-19 crisis not yet over and volatility remaining high, will fund managers’ skill begin to show or will passive benchmarks continue to outperform the majority? Stay tuned for SPIVA Europe Mid-Year 2020 Scorecard to find out more.

The posts on this blog are opinions, not advice. Please read our Disclaimers.