Get Indexology® Blog updates via email.

In This List

Two Birds, One Stone: How the S&P Paris-Aligned Climate Index Concept Meets the Proposed EU Climate Benchmark Regulation and the Recommendations of the TCFD

SPIVA U.S. Year-End 2019 Scorecard: Active Funds Continued to Lag

The Trade-Off between Upside Participation and Downside Protection

COVID-19’s Role in the Changing Landscape of Indian Capital Markets

How the Chinese Equity Market Responded to the Domestic and Global Coronavirus Outbreak

Two Birds, One Stone: How the S&P Paris-Aligned Climate Index Concept Meets the Proposed EU Climate Benchmark Regulation and the Recommendations of the TCFD

Contributor Image
Mona Naqvi

Global Head of ESG Capital Markets Strategy

S&P Global Sustainable1

As the world continues to pump the gas on a one-way street toward catastrophic climate change, market actors are attempting to slow down the traffic by limiting global temperature rise to within 1.5°C since pre-industrial levels.[1] To date, climate-conscious investors have largely focused on reducing relative portfolio carbon exposure. However, divergent methodologies make fertile ground for greenwashing, while point-in-time analyses do not necessarily inform alignment with the low-carbon transition. To address this, the EU is proposing regulation to prevent climate index greenwashing.[2] Global efforts such as the G20’s Task Force for Climate-related Financial Disclosures (TCFD) also seek to enhance transparency with guidance for holistic climate disclosure. A new S&P Paris-Aligned Climate (PAC) Index Concept now offers a powerful tool to address the minimum EU standards for a Paris-aligned benchmark and the recommendations of the TCFD.

Minimum Standards for EU Climate Benchmarks

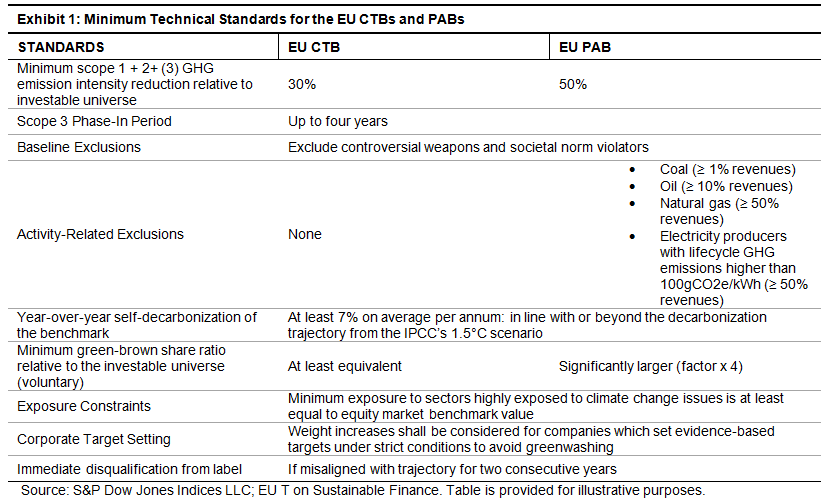
The EU’s action plan for financing sustainable growth proposes two new climate benchmarks: EU Climate-Transition Benchmarks (CTB) and EU Paris-Aligned Benchmarks (PAB), both using absolute measures to align with a 1.5°C trajectory rather than simply a relative carbon reduction. In 2019, an EU-appointed technical expert group (TEG) published a final report, which contains the proposed minimum standards. The final report will serve as the basis for the European Commission’s drafting of the delegated acts.

TCFD Recommendations

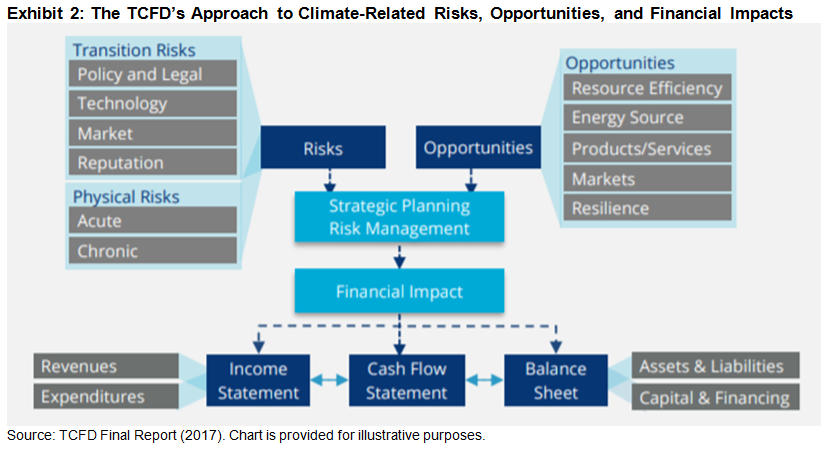
Two years prior, the TCFD released its recommendations for climate-related financial disclosures.[3] These include the financial impacts of climate-related risks and opportunities, comprising transition and physical risks (see Exhibit 2). The latter refers to physical hazards, for instance, more frequent and extreme weather events (storms, hurricanes, floods, etc.), weather pattern shifts, and sea-level rise. Physical risk thereby threatens companies facing asset-write downs, disruptions in supply chains, and costly insurance premiums,[4] whereas transition risk addresses the costs associated with the policy, legal, technological, market, and reputational risks from adapting to climate change. Conversely, the transition will also require USD 1 trillion of investment each year in gainful areas such as low-carbon energy and sustainable products.[5]

However, transition and physical risks are not a priori connected. The failure to transition to a low-carbon economy increases the likelihood and severity of physical risks, while the failure to mitigate physical risks suggests the market is not transitioning. Even under a 1.5°C scenario, physical risks will occur more frequently than at-present. A TCFD-aligned strategy must therefore account for both types of risk and the opportunities arising from climate change.

S&P Paris-Aligned Climate Index Concept

To meet the proposed EU regulation, S&P Dow Jones Indices has devised a new PAC Index Concept,[6] which additionally encompasses further objectives to align with a 1.5°C scenario and the TCFD.

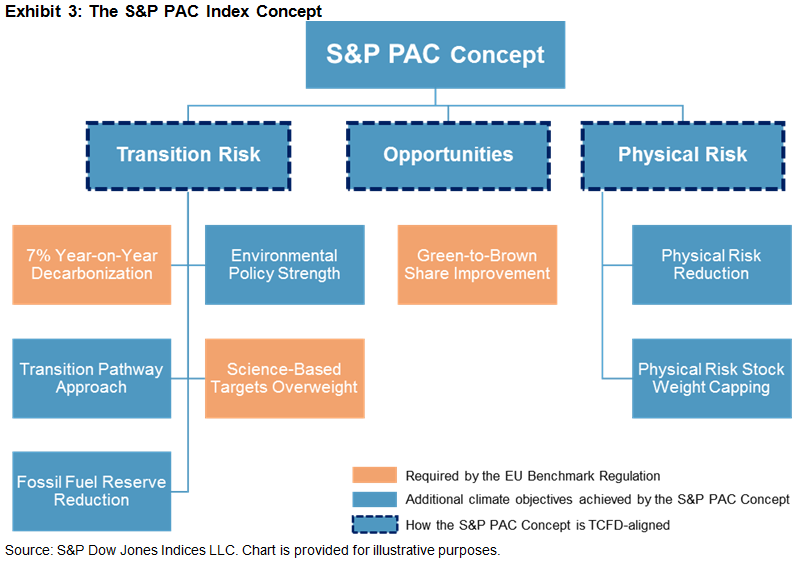
  • Transition Risk: The concept weights companies based on their ability to transition in alignment with a 1.5°C scenario, using Trucost data with transition-pathway models endorsed by the Science-Based Targets Initiative. Further measures include 7% year-over-year decarbonization to avoid overshoot, overweighting companies with strong environmental policies arguably better positioned for the transition,[7] overweighting companies that disclose science-based targets,[8] and reducing fossil fuel reserve exposure to mitigate stranded asset risk.
  • Physical Risk: The concept achieves a 10% reduction in physical risk exposure using state-of-the-art Trucost data, accounting for geolocation-specific risk and sensitivity of company assets to climate hazards.[9] Dynamic capping of individual company weights based on physical risk exposure also reduces tail risk.
  • Climate Opportunities: By improving the green-to-brown ratio relative to the underlying index, the S&P PAC Index Concept exhibits greater exposure to green power generation sectors expected to benefit from the transition.

These objectives are simultaneously incorporated while minimizing deviations from the underlying index, resulting in a broad, diversified index with similar performance to that of the underlying benchmark. The S&P PAC Index Concept thus offers a formidable new tool for meeting the proposed EU regulation—as well as a resilient and holistic approach to addressing climate risks and opportunities, as per the TCFD.

[1]   The aim of the Paris Agreement is to strengthen the global response to the threat of climate change by keeping global temperature rise well below 2°C above pre-industrial levels and to pursue efforts to limit the temperature increase even further to 1.5°C—see here. According to the Intergovernmental Panel on Climate Change (IPCC), climate adaptation will be less difficult under a 1.5°C scenario, as “our world will suffer less negative impacts on intensity and frequency of extreme events, on resources, ecosystems, biodiversity, food security, cities, tourism, and carbon removal”—see here.

[2]   In May 2018, the EU announced proposals to create two new climate benchmarks as part of its action plan for financing sustainable growth. In December 2018, the law creating these new benchmarks was officially enacted via amendment EU 2019/2089. An EU-appointed TEG later published its final report on climate benchmarks and benchmark ESG disclosure in September 2019, containing proposed minimum technical standards for these benchmarks that are still at the proposal stage. The report provides proposals to the European Commission that will be used to prepare the delegated acts.

[3]   See Final Report: Recommendations of the TCFD (June 2017), available here.

[4]   For example, in an attempt to curb global emissions, carbon taxes and emission trading schemes are increasing operating costs for carbon-intensive companies, while the substitution of existing products or technologies to lower carbon alternatives creates technology risk amid possible early retirement of assets. Further, shifts in consumer preferences for low-carbon substitutes and reputational damage to companies that are slow to adapt can erode brand value and ultimately decrease company revenues.

[5]   TCFD Final Report (June 2017), Executive Summary Page ii, available here.

[6]   For full details of the proposed S&P PAC Index Concept, see here.

[7] The S&P PAC Index Concept ensures improved environmental policy credentials, as measured by S&P DJI Environmental Scores. The scores provide insights into financially material aspects of a company’s climate strategy, environmental policy and management systems, electricity generation, environmental business risks and opportunities, low-carbon strategy, recycling strategy, co-processing, and more. To learn more about S&P DJI Environmental and ESG Scores, visit https://spdji.com/topic/esg-scores.

[8]   Subject to the conditions specified by the TEG to prevent greenwashing and encourage disclosure.

[9]   Trucost physical climate risk data covers hazards related to wildfires, cold waves, heat waves, water stress, sea-level risk, floods, and hurricanes. To learn more about Trucost physical climate risk data, see here.

The posts on this blog are opinions, not advice. Please read our Disclaimers.

SPIVA U.S. Year-End 2019 Scorecard: Active Funds Continued to Lag

Contributor Image
Berlinda Liu

Former Director, Multi-Asset Indices

S&P Dow Jones Indices

2019 was a remarkable year for risky assets. All benchmarks tracked in the SPIVA U.S. Year-End 2019 Scorecard delivered positive returns. Information Technology-heavy and more internationally diversified companies of the S&P 500® pushed the index to its second- and fourth-highest annual return since 2001 and 1990, respectively. In addition, the S&P MidCap 400® (26.2%) and S&P SmallCap 600® (22.8%) also delivered strong returns.

Active Funds: Strong Markets, Weak Performance

While these tailwinds helped U.S. equity managers, they still didn’t translate into active outperforming passive. Our latest SPIVA U.S. Scorecard shows that 70% of domestic equity funds lagged the S&P Composite 1500® over the one-year period ending Dec. 31, 2019. This is the fourth-worst performance since 2001.

Large-cap funds made it a clean sweep for the decade—for the 10th consecutive one-year period, the majority (71%) underperformed the S&P 500. Their consistency in failing to outperform when the Fed was on hold (2010-2015) or raising (2015-2018) or cutting (2019) rates deserves special note. Of the large-cap funds, 89% underperformed the S&P 500 over the past decade.

Are Mid- and Small-Cap Managers Truly Outperforming?

Mid-cap funds can claim some swagger when presenting to investment committees: 68% of mid-cap funds beat the S&P MidCap 400 in 2019, the third consecutive year the majority did so. Similarly, 62% of small-cap funds beat the S&P SmallCap 600. However, 84% of mid-cap funds and 89% of small-cap funds underperformed over the longer 10-year period.

However, one reason for the reasonably good performance of mid-/small-cap funds in 2019 could be performance divergence. In 2019, the S&P 500 outperformed the S&P MidCap 400 and S&P SmallCap 600. Arguably, mid-/small-cap managers could have outperformed their respective asset classes by shifting just a bit to larger caps; however, this strategy did not work in the long term because the three benchmarks showed much less divergence in the past 10 years.

Growth versus Value

In the past year, most value funds lagged their benchmarks across all market capitalizations. Over the past decade, however, we saw scant difference between growth and value funds’ likelihood of underperforming their benchmarks

Conclusion

As they say, the proof of the pudding is in the eating. If active managers cannot deliver outperformance over the long term, they should consider not remaining active!

The posts on this blog are opinions, not advice. Please read our Disclaimers.

The Trade-Off between Upside Participation and Downside Protection

Contributor Image
Tianyin Cheng

Former Senior Director, ESG Indices

S&P Dow Jones Indices

Financial market history is rife with prolonged bull market periods and deep corrections. With no proven way to correctly time the market, market participants can stay fully invested and attempt to capture the potential upside, but they also have to endure and recover from the full depths of drawdowns. Hence, some market participants may choose a tradeoff to mitigate the most severe downside by forgoing a portion of the upside.

We illustrate the intuition behind the tradeoff in a simple analysis. For example, if we had invested USD 1,000 in a portfolio tracking the S&P 500® in 1970, after 50 years, it would be worth USD 125,458. That number would drop by half to USD 56,389 if we missed the 10 best days, or almost triple to USD 359,233 if we avoided the 10 worst days.

Exhibit 1 highlights varying degrees of hypothetical tradeoffs between upside participation and downside capture—if one were able to capture 10%, 20%, 30% … return on the 10 worst days and 90%, 80%, 70%… return on the 10 best days. For example, the 10/90 Best/Worst % Capture portfolio would capture 10% of the returns on each of the 10 best days and 90% of returns on each of the 10 worst days.

The shape of the tradeoff curve shows that the 50/50 trade-off scenario (green dot in Exhibit 1) outperformed the S&P 500 with lower volatility. This implies that investors can indeed trade substantial upside participation for downside mitigation and still maintain the potential to come out ahead.

This observation is especially relevant for investors relying on their investments for retirement income, as they need protection from short-term drawdowns. Withdrawals for annual living costs make it hard to recover from those losses, and an adverse sequence of market returns may accelerate the depletion of their accounts.

The S&P Managed Risk 2.0 Index Series is designed based on the observation around this trade-off. The indices dynamically adjust the exposure between a risky asset and a reserve asset to target a predefined volatility level and add an additional layer of capital management, with the cost of protection embedded in the strategy and financed through the reserve asset in the form of a synthetic put hedge.

The strategy dials down participation in risky assets when market volatility is high, and hence aims to avoid the most severe down days. In order to achieve this, it gives up some participation in the up market days, as protection comes with costs. When the market is stable, on the other hand, the strategy increases allocation to risky assets and maintains full equity allocation in calm periods.

In the first quarter of 2020, the S&P 500 Managed Risk 2.0 Index demonstrated its potential ability to provide protection. The index quickly de-risked by allocating to safer assets—a change from full allocation to equity on Feb. 20, 2020, to a mere 17% equity allocation as of the end of March 2020. As a result, it maintained volatility at one-third of the S&P 500 and reduced drawdown by half of the S&P 500.

Not only that, the 30-year historical performance showed that the S&P 500 Managed Risk 2.0 Index would indeed provide a much better outcome for retirees, when it is used as a construction tool in a core portfolio.

Following 30 years of decumulation using the back-tested data from March 1990 to March 2020, the account value under the managed risk approach was 111% more than the account value using the traditional 70/30 equity/fixed income blend.  When withdrawals are factored in, the relative excess value generated by the managed risk approach was not merely maintained, but improved upon.

Markets time and time again prove that they are susceptible to large shocks and difficult to time accurately. For those concerned about extreme drawdowns and are willing to give up a portion of their upside potential, strategies such as S&P Managed Risk 2.0 Indices can play a role in smoothing out returns.

The posts on this blog are opinions, not advice. Please read our Disclaimers.

COVID-19’s Role in the Changing Landscape of Indian Capital Markets

Contributor Image
Ved Malla

Associate Director, Client Coverage

S&P Dow Jones Indices

In the past five years, capital markets in India have witnessed bull and bear phases. The bulls accounted for most of the five-year period; however, Q1 2020 completely changed this landscape. Due to the COVID-19 outbreak, capital markets have taken a beating both globally and locally in India.

Exhibit 1 and 2 showcase the five-year returns for India’s leading size indices.

From Exhibits 1 and 2, we can see that the returns were promising for large-, mid-, and small-cap segments through December 2019; however, the scenario completely changed in Q1 2020. The returns of the large-cap segment were better than the small- and mid-cap segments across the five-year period. The S&P BSE SENSEX, which comprises the 30 largest and most liquid BSE-listed companies in India, outperformed all size indices.

Exhibits 3 and 4 showcase returns for the 11 leading sector indices in India in the past five years.

From Exhibits 3 and 4, we can see that the S&P BSE Energy and S&P BSE Fast Moving Consumer Goods posted promising returns, while the S&P BSE Healthcare, S&P BSE Telecom, and S&P BSE Industrials posted negative returns for the five-year period. All the sectors had negative returns in the Q1 2020.

To summarize, we can say that the bulls had their way during most of the five-year period across all sizes and most sectors through December 2019; however, due to the COVID-19 outbreak, things went south at Dalal street as markets tumbled across all sizes and all sectors during Q1 2020, especially during March.

The posts on this blog are opinions, not advice. Please read our Disclaimers.

How the Chinese Equity Market Responded to the Domestic and Global Coronavirus Outbreak

Contributor Image
Priscilla Luk

Managing Director, Global Research & Design, APAC

S&P Dow Jones Indices

As the coronavirus has spread across continents, countries around the world are experiencing a slowdown in economic activity and volatility in the financial markets. The S&P Pan Asia BMI and S&P 500® lost 20.5% and 20.0%, respectively,[1] in the first quarter of 2020. During the same period, the S&P China A Domestic BMI and S&P China 500 (which seeks to track the top 500 domestic and offshore listed Chinese companies) dropped 9.5% and 10.3%, respectively,[2] which was only half of the loss suffered by the U.S. and Pan Asian markets.

In response to the domestic coronavirus outbreak, the China A-shares market experienced a significant drawdown of 14.2% between Jan. 20 and Feb. 3, 2020, when the number of new cases of coronavirus infections in China was on the rise. However, the market has recovered most of its losses since Feb. 3, 2020, as a result of government stimulus packages and improved investor sentiment due to a slowing domestic infection rate.[3] Business activities began to pick up in China subsequently, and the National Bureau of Statistics announced the China Manufacturing Purchasing Managers’ Index rebounded to 52.0 in March from 35.7 in February. Nevertheless, global equity market sentiment turned to panic as investors expected a global recession due to the worsening coronavirus outbreak in the rest of the world. The S&P 500 and S&P Pan Asia BMI declined by 33.7% and 27.8%, respectively, between Feb. 20 and March 23, 2020, while the S&P China A Domestic BMI and S&P China 500 suffered smaller losses of 14.1% and 17.5%, respectively.

Before coronavirus infection accelerated in the rest of the world, the rate of domestic outbreak in mainland China was the determinant driver of the Chinese equity market performance. During the market decline between Jan. 20 and Feb. 3, 2020, the vast majority of industries suffered losses; however there was a significant spread in industry returns, from 3.2% to -17.9%. Health care equipment, health care technology, and biotech were top-performing industries due to the threat of the outbreak. As cities in China were locked down and travel was restricted to control the outbreak, airlines, retailers, restaurants, and hotels took a hard hit, while companies in interactive media, internet retail, and food and staples retailing were least affected. Semis, software, electronic equipment, and tech hardware companies were also less hammered by the domestic virus outbreak and they were among the top performers during the market rally between Feb. 3 and Feb. 20, 2020, when coronavirus infection rates slowed in mainland China.

The acceleration of coronavirus infection in the rest of the world, especially in the U.S. and Europe, heightened investor concern around a global recession, which was expected to also slow economic activity recovery in China. Based on companies in the S&P Total China Domestic BMI, electronic equipment, household durables, semiconductors, auto components, and tech hardware are the larger industries with high foreign revenue exposure, ranging from 29.9% to 58.7%. Revenues of these industries are more vulnerable to global economic slowdown compared to other industry peers. In contrast, interactive media, real estate management, and wireless telecom services have low exposure to foreign revenue, ranging from only 0.8% to 2.5%, and their revenues are dominated by domestic demand. In the recent global stock market crash (Feb. 20-March 23, 2020), the 10 industries with the highest foreign revenue share dropped 23.2%, while the 10 industries with lowest foreign revenue share only dropped 14.6%. Overall, only 14.4% of total revenue across all companies in the S&P Total China Domestic BMI are sourced outside of China, which implies that the revenues of these companies would largely follow the pace of domestic demand rather than international market demand. This was reflected in the smaller losses seen in the Chinese equity indices during the recent global market crash.

[1]   USD price returns between Dec. 31, 2019, and March 31, 2020.

[2]   USD price returns between Dec. 31, 2019, and March 31, 2020.

[3]   The spike in new infection cases on Feb. 12-13, 2020, was due to Chinese authorities changing the manner in which infection cases were tracked, aiming to include more cases for more timely treatment and allow faster quarantining of patients.

The posts on this blog are opinions, not advice. Please read our Disclaimers.