Get Indexology® Blog updates via email.

In This List

The S&P Eurozone Paris-Aligned Climate Index Concept: A Greenwashing Minimization Approach to High Climate Impact Sector Neutrality

No Gas Left in the Tank for Energy Equities

The Virtue of Protection

The S&P Eurozone Paris-Aligned Climate Index Concept: Implementing the Proposed EU Climate Benchmark Regulation

Cushioning the Decline

The S&P Eurozone Paris-Aligned Climate Index Concept: A Greenwashing Minimization Approach to High Climate Impact Sector Neutrality

Contributor Image
Ben Leale-Green

Former Associate Director, Research & Design, ESG Indices

S&P Dow Jones Indices

In January 2020, S&P Dow Jones Indices released a paper for the S&P Eurozone Paris-Aligned Climate Index Concept (PAC Concept). The PAC Concept aims to align with the proposals of the EU Technical Expert Group on Sustainable Finance (TEG), as published in its Final Report on Climate Benchmarks and Benchmarks’ ESG Disclosure dated September 2019,1 for the Paris-Aligned Benchmark—the more stringent of the two benchmarks proposed by the EU. Furthermore, the PAC Concept aims to align with the TCFD’s recommendations on Climate Related Financial Risks and Opportunities. Since publication of the paper, we have received a lot of feedback on our approach, particularly with respect to the application of high climate impact sector neutrality.2

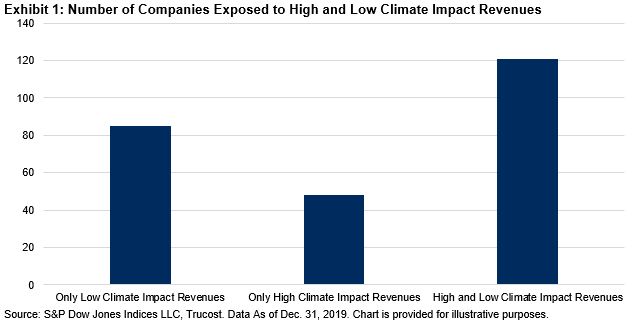
The PAC Concept uses “Trucost3 sector” data, which has been mapped to the NACE4 sections defined as high emitting.5 There are 464 “Trucost sectors,” which are based on revenue streams. Therefore, companies can have exposure to multiple different “Trucost sectors” and by extension, exposure to both high and low climate impact sectors. This can be seen in Exhibit 1, where more companies have a mix of high and low climate impact revenue streams than those with only low impact or only high impact.

The PAC Concept’s granular view on revenues from high climate impact sectors ensures the same revenues, per dollar invested, as the underlying index. This objective would not be achievable if we only used company-level sector classification. This helps to minimize any unintentional greenwashing from index design within the TEG proposed high climate impact sector framework when company classifications are applied, rather than revenue classifications. Constructing the index using sector classifications means index design can transfer weight into companies with far less exposure to high-climate-impact sectors, as opposed to companies with more carbon-efficient practices. The latter are likely to be at the forefront of the low-carbon transition.

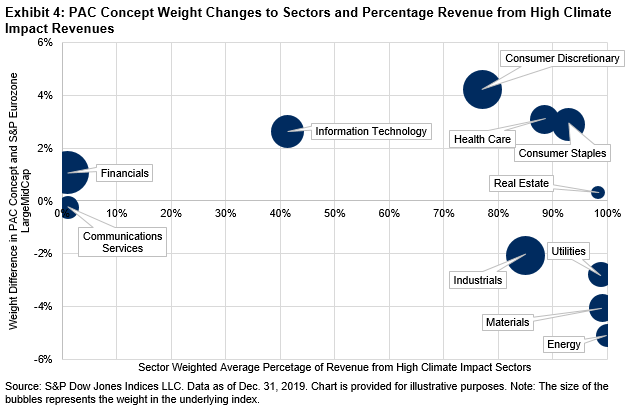
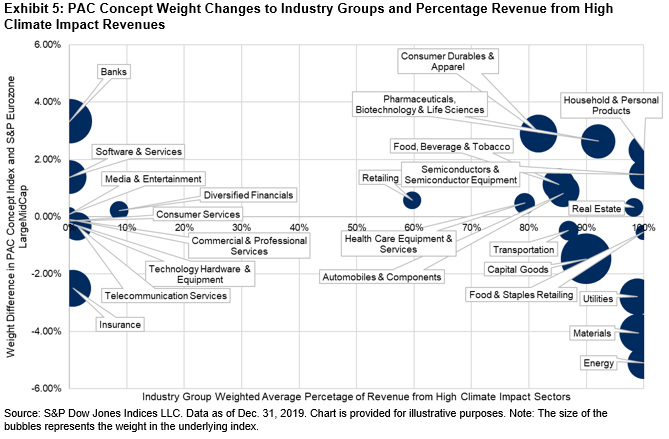
There are revenues from both high and low climate impact sectors6 in most GICS® sectors (see Exhibit 2). The same is observed within GICS industry groups (see Exhibit 3).

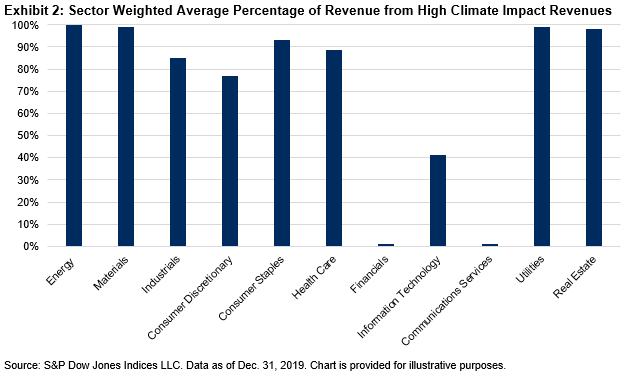
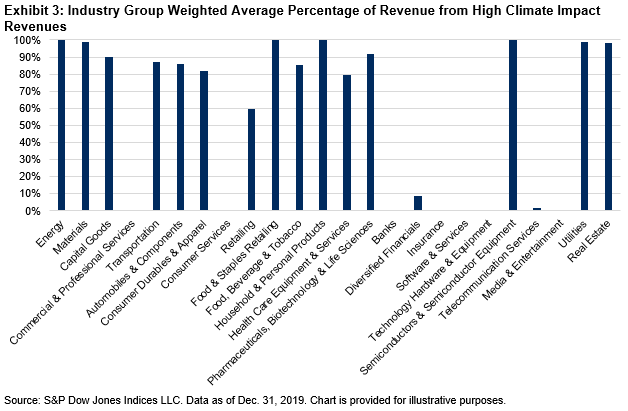
Exhibit 4 shows where large weights from Energy and Materials may have been placed within high climate impact revenue streams. The X axis shows the percentage of revenues coming from high climate impact sectors and the Y axis shows the difference in sector weight between the parent index and PAC Concept. The size of the bubbles represents the weight of each sector within the parent index.

We can see weight being taken from Energy and Materials. A lot of this weight appears to be redistributed into Consumer Staples and Health Care. These two sectors had slightly less exposure to high climate impact sectors; however, this was where much of the weight ended up. There was also an overweight of the Consumer Discretionary sector, which has high climate impact exposure.

GICS industry group analysis shows a similar story at the more granular level. Household & Personal Products, Pharmaceuticals, Biotechnology & Life Sciences, and Semiconductors & Semiconductor Equipment all saw overweighting, while having high exposure to high climate impact sectors.

1 The EU Technical Expert Group on Sustainable Finance Final Report on Climate Benchmarks and Benchmarks’ ESG Disclosure, September 2019. The final report will serve as the basis for the European Commission for the drafting of the delegated acts under Regulation 2019/2089.

2 Climate Impact Sector neutrality is mandated by TEG in its Final Report.

3 A part of S&P Global.

4 NACE (a French term “nomenclature statistique des activités économiques dans la Communauté européenne”) is a revenue-based sector classification used within the European Union.

5 High climate impact sectors as defined by the TEG in the Final Report.

6 The percentage of revenues has been calculated as the weighted average of the percentage of each company’s revenues from high climate impact sectors, weighted by their weight in the S&P Eurozone LargeMidCap.

The posts on this blog are opinions, not advice. Please read our Disclaimers.

No Gas Left in the Tank for Energy Equities

Contributor Image
Jim Wiederhold

Former Director, Commodities and Real Assets

S&P Dow Jones Indices

In our blog post from December 2019,[1] we highlighted the disparity seen last year between different sectors of the commodity futures and commodity equities markets. The second thing to watch highlighted the substantial 25% performance difference in 2019 between the S&P GSCI Energy and the S&P GSCI Equity Commodity Energy Index. However, so far in 2020, these different asset classes have moved in lockstep (see Exhibit 1). The other noticeable takeaway is the complete reversal of last year’s positive performance across the different commodity equities.

There were justified reasons for the disparity last year. In 2019, energy equities underperformed due to bearish market sentiment associated with high debt levels present across the sector. We highlighted how our colleagues at S&P Global Ratings expect the Energy sector to lead in terms of defaults over the next five years. This may prove to be correct much more quickly than expected, with crude oil prices plummeting below breakeven levels of production. Energy is so far the worst-performing sector in the S&P 500® this year, dropping initially due to the COVID-19 outbreak and then collapsing further by more than a six-sigma move after the end of the OPEC+ alliance. With Russia and Saudi Arabia engaging in a new market share battle, oil prices raced to decade lows. The highly levered U.S. energy names that comprise the S&P Equity Commodity Energy Index are now facing one of the toughest times in recent memory.

The S&P GSCI Energy was already the worst-performing commodity sector prior to the collapse in oil prices on March 9, 2020. Several negative catalysts that have been building over the past few years have arguably come to a head in the energy complex: the global push toward ESG-based investing is reducing investors’ appetites for companies with higher carbon emissions, U.S. shale oil production has expanded at breakneck speed, and the multi-year alliance of OPEC+ to prop up crude oil prices by production cuts has collapsed.

Unsurprisingly, the energy bond market has also taken a hit this week. In S&P Dow Jones Indices’ March 12th Daily Dashboard, Chris Bennet highlights the present concern in the energy credit markets, where the option-adjusted spreads for the S&P 500 Energy Corporate Bond Index are double the next-closest sector. For market participants looking for commodity exposure, it is important to consider the different instruments available to them, even in situations where the short-term performance impact of supply and demand shocks are similar.

[1] Commodities – What to Watch for in 2020.

The posts on this blog are opinions, not advice. Please read our Disclaimers.

The Virtue of Protection

Contributor Image
Fei Mei Chan

Former Director, Core Product Management

S&P Dow Jones Indices

It remains to be seen what the full economic impact of the COVID-19 virus will be, but it is already clear that no equity market  has escaped unscathed.  (In fact, most of them have been scathed rather badly.) The Canadian equity market was humming along in 2020 through February 20, 2020, with the S&P/TSX Composite climbing 5.5% in almost two months. Since then, things have taken a decided turn for the worse, as the index dived 16.5%. Overall, the index is down 11.9% year to date through March 10.

It’s not surprising to see that the S&P/TSX Composite Low Volatility Index has managed to weather the stormy environment well. That’s what it was designed to do, by offering a shield in the bad times while still participating in the good times. Low Vol will typically go up less when the market is rising and go down less when the market is falling.

Since the February 20th peak, the low volatility index fell 11.4% compared to the 16.5% decline of the TSX Composite. This is expected; Low Vol should decline less than the market. But it also uncharacteristically outperformed when the market was doing well, up 8.1% compared to 5.5% for the parent index. This allowed Low Vol to gain an extra cushion for its performance year to date, outperforming the S&P/TSX Composite by an impressive 7.6% (S&P/TSX Composite: -11.9%, S&P/TSX Composite Low Volatility: -4.2%). This phenomenon isn’t limited to the Canadian market, the strategy offered a similar protection in U.S. equity markets as well.


The posts on this blog are opinions, not advice. Please read our Disclaimers.

The S&P Eurozone Paris-Aligned Climate Index Concept: Implementing the Proposed EU Climate Benchmark Regulation

Contributor Image
Ben Leale-Green

Former Associate Director, Research & Design, ESG Indices

S&P Dow Jones Indices

Introduction

In January 2020, S&P Dow Jones Indices (S&P DJI) released a paper for the S&P Eurozone Paris-Aligned Climate Index Concept (PAC Concept).  The PAC Concept conceptualizes the proposals of the EU Technical Expert Group on Sustainable Finance (TEG), as published in its Final Report on Climate Benchmarks and Benchmarks’ ESG Disclosure dated September 2019,[1] for the Paris-aligned benchmark and incorporates transition risk, physical risk, and climate opportunities, as laid out by the TCFD[2] (see Exhibit 1).  The PAC Concept implements innovative and forward-looking Trucost[3] datasets: physical risk and the transition pathway approach.  This blog outlines two methods, which the PAC Concept applies to meet the TEG’s proposals.

7% Year-on-Year Decarbonization

To align with the TEG’s proposals for the Paris-aligned benchmark, a 50% carbon footprint reduction and decarbonization[4] by 7% year-on-year are required. Complexity lies in the 7% year-on-year decarbonization: this must occur not only at rebalance but also when calculated using average weights over the period. Consequently, as weights drift between rebalances, the carbon footprint must stay below the 7% year-on-year trajectory on average. Therefore, the PAC Concept’s trajectory targets 5% below the required level of decarbonization and is rebalanced quarterly.  This allows for intra-rebalance weight fluctuations, while remaining compliant.

The middle line in Exhibit 2 shows the required 7% year-on-year decarbonization, the yellow line represents the carbon intensity of the parent index, and the bottom line the PAC Concept’s carbon intensity, measured using average weights.[5] Over the period, the parent index’s carbon intensity decreases then increases—a good methodology test for the PAC Concept.  The PAC Concept’s carbon intensity starts to increase toward the trajectory line; however, at rebalance the index’s decarbonization buffer[6] forces it below required carbon intensity.

Exclusions

The TEG’s proposals also require certain exclusions. These exclusions are based on:

  • Controversial weapons;
  • Societal norms (which the PAC Concept tackles through the use of UN Global Compact exclusions);
  • Severe controversies surrounding environmental issues (the PAC Concept excludes severe controversies in all areas of ESG);
  • Coal exposure;
  • Oil exposure;
  • Natural gas exposure; and
  • Highly intensive electricity generation.

Exhibit 3 outlines the exclusions that have been implemented.

Please refer to the PAC concept paper for further details.

[1]   The EU Technical Expert Group on Sustainable Finance Final Report on Climate Benchmarks and Benchmarks’ ESG Disclosure, September 2019. The final report will serve as the basis for the European Commission for the drafting of the delegated acts under Regulation 2019/2089.

[2]   TCFD. (2017). Final Report: Recommendations of the Taskforce on Climate Related Financial Disclosures.

[3]   A part of S&P Global.

[4]   Decarbonization refers to the reduction of an index’s carbon footprint.

[5]   As advised by the TEG.

[6]   The buffer is referring to targeting below the 7% year-on-year trajectory line.

The posts on this blog are opinions, not advice. Please read our Disclaimers.

Cushioning the Decline

Contributor Image
Craig Lazzara

Former Managing Director, Index Investment Strategy

S&P Dow Jones Indices

With the S&P 500 down -14.7% for calendar 2020, and -18.8% since its peak in late February, investors are rightly concerned to identify strategies that might help to mitigate the ongoing decline.  A number of defensive factor indices have performed relatively well in March, but the leader for the year so far is S&P 500 Low Volatility.

Aficionados of our low volatility index family are probably tired of hearing me say that these indices are designed to deliver participation and protection.  They aim to participate in rising markets, and to protect investors in falling markets, with the important caveat that neither participation nor protection are perfect.  A low vol strategy should be expected to lag the total return of a strong market, although still delivering a positive result.  In falling markets, low volatility may well show a negative total return, although it should normally outperform the benchmark index from which its constituents are drawn.  The market’s action in 2020 provides a window on both participation and protection.

There have been two market regimes so far in 2020: a rising market between the turn of the year and the S&P 500’s peak on February 19, and a falling market between then and (as of this writing) March 9.  The chart below illustrates returns for both the S&P 500 and S&P 500 Low Volatility since the turn of the year.

Exhibit 1
Source: S&P Dow Jones Indices. Data from Dec. 31, 2019 through March 9, 2020. Charts are provided for illustrative purposes. Past performance is no guarantee of future results.

The relative performance picture become clearer when we separate the year’s two regimes, as shown below.  Low Volatility outperformed both when the market rose and during its retrenchment.  The former period is the more remarkable since we typically expect Low Vol to underperform a rising market.  Part of the explanation comes from the strong performance of the Utilities and Real Estate sectors, which are the two biggest overweights in the Low Vol portfolio.

Source: S&P Dow Jones Indices. Data from Dec. 31, 2019 through March 9, 2020. Charts are provided for illustrative purposes. Past performance is no guarantee of future results.

The exact course of future market moves is of course unknowable.  One of the strongest arguments for low volatility strategies is that, by cushioning the pain of market pullbacks, they make it easier for investors to maintain their long-term equity positions.

The posts on this blog are opinions, not advice. Please read our Disclaimers.