Where we stand in the economic cycle can have a measurable effect on sector performance
There are many determinants of stock performance. Corporate earnings, fiscal policy and interest rates can all influence the equity markets. But equity returns are also dependent on where we stand in the economic cycle.
Some sectors, such as industrials and financials, tend to display strong performance early in the economic cycle when economic growth is accelerating. Other sectors, like utilities and consumer staples, tend to be strongest very late in the economic cycle when economic growth is weakest.
How do we know this?
The correlation between excess returns and economic cycles
Consider the table below, which displays the excess price return of the 10 sectors that make up the S&P 500 Index over a roughly 17-year period, from October 2001 through April 2018. (Here, I am defining excess returns as the price of each sector minus the price of the S&P 500 Index.) I’ve segregated returns by economic cycle, defined by the position of the Institute of Supply Management Manufacturing Index (ISM Manufacturing Index), which is a broad barometer of manufacturing activity in the US.
As you can see from the chart below, the ISM Manufacturing Index has historically tracked year-over-year changes in earnings per share (EPS) growth for the S&P 500 Index. In fact, the correlation between year-over-year EPS growth and the ISM Manufacturing Index over the 17-year period was a robust 0.60, indicating a strong correlation between economic cycles and corporate profit growth. This correlation can be useful in framing sector performance relative to economic cycles, represented by the swells and dips in the ISM Manufacturing Index.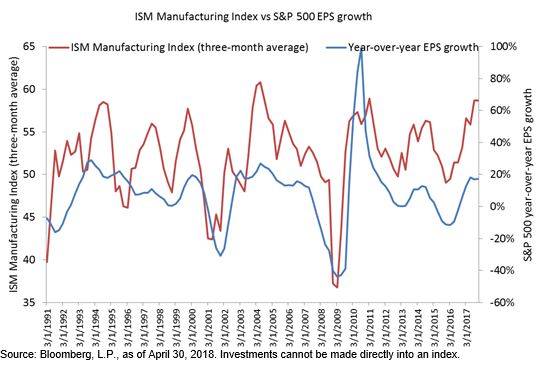
Where are we in the current economic cycle?
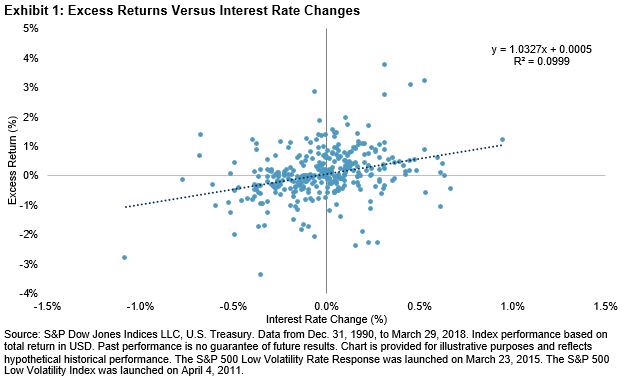
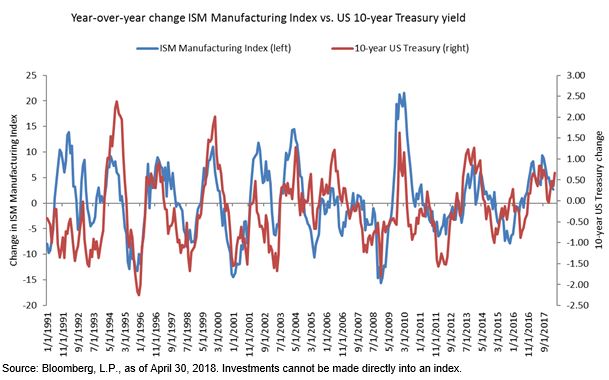
The ISM Manufacturing Index also displays a vibrant relationship to interest rates, further highlighting its ability to capture economic cycles. Historically, the one-year change in the 10-year US Treasury yield has coincided with the one-year change in the ISM Manufacturing Index, as evidenced by a 0.52 correlation. As of April, the ISM Manufacturing Index was 57.3 below its February 2018 peak of 60.8. In my view, this suggests that US economy is mid-cycle, but on its way to being late-cycle.
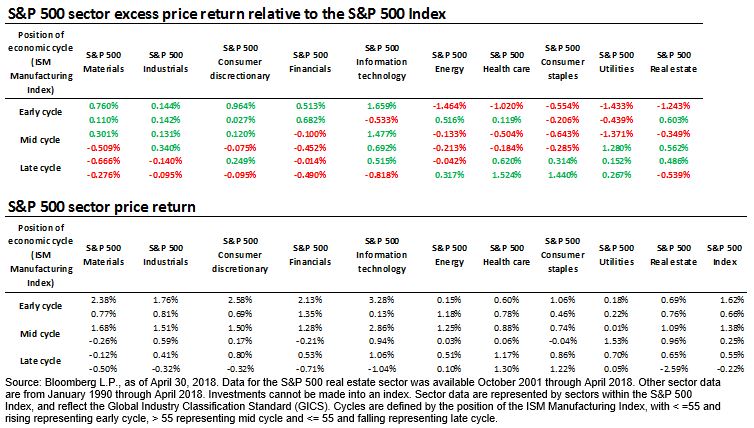
- Materials have tended to underperform when the ISM Manufacturing Index is falling from its cycle peak, and have tended to outperform when the index is increasing. The excess return of the materials sector now looks quite cyclical following the direction of the ISM Manufacturing Index.
- Utilities also display cyclicality, but their excess return moves opposite to the excess return of materials. Utilities have historically generated excess returns when the ISM Manufacturing Index was falling and have underperformed when the index was rising.
- Consumer staples stocks are cyclical as well, displaying past weakness during periods when the ISM Manufacturing Index was rising through the early phase of a decline in the index. However, this sector has historically outperformed later in the cycle when the ISM Manufacturing Index was below 55 and falling.
- Health care has historically performed somewhat like consumer staples — performing best very late in the cycle and poorly early in the cycle.
- Industrials have historically been weakest very late-cycle when the ISM Manufacturing Index was under 55 and falling, but have shown strength through the upward cycle of the index (under 50 and rising, 50 to 55 and rising, and over 55 and rising). Moreover, industrials have a history of generating excess return very early in the downside cycle (ISM Manufacturing Index over 55 and falling). Conversely, industrials have historically performed most poorly very late in the cycle when the index was under 55 and falling.
- Financials have historically shown the greatest strength early-cycle when the ISM Manufacturing Index was rising from under 50 through the 50-to-55 range. They were weakest very late-cycle when the index was falling. Fallout from the housing bubble and global financial crisis may have distorted some of the cyclical influences since 2008.
- The performance of information technology has historically been choppy throughout economic cycles. The potential for technology to provide innovation may have muted the influence of the economic cycle on performance. However, technology has historically shown to perform very poorly very late-cycle and most strongly very early-cycle.
- Energy stocks are likely more sensitive to the price of oil, oil products and natural gas than the economic cycle. Their past performance relative to the ISM Manufacturing Index seems mixed, which may simply be random, rather than indicative of a clear pattern.
- Real estate — particularly real estate investment trusts (REITs) — has historically displayed strength mid- to late-cycle (over 55 and falling, and 50 to 55 and falling), and relative weakness very late-cycle (under 50 and falling) and very early cycle (over 50 and rising). REITs can be tricky, as they are often influenced by both interest rates and rent patterns. Rents could be under pressure very late- and very early-cycle, and strong through periods of the middle cycle.