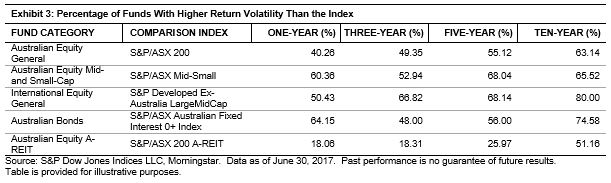
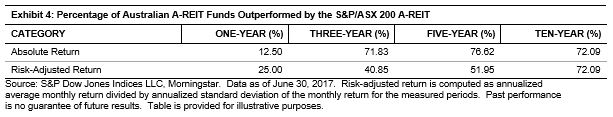
In the first three quarters of 2017, green bond issuance reached USD 83 billion, nearing the issuance reported by the Climate Bond Initiative for full-year 2016 (see Exhibit 1). France accounted for 18% (USD 14.8 billion) of the issuance, driven primarily by the USD 7.6 billion sovereign bond issued by the country in January. Commercial banks issued 44% of the USD 12.4 billion of capital raised in China to fund green projects. U.S. municipals continue to account for about half of the U.S. issuance YTD, however asset-backed securities continue to increase market share. Fannie Mae, a newcomer in 2017, issued its fourth green ABS in August, bringing its YTD total to USD 1.8 billion of USD 11.4 billion issued in the U.S. market through the end of Q3 17 (see Exhibit 2).
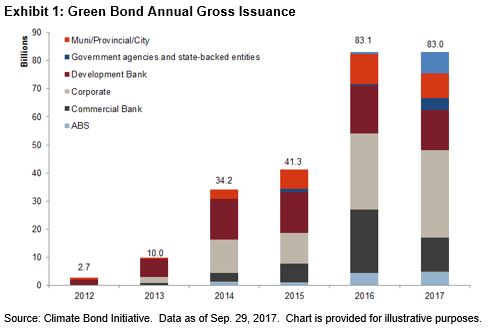
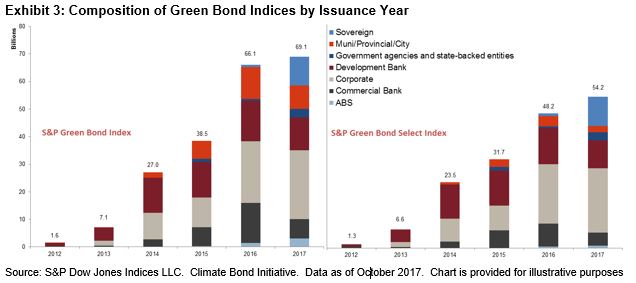
Over 80% of the green bonds issued in 2017 have qualified for the S&P Green Bond Index, which is designed to track the global green market. Nearly 80% of those bonds have qualified for the S&P Green Bond Select Index, which further limits exposure subject to stringent financial and extra-financial eligibility criteria (see Exhibit 3). As of Sept. 29, 2017, the global green market has USD 232.2 billion of outstanding debt, USD 209.7 billion of which is included in the S&P Green Bond Index and USD 165.7 billion in the S&P Green Bond Select Index.
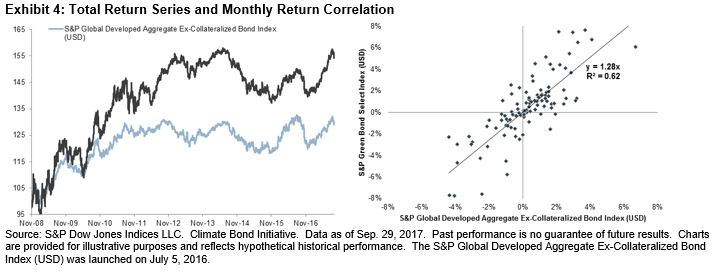
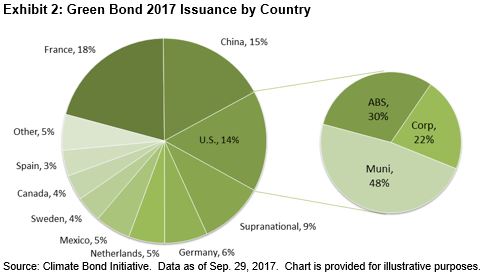
The continuing trend of broader representation by issuers, asset types, and currencies makes the S&P Green Bond Index a suitable substitute for global aggregate exposure. In terms of performance, monthly returns are highly correlated with the S&P Global Developed Aggregate ex-Collateralized Bond Index (USD) (see Exhibit 4).