Get Indexology® Blog updates via email.

In This List

Listed Infrastructure: Bridging the Inflation Hedging Gap

The MENA Sukuk Market Expanded 14% YTD

India: Market Update for Q3 2015

Terror Attack On Paris May Shift The Oil War

ETF industry in India over the years

Listed Infrastructure: Bridging the Inflation Hedging Gap

Contributor Image
Jon Winslade

Senior Director, Wealth Management Channel

S&P Dow Jones Indices

Roger McNamee, the American businessman and sometime musician said “We need to stop thinking about infrastructure as an economic stimulant… [since] economic stimulants produce Bridges to Nowhere. Strategic investment in infrastructure produces a foundation for long-term growth.” In 2013, Transportation for America identified that one in nine U.S. bridges—a jaw-dropping 66,000 of them—are deficient, and they are a striking example of the USD 1 trillion per year global infrastructure spending gap identified by the World Economic Forum last year.

If—as McNamee trumpets—infrastructure investment promotes growth, owners of large pools of capital should, by design, be interested. Global pension assets are one such reservoir, totaling around USD 40 trillion and predicted to increase to USD 65 trillion1 by 2020, yet less than 1% of aggregate pension assets are invested in infrastructure, and those funds that are sold on the investment benefits are finding a persistent gap between actual investment (2.9%) and their target allocations (3%-5%).2 The asset class is attractive to institutional investors looking for growth and inflation hedging, with investment return expectations for “Core” and “Core Plus”—investments in societal staples such as bridges, rail, roads, and airports—near 7%-13% per year.3

So why is the channel between spending requirements and return seekers seemingly unbridged? Three possibilities exist. First, the availability of suitable investment opportunities seems limited, as characterized by unallocated investment capital, which is at a record level of USD 100 billion.4 Second, the median pension fund infrastructure investor size is USD 6 billion,5 pointing to expertise and governance requirements many funds consider beyond their scope. Third, in a pensions management world where there is persistent and relentless focus on cost, specialized infrastructure manager fees of 2% and 10% of excess return over 8%6 are out of kilter. Infrastructure returns—in this context—seeming to have high barriers to entry.

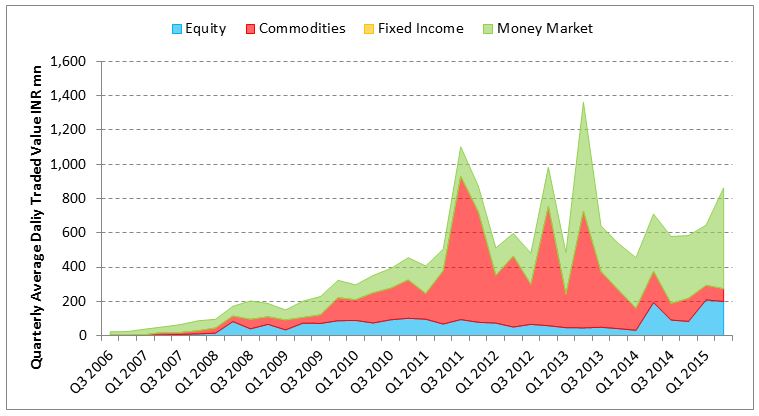
But do they? A growing globally listed equity market now capitalized at approximately USD 3.5 trillion, with daily average trading volumes of USD 15 billion,7 affords funds the liquidity many desire, as well as a “governance advantage” due to the stringent regulatory demands and reporting requirements of listing. So far so good then—but what do the returns look like when holding liquid investments for the long term?

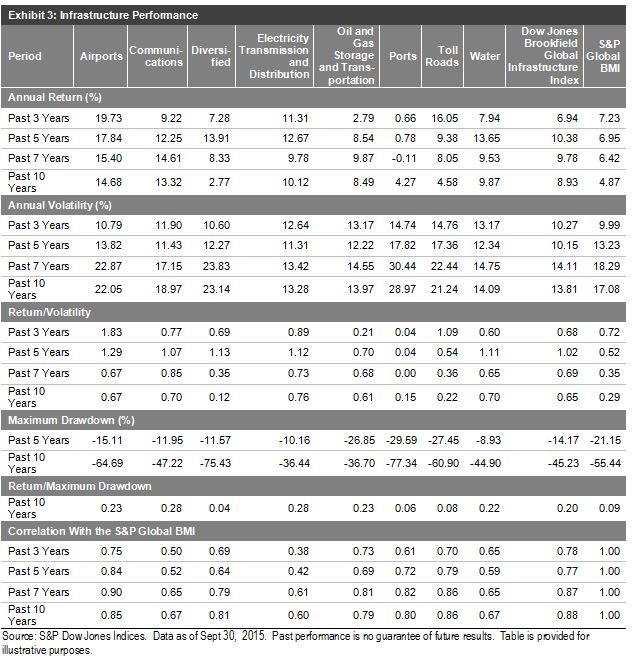
Two interesting outcomes can be observed. First, 10-year annualized returns—as represented by the Dow Jones Brookfield Global Infrastructure Index—compare favorably to the top end of the “Core Plus” range of return expectations (10%-13%).

Capture

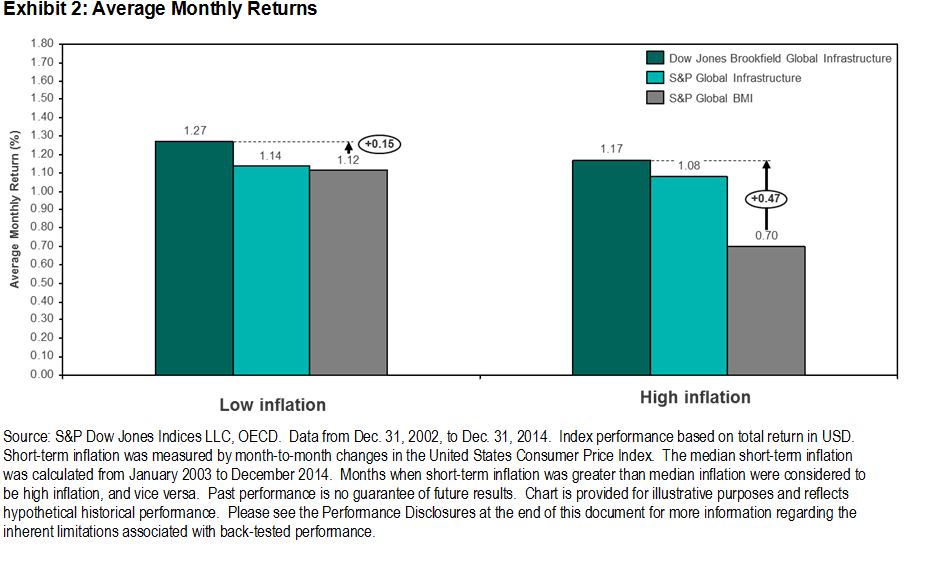
Second, discernible inflation-hedging characteristics—one of the most desirable characteristics of infrastructure investing5—are present for historical infrastructure equity buy and hold approaches, with a 47 bps monthly excess return in high inflation scenarios seen over broad equity from 2004-2014.

Capture

Of course, equity exposure comes with equity risk, although the average 10-year annualized volatility of 13.8% for infrastructure equity versus 17% for global broad equity, along with the notably reduced maximum drawdowns for infrastructure, is observed.

Capture

In recent times, such notable names as AP4 and NZ Super have invested in infrastructure through listed securities.8 With exposure to desirable characteristics of return and inflation protection also possible in the cost efficient, indexed manner so many pension funds now embrace, listed markets could bridge the perceived governance and expertise gap bringing the asset class in closer reach to even the smallest funds without the (toll) fees that have historically been the norm.

1 PwC: Asset Management 2020 A Brave New World
2 2015 Preqin Global Infrastructure Report
3 Towers Watson, CBRE Clarion Securities, Caledon Capital Management
4 Infrared Asset Management via Real Assets Advisor Vol.2 No. 12 Nov 2015
5 Institutional Investing in Infrastructure I3 Investor Survey Summary Report
6 CFA Institute: Benchmarks for Unlisted Infrastructure by Singh, Orr and Settel
7 Brookfield Investment Management
8 OECD: Trends in Large Pension Fund Investment in Infrastructure Nov 2012

The posts on this blog are opinions, not advice. Please read our Disclaimers.

The MENA Sukuk Market Expanded 14% YTD

Contributor Image
Michele Leung

Former Director, Fixed Income Indices

S&P Dow Jones Indices

The Middle East and North Africa (MENA) region recorded strong growth in the sukuk market in the first 10 months of 2015.  The market value, as tracked by the S&P MENA Sukuk Index, rose 14% YTD to 37 billion, compared with the mere 1% growth in the conventional bond market in the region.  The sukuk market has expanded 37% since the S&P MENA Sukuk Index’s inception in July 2013.  United Arab Emirates is the most active issuing country in the region, and it remains dominant in terms of country exposure at 52%, followed by Saudi Arabia at 17%.

Overall, governments have continued to diversify their funding platforms, and the global sukuk market has witnessed solid support from the lack of primary supply.

Looking at the indices’ total return performance, there has been a 1.1%-1.3% decline in both sukuk and bond markets month-to-date. As of Nov 18, 2015, the S&P MENA Sukuk Index rose 1.05% YTD, while the S&P MENA Bond Index outperformed and gained 1.90% in the same period.

Exhibit 1: Total Return Performance

Source: S&P Dow Jones Indices LLC.  Data from Dec. 31, 2014, through Nov. 18, 2015.  Past performance is no guarantee of future results.  Chart is provided for illustrative purposes.
Source: S&P Dow Jones Indices LLC. Data from Dec. 31, 2014, through Nov. 18, 2015. Past performance is no guarantee of future results. Chart is provided for illustrative purposes.

The posts on this blog are opinions, not advice. Please read our Disclaimers.

India: Market Update for Q3 2015

Contributor Image
Mahavir Kaswa

Former Associate Director, Product Management

S&P BSE Indices

Key highlights of the past quarter that ended Sept. 30, 2015 were the continued fall in wholesale and retail inflation, the devaluation of the yuan and the subsequent reduction in interest rates by the Chinese government, the Fed keeping interest rates the same, and the reduction in the repo rate by the Reserve Bank of India (RBI).  Amid all these events, the third quarter of 2015 was weak for Indian markets, with India’s broad market index, the S&P BSE AllCap, posting a loss of 3.1% and the S&P BSE SENSEX declining further, at -5.4% (please see Appendix for a market heat map and monthly total returns).

During July 2015, most of the benchmark indices posted gains, and the S&P BSE MidCap and the S&P BSE SmallCap outperformed the S&P BSE LargeCap.  In August 2015, the Chinese government devalued the yuan to remain competitive in exports; the surprise move created apprehension in the global markets, resulting in a depreciation of various emerging market currencies.  August 2015 was the worst month of the third quarter, as all size and sector benchmark indices (except for the S&P BSE Information Technology and S&P BSE Healthcare) posted negative returns.  However, in September 2015, the Fed’s decision not to change its interest rates and the RBI’s decision to reduce its interest rate (the repo rate) by 50 bps helped the S&P BSE SENSEX to recover from its quarterly low of 24,833.54, as it closed marginally lower than the previous month, posting a return of -0.4%.

Within benchmark size indices, the S&P BSE MidCap was the best-performing index, with a total return of 1.9% during the quarter.  Large-cap stocks were the worst performing, with the S&P BSE LargeCap posting a return of -4.9% during the same period.  The S&P BSE SmallCap posted a marginal gain of 0.1% during the third quarter of 2015.

AllCap Exhibit

Source: Asia Index Private Limited.  Index performance based on total return in INR.  Data from June 30, 2015, to Sept. 30, 2015.  Past performance is no guarantee of future results.  Chart is provided for illustrative purposes.

To read the full Report, please click here.

The posts on this blog are opinions, not advice. Please read our Disclaimers.

Terror Attack On Paris May Shift The Oil War

Contributor Image
Jodie Gunzberg

Former Managing Director, Head of U.S. Equities

S&P Dow Jones Indices

Geopolitical developments often have a major impact on oil prices since they can affect oil supply directly and since the threat of future supply disruptions can also build a risk premium into oil prices. As a notable example, in the early part of 2014, conflicts in Libya and Iraq led to temporary outages in their oil production, keeping world prices high, even as supply elsewhere in the world continued to ramp up. When production from those two countries came back on stream, that was an important trigger for the plunge in oil prices later in the year.  Notice how much oil price spiked at the historical times of war.

Source: S&P Dow Jones Indices

While the S&P GSCI Crude Oil only is recorded since 1987, below is a chart that goes back to 1947 by WTRG Economics that shows spikes in oil price jumped more than 2 times on average during critical periods of conflict, including the Iran/Iraq War, Iranian Revolution, Yom Kippur War and Oil Embargo.

War Oil History

Generally, when there is a war, commodities perform well since it takes resources to fight a war and people will continue to drink coffee and eat cereal, which is the kind of fundamental economic diversification that makes this asset class important. For example, below is a graph of the S&P 500® versus the S&P GSCI during the Persian Gulf War that shows while stocks dropped, commodities rose.

Source: S&P Dow Jones Indices

In the recent environment, OPEC is committed to maintaining market share in the global oil markets. Shortly after the natural gas deal was signed between Russia and China, OPEC started flooding the market with oil to drop the price so marginal producers exited. This also happened in the 1986 period when OPEC dropped the price from $32/bbl to $10/bbl which may have led to the breakup of the Soviet Union. The current low oil price has divided the world by importers, exporters, developed and emerging markets

Now, just as the world is agreeing on a chance for structural reform, the picture may change again. The ISIS attack on Paris might be the catalyst to change OPEC’s oil market policy of defending market share. Saudi Arabia may need to alter their focus to support defensive measures rather than maintaining oil market share. There is a pivotal question about whether Saudi protects the long-term value of oil reserves or if they defend their role as the pre-eminent Sunni power in the region… both are important.

On a different note, the other major commodity associated with war is gold, as it is known for its role as a safe haven in times of market crises. Using rolling 12-month returns (monthly year-over-year) from Jan 1979 – Sep 2015 of the S&P 500, the result shows that whether there was a bull, bear or flat stock market, gold was positive at least half the time. The stock market condition didn’t necessarily say anything about gold returns, but gold performed well when there were bear market conditions. It was positive the highest percentage of the time, 74%, in bear markets that lost more than 20%, and on average gold gained 6.5% historically in this condition.

Source: S&P Dow Jones Indices

Since most single factors like inflation, interest rates, jewelry demand, oil prices, geopolitics and U.S. dollar strength don’t alone move gold, they are unreliable indicators of gold’s prices. However, one statistic that is pretty solid through time is that gold is uncorrelated to the stock market. On average, the 12- month correlation is zero but even on short intervals of rolling 90 days the correlation doesn’t ever exceed 0.6.

Source: S&P Dow Jones Indices

Based on this, the case can be made that gold has protected in down markets and has been a good diversifier.

In conclusion, despite the tragedy of the attack on Paris, commodities may help investors diversify through this difficult time. Oil prices have historically spiked in times of crisis, and with the production dilemma on the table for OPEC, Saudi may need to reallocate resources to national defense. There may be a demand reduction from the crisis but not enough to offset supply issues. This holds true for agriculture and livestock as well, that are more highly impacted by weather and may benefit from El Niño in the near future. Additionally, gold may also hold its role as a diversifier as it has in the past during stock market crises.


The posts on this blog are opinions, not advice. Please read our Disclaimers.

ETF industry in India over the years

Contributor Image
Utkarsh Agrawal

Associate Director, Global Research & Design

S&P Dow Jones Indices

It is well known that diversification lowers the risk. For example, say we want to travel from one place to another. We can take a bus. What if the route on which the bus plies is blocked for some reason? We can consider taking another bus which travels on a different route. What if all the bus operators are on strike? We can consider taking a taxi. What if all the taxi operators are also on strike? We can consider travelling by train. By keeping the options open or diversifying the modes of travel we are trying to reduce the risk of not being able to reach the destination. Investors can also use the power of diversification to lower their investment risks. Exchange traded funds (ETFs) are a means by which investors can diversify their investments across a range of asset classes or to pursue investment strategies.  In India in recent years the number of ETFs offered and assets under management have increased, except for gold ETFs.

In the capital markets, investors can pick and choose a security or invest in a basket of securities that is diversified, meaning the securities are expected to move up and down under different market conditions. Of course, the inherent risk of investment loss would be lower for the basket than for a single security. However, monitoring a basket involves much more effort in comparison to a single security. Hence the mutual fund industry was born where investors were able to pool their money and let the professionals manage it for a fee, and reap the benefit of diversification. At the same time, investors were also liberated from the chore of monitoring the basket.

The mutual fund industry can again be divided into active funds versus index funds, which is a passive investment style. In the active space the manager makes active investment decisions on stocks in an effort to generate alpha. However in an index fund, the manager simply attempts to replicate an index with minimum tracking error. The benefit of index fund is lower expense ratio due to lower management fees. As the markets evolved, investors realized that mutual funds, whether active or index, are not tax efficient since the capital gains realized on the sale of fund investments, including to meet redemption requests, is distributed across all the existing investors based on fund ownership.

Exchange traded funds (ETFs) were invented to be more tax efficient in addition to having lower expense ratios than mutual funds. As the name suggests, ETFs are traded on the stock exchanges throughout the day, unlike the mutual funds which are purchased or redeemed only on an end of day basis. With the introduction of ETFs, the smaller investors were able to gain access to some of the asset classes that were previously accessible to only the institutional investors. ETFs also have helped in the price discovery of some of the less liquid asset classes. The most noteworthy feature of an ETF is transparency as the underlying securities and their quantities held are declared on a daily basis.

ETFs were first listed in developed nations in early 1990s and have grown tremendously in terms of the number of ETFs listed as well as the assets under management. In India the first ETF was listed in the year 2002. Since then the number has gone up to 49 as of June 30, 2015 (see Exhibit 1).

Exhibit 1: Total Number of ETFs in India. Date as of June 30, 2015

ETF Exhibit 1

Source: S&P Dow Jones Indices, Morningstar, Association of Mutual Funds of India, Factset and Bloomberg 

It is interesting to note that in India the presence of ETFs is not in one but four different asset classes and the two major categories are equities and commodities. The equity ETFs are primarily large cap with some focusing on mid cap and financial sectors. The entire commodity ETFs are based on gold.

From Q2 2006 through Q4 2007, the quarterly asset under management in the equity ETFs soared and reached INR 73.83bn in Q4 2007 (see Exhibit 2). Since then it declined during the recession and reached the lowest at INR 4.01bn in Q2 2009. The asset under the management again started picking up since Q2 2014. This can be attributed to the improved market conditions as well as the introduction of the CPSE ETF which comprises almost 36% of the assets within the equity ETFs as on June 30, 2015.

Gold has been one of the popular investment options amongst the Indians as a store of value. From Q2 2009 onwards, gold ETFs have had the highest share of the quarterly average assets reaching INR 118.52bn in Q1 2013 (see Exhibit 2). Since Q2 2013, the asset under management in gold ETFs have declined by more than half due to various reasons such as strengthening of dollar, lesser demand for gold in domestic market due to import restrictions, amongst others.

There is only one fixed income ETF focusing on 10 year Indian government bonds and one liquid ETF. The fixed income ETF is relatively new while the money market ETF has been there since 2003.

Exhibit 2: Quarterly average asset under management of ETFs in India. Date as of June 30, 2015

ETF Exhibit 2

Source: S&P Dow Jones Indices, Morningstar, Association of Mutual Funds of India, Factset and Bloomberg

The liquidity profiles of the ETFs also reveal some interesting facets of this industry. Historically the gold ETFs combined have remained most liquid followed by money market ETF. But in more recent times, money market ETF has been the most liquid ETF and equity ETFs combined have been the second most liquid ETFs (see Exhibit 3). During 2011 through 2012, gold ETFs were aggressively pursued by the investors. In Q3 2011, the combined quarterly average daily value traded of the gold ETFs was more than INR 800mn. Since Q2 2013, the liquidity has reduced which is also augmented by the fact that the asset under the management have declined since then.

Exhibit 3: Average daily traded value of ETFs in India. Date as of June 30, 2015

ETF Exhibit 3

Source: S&P Dow Jones Indices, Morningstar, Association of Mutual Funds of India, Factset and Bloomberg

The ETF industry in India has been very dynamic over the years and it is still growing. Unlike some of the developed nations where active ETFs also exist, India only has passive ETFs. Indices play a major role in the functioning of the passive ETFs which simply try to mirror the benchmark index they are based on. With more and more investors becoming aware of the potential advantages of this investment product, it will continue to grow and help investors in their quest for diversification with lesser cost and tax efficiency.

The posts on this blog are opinions, not advice. Please read our Disclaimers.