Get Indexology® Blog updates via email.

In This List

RECORD BREAKING MONTH: Commodities Love War and Heat

Hope is a Good Thing

Next Steps for India?

The Rupees's One Way Slide - Is There a Silver Lining?

Too High or Too Low? Look at Tobin’s Q

RECORD BREAKING MONTH: Commodities Love War and Heat

Contributor Image
Jodie Gunzberg

Former Managing Director, Head of U.S. Equities

S&P Dow Jones Indices

August was a hot month for commodities from the Syrian unrest and the heat.  In the risk on – risk off environment created by the quantitative easing, the sentiment has shifted to risk off. While that is not good news for some economically sensitive commodities like copper, it is great news for others like precious metals, which was the best performing sector for the month, up 7.9%.  The S&P GSCI Silver had its best August ever on record since 1973, gaining 19.5%.  Also, the heat was a factor that drove the S&P GSCI Soybeans to have its 3rd best August on record and the best since 2003.

Below are the highlights from our monthly commentary:

All five sectors of the S&P GSCI had positive returns in August, driving the index
up 3.4% MTD—now in positive territory for the year, up 2.6%.

  • S&P GSCI Precious Metals was the best performing sector, up 7.9% MTD, due to political tensions in Syria. During the month, silver was the best performing commodity in the index, up 19.5%, recording the best August in its history.
  • S&P GSCI Energy also benefited from the oil supply concerns from Syria, driving the sector index up 4.0% for the month.
  • Hot and dry weather in the U.S. Midwest was another major fundamental driving commodities in August, which pushed S&P GSCI Soybeans up 12.5%—its third best August since 1970.
  • Sugar and coffee, down 3.7% and 4.0%, respectively, were the worst performers of the month thanks to pressure from record harvests.

Also below, are the Q&A from our commodities clip:

Q1.  In July, you titled your commodities commentary as “some commodities like it hot”, so tell us, which commodities liked the hot weather of August?

Soybeans benefited the most in August from the hot and dry weather across the US Midwest.  It was the 3rd best August on record since the index data started in 1970.  This month the S&P GSCI Soybeans was up 12.5%, the most in an August in 10 years when it was up 15.8%. The only time prior to that with a bigger August monthly gain was in 1983 with a rise of 26.6%.

Q2.  There has been lots of news about the political unrest in Syria. How has this affected commodities?

Historically war has been supportive for commodities since raw materials are consumed at a high rate to fight wars. In the risk on/risk off environment we are experiencing from the quantitative easing, the potential of war has helped precious metals as the sector may also be viewed as a safe haven or a currency. The S&P GSCI Precious metals was the winning sector in August up 7.9%. Gold, the main commodity in the sector gained 6.3% in August and is now up 13.9% from the end of June, after it fell into a bear market down 23.4%.  However,  Silver in the index gained 19.5%, recording its best August since the index started in 1973. This was also its best month since April 2011, cutting its YTD loss from 35.5% to 22.9%.

Q3. Has the weather caused any commodities to be not so hot in July?

Sugar and Coffee were the biggest losers in August, down 3.7 and 4%, respectively, and coffee is the worst performing commodity YTD, down 24.9%.   An outbreak of a leaf-rust fungus in Central America is causing crop damage; however, some areas in Brazil, Colombia, and Vietnam are having record harvests.

Q4. Is there anything else you would like to add?

The S&P GSCI had another strong month, up 3.4% in August, bringing the YTD performance into positive territory up 2.6%.  The fundamentals like weather continue to drive commodities but the macro themes are strong including Chinese demand and the quantitative easing. Many will be watching the US Fed on September 18 when it may discuss its bond-buying program. If yields remain low and stall the dollar’s rise, that could give commodities priced in US dollars a positive boost.

The posts on this blog are opinions, not advice. Please read our Disclaimers.

Hope is a Good Thing

Contributor Image
Alka Banerjee

Former Managing Director, Product Management

S&P Dow Jones Indices

The unprecedented decline of the Indian Rupee has been the headline for the past few weeks. The chief drivers have been high current account deficits fuelled (literally) by oil- the sluggishness of the Indian economy driving out foreign investments, which had been impacted by the tapering of the quantitative easing program of the Federal Reserve in the US. No clear and easy solution in sight has further exacerbated the situation.
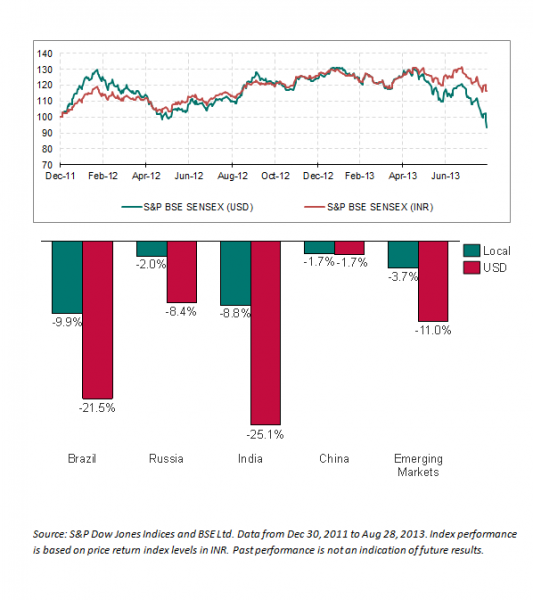
So, how does this all show up in the world of indices? The S&P Indian Rupee Total Return index, constructed using forward currency contracts and designed to replicate the performance of the Indian Rupee versus the U.S. Dollar, is down 16.64% year to date (as of August 28). Another way to look at the currency performance is contrasting the returns of the S&P BSE SENSEX in rupee and USD terms. On a year to date basis the USD version of the S&P BSE SENSEX underperforms the former by 17.5%. A comparison of the various S&P BMI country indices computed in the local currency versus that computed in U.S. dollars highlights that this is not a unique Indian situation. Looking at the returns for BRIC countries and overall emerging markets year to date (August 28) 2013 show that while Indian markets were not the worst performing in terms local currency but were in USD terms. Brazil is quite close to emulating both the performance of the Indian market in rupee and dollar terms as the real has had a similar slump while the Chinese market and currency have been extremely resilient. The tight band that the Chinese renminbi is allowed to trade in, along with the much stronger economic situation of China, has helped to stem the fall. The broad emerging markets have not done well this year as almost all emerging market currencies have come under pressure after the U.S. Federal Reserve indicated a pull back of the quantitative easing program.

Whether the Indian rupee decline has an impact on the stock market is still to be seen. No doubt the market has been extremely volatile in the last few weeks with some surprising short term upswings in the midst of all the gloom. While there is little dollar denominated sovereign debt, Indian companies, which borrowed in dollar terms this past year as rates were low and companies heavily dependent on imports should see some pressure especially if growth remains anemic.

Hope is a good thing_Alka

The posts on this blog are opinions, not advice. Please read our Disclaimers.

Next Steps for India?

Contributor Image
John Davies

Former Managing Director, Global Head of Exchange Traded Products

S&P Dow Jones Indices

It could be said that the ETF business has been a 20 year “overnight” success. Since the introduction of the first ETF back in 1993, we have seen a global expansion across multiple Exchanges and a diverse product offering. As at the end of July 2013, there were 3,441 ETFs, with 7,792 listings, assets of over US$2bn from 185 Providers on 55 Exchanges (Source:ETFGI). S&P Dow Jones Indices has been at the forefront of this phenomena licensing the underlying index for the very first ETF SPDR® S&P 500® ETF (SPY). Currently there are approximately US$595bn in ETFs linked to S&P Dow Jones Indices (Source:ETFGI).

Whilst the first ETF launched in India back in 2002, the Indian ETF market can still be considered nascent considering its relative position compared to the domestic Indian Mutual Fund Market. Currently there are 37 ETFs with approximately US$1.7bn in assets, which accounts for only 2% of the assets Indian Mutual Funds (Source:ETFGI). However, the number of ETFs has more than doubled in the last five years and there are now 15 Issuers in the market, providing access across the country’s two major Exchanges.

In addition, recent initiatives such as the ban of payment of distribution fees to financial advisers, greater requirement on transparency of fees and the lowering of the securities transaction tax fees on ETFs have levelled the playing field for usage of ETFs by retail investors. Institutional investors, such as Insurance Companies, are also seeing changes whereby regulation will allow increased investment allocations through ETFs. The recent announcement of the Government-led project to launch an ETF based on Public Sector Companies, the CPSE ETF, is further evidence of utilisation of the ETF structure. Looks like this could be the road ahead for index investing in India.

The posts on this blog are opinions, not advice. Please read our Disclaimers.

The Rupees's One Way Slide - Is There a Silver Lining?

Contributor Image
Lakshmi Iyer

Senior Vice President

Kotak Mahindra Asset Management

In the past few weeks, most of the Indian treasury desks have taken on a war-room look. Too many events got crammed in relatively short time. Most of us know that Rupee has seen a near oneway slide against the dollar, losing nearly 26% in value in last 2 years. It’s but natural that RBI would react to this punter run. The question is, how effective would these measures be, in dissuading offshore transactions. For now, the banking system is scrounging for liquidity, which is increasing supply pressure on many asset classes.
It is clear that RBI’s intervention is aimed to stabilizing the Rupee rather than to regain lost ground; and thus arrest inflationary pressure.

And yes! There is a silver lining to this. If India is able to achieve foreign exchange stability and restrict inflation, we would have higher cost competency in dollar terms. This in turn should attract and induce higher FDI and domestic capital into the export oriented manufacturing sector over the period.

But what is required is that our policy makers are ready to realize this specter of opportunity, because India still ranks 132nd, behind even some of the war torn MENA countries. With the new growth ‘normal’ at around 5-5.5%, many of the entrepreneurs would not look at India until the cost of business in India is brought down. The markets would remain glued for the next policymaker move in this regard.

Indeed interesting times ahead.

S&P Dow Jones Indices is an independent third party provider of investable indices.  We do not sponsor, endorse, sell or promote any investment fund or other vehicle that is offered by third parties. The views and opinions of any third party contributor are his/her own and may not necessarily represent the views or opinions of S&P Dow Jones Indices or any of its affiliates.

The posts on this blog are opinions, not advice. Please read our Disclaimers.
Too High or Too Low? Look at Tobin’s Q

Contributor Image
David Blitzer

Former Managing Director and Chairman of the Index Committee

S&P Dow Jones Indices

August was not the best of months in the stock market: the S&P 500 lost 3.1% and the Dow lost 4.4%.  This leaves investors wondering what’s next?

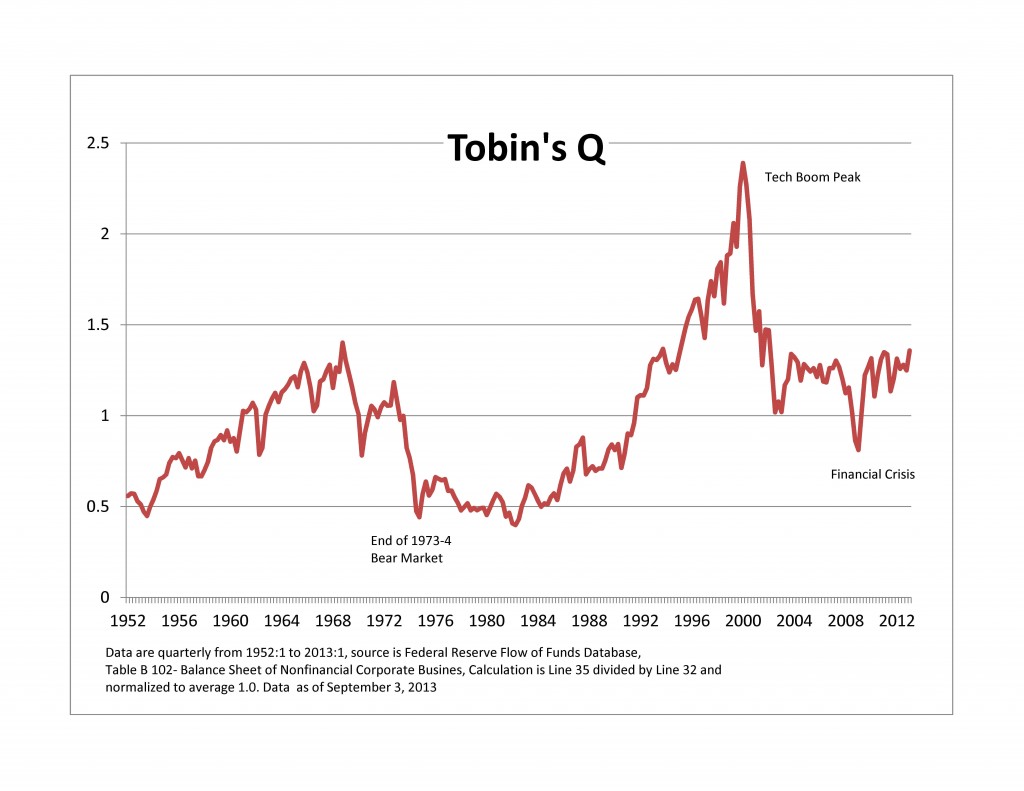
The stock market bounces up and down more often with more amplitude and less method to its madness than the rest of the economy.   If one could get past the noise in the market, there should be a financial measure of the economy’s value – an indicator that based on the financial data of the stock market and the value of the economy.  Tobin’s Q does this; it is the ratio of the market value of stocks to the replacement cost of their assets.  It was developed by James Tobin, a Nobel laureate economist some 25 years ago.  If one could buy all the assets of all the companies in the market for less than the market value of those companies, the companies would be over-valued and Tobin’s Q would be greater than one.  If the reverse – the cost of buying the assets of all the companies is greater than the market value – is the case, the market is under-valued.  From time to time, the stock market value of an oil company seems to lose any connection to the value of the company’s oil reserves.  If an oil company’s reserves are worth $30 billion while its market value is $10 billion, some analyst will suggest “drilling for oil on Wall Street” and Tobin’s Q for the company, assuming the only asset were the reserves,  would be one-third.

We can calculate Tobin’s Q for nonfinancial corporations in the US using data from the Federal Reserve’s Flow of Funds (FOF) database.   The FOF includes a consolidated balance sheet which shows both historic and replacement cost series and the market value of equities.  While the average level of Q over a very long time period should be one if the data are comprehensive, the average from 1952 to the first quarter of 2013 is a bit less at 0.74.

To make the chart easier to interpret, the series is normalized to average one over the entire time period.  The chart shows the three times since the 1950s when the S&P 500 lost about half of its value – 1973-4 Bear market, the aftermath of the Tech Boom and the financial crisis. Tobin’s Q warned about each of those.  As of the first quarter of this year, Q was moving higher. It is nowhere near as high as it was when the Tech stocks peaked, but it is back at levels seen before the financial crisis.

tobins q

Tobin’s Q is not the only market signal attracting attention.  The Financial Times wrote a long piece about CAPE – the cyclically adjusted P/E ratio developed by Robert Shiller, one of the developers of the S&P/Case-Shiller Home Price Indices. As the FT notes, there is a lot of debate about what CAPE is signaling. The paper also compares CAPE and Q.

The posts on this blog are opinions, not advice. Please read our Disclaimers.